Downloaded 105 times


![Macroeconomic Framework 43
with 6 per cent achieved in the Eleventh Plan. 2.27. The fixed investment rate fell after 2007–08,
Construction, which grew at 9 per cent in the initially on account of global factors, and later also
Eleventh Plan, is projected to grow at an average owing to difficulties in the domestic arena which
rate of 8.4 per cent, again presumably because of affected the pace of implementation of projects. The
the depressed level at the start of the Plan period. initial estimate for the GFCF rate in 2011–12 at con-
The other service sectors are projected to grow stant prices is 32 per cent. The rate of gross domes-
fairly robustly with Trade Hotels and Restaurants at tic capital formation (GDCF), which includes stocks
8.4 per cent; Transport, Storage and Communication and valuables, but not other errors and omissions,
at 11.8 per cent; Insurance and Business Service at is 37.9 per cent, of which valuables is 2.8 per cent
9.6 per cent, and, finally, Community and Personal of GDP.
Services at 6.7 per cent.
2.28. For annual output growth to average 8.2 per
INVESTMENT cent in the Twelfth Plan period, and to approach
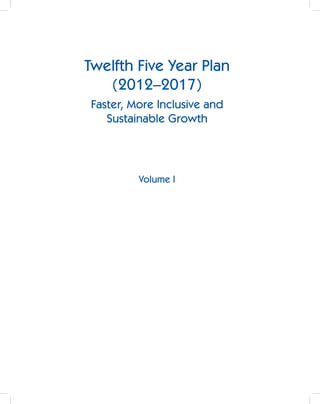
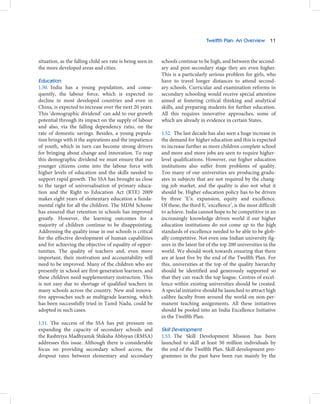
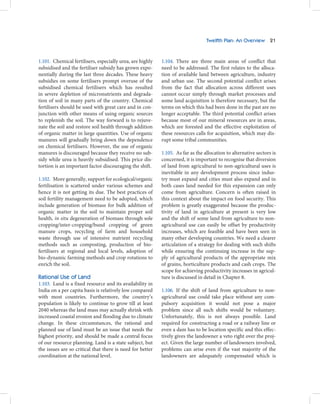
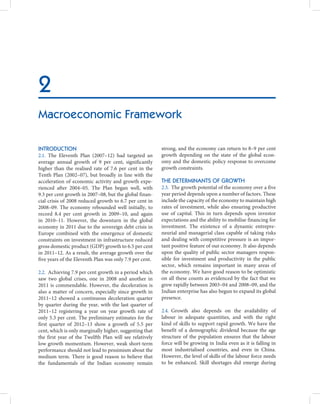
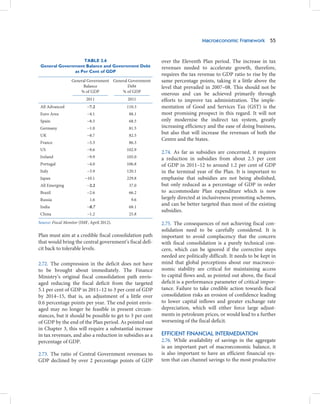
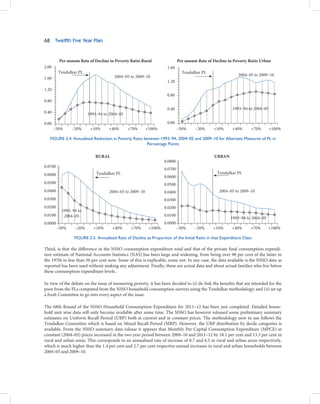
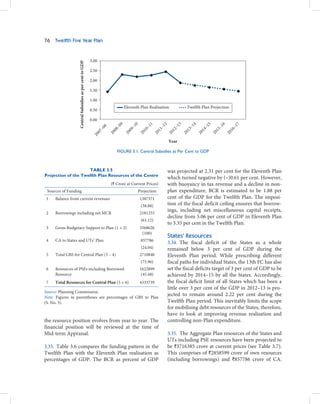
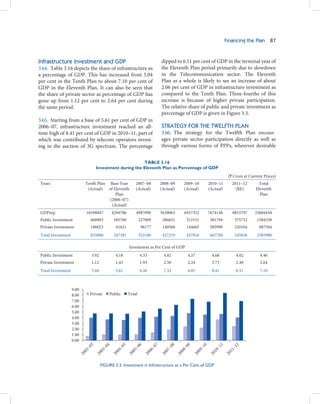
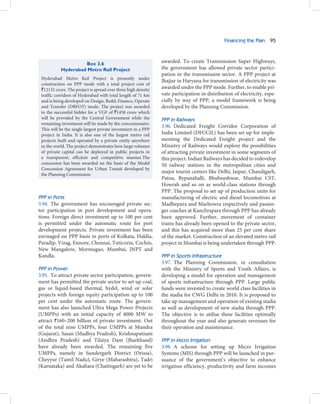
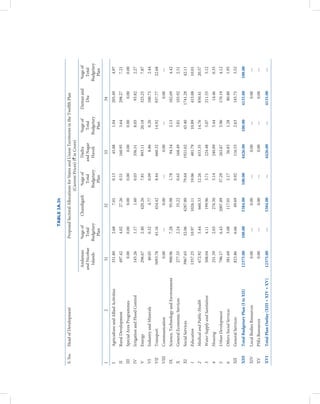
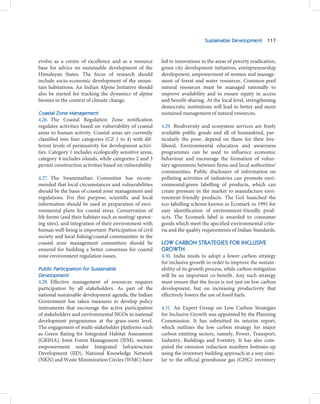
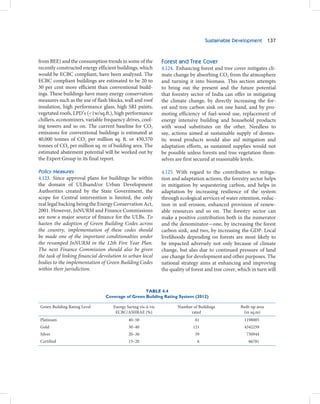
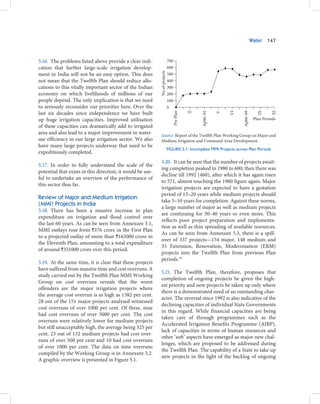
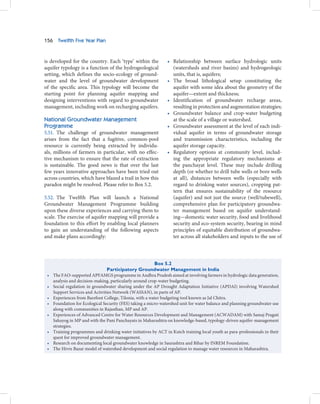
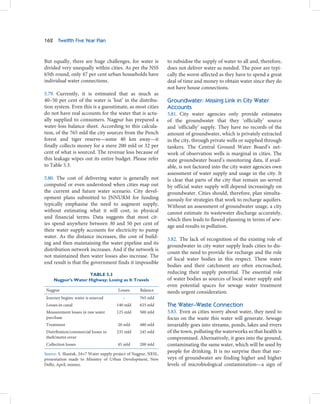
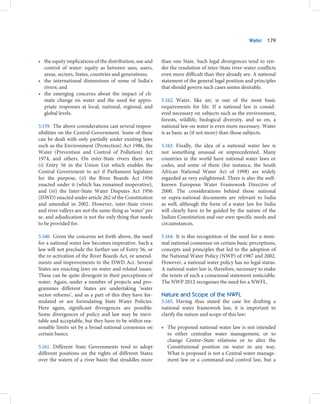
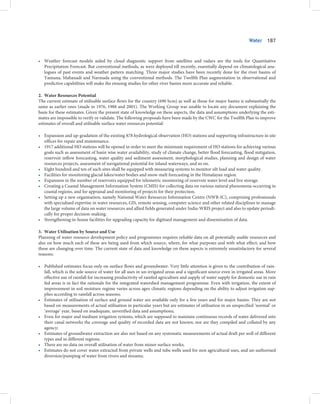
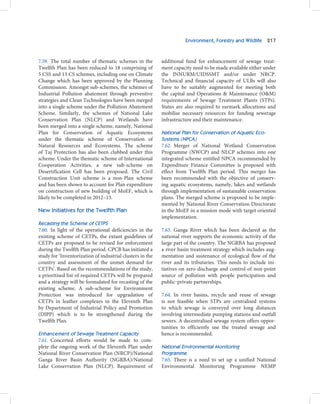
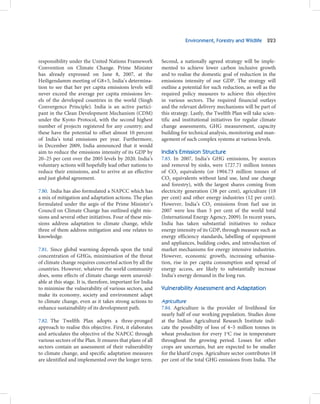
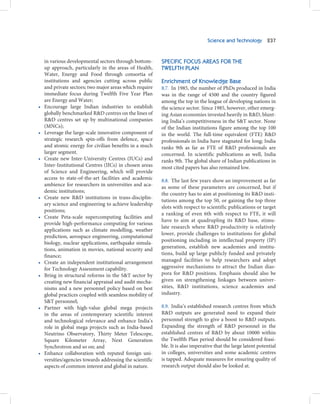
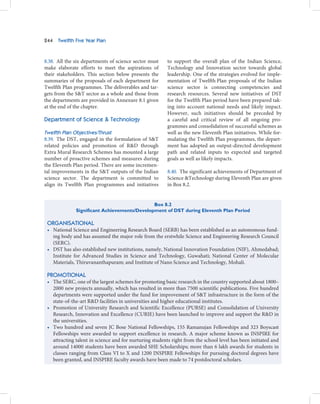
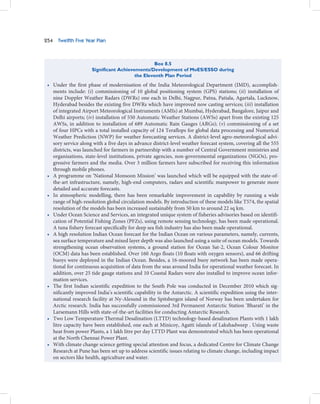
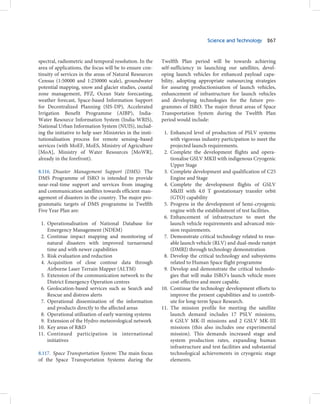
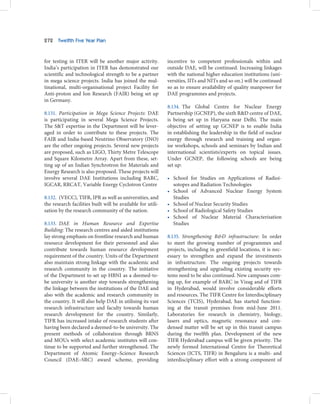
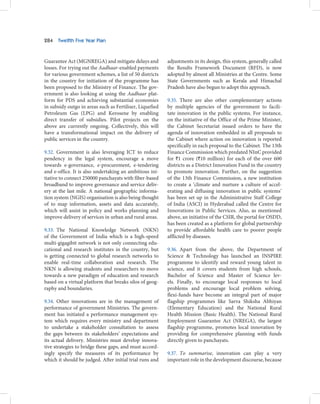
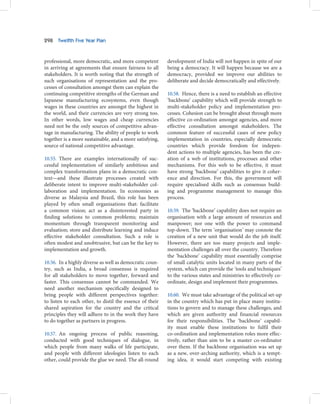
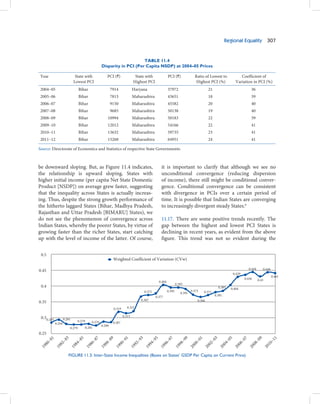
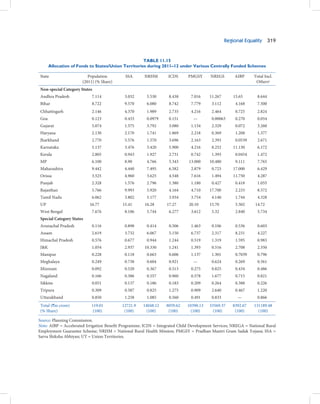
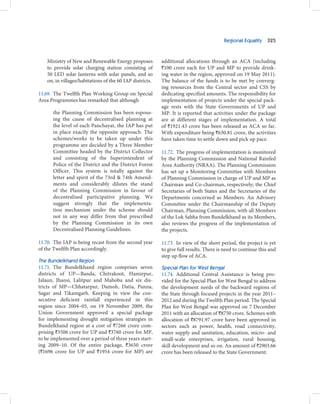
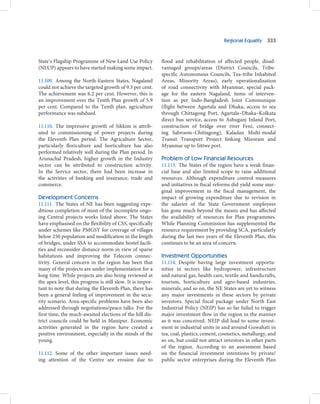
2.26. The ability to raise the rate of investment (ratio 9 per cent in the terminal year, it is estimated that
of gross fixed capital formation [GFCF)] to GDP) the fixed investment rate will have to increase by
is widely regarded as critical for the achievement about 3.0 percentage points of GDP over the level
of high growth. As shown in Figure 2.2, the period in 2011–12. The resulting trajectory of fixed invest-
when the economy grew rapidly after 2003–04 and ment over the Plan period is shown in Table 2.2. The
up to 2007–08 was a period when the investment rate fixed investment rate should increase to 35 per cent
increased. The fixed investment rate rose steadily of GDP (at constant prices) by the end of the Twelfth
after 2003–04 and peaked at close to 35 per cent in Plan, yielding an average fixed investment rate of
2007–08. Total capital formation—which includes 34 per cent of GDP for the Twelfth Plan period as
inventories and investment in valuables—was higher a whole. These levels are marginally higher than
at 39 per cent in that year, but for growth what mat- what was achieved in the Eleventh Plan but they are
ters is the fixed investment. broadly consistent with achieving an average real
35%
30%
25%
20%
15%
10%
1980
1982
1984
1986
1988
1990
1992
1994
1996
1998
2000
2002
2004
2006
2008
2010
2012
FIGURE 2.2: Fixed Investment Rate—Ratio to GDP—Over the Years](https://image.slidesharecdn.com/vol1-130312055349-phpapp02/85/The-12th-Five-year-Plan-Volume-1-49-320.jpg)


![Macroeconomic Framework 53
Prospects for Mobilising External Finance the banking channels was just 0.4 per cent of GDP
2.59. The capital inflow required to finance a pro- during the course of the Eleventh Plan.
jected average current account deficit of 2.9 per
cent of GDP can take several forms including FDI, 2.63. Total capital inflows from all sources thus
Foreign Institutional Investor (FII) flows, and vari- averaged 4.1 per cent of GDP in the Eleventh Plan
ous types of debt including short-term trade credit period. This volume of capital inflows was signifi-
and official external assistance. Our objective should cantly higher than the financing required for the
be to finance the deficit as much as possible through 2.7 per cent current account deficit, and the excess
stable foreign inflows. This means emphasising FDI was accumulated in the foreign currency assets
and minimising short-term debt in particular. The (including special drawing rights [SDRs] and gold)
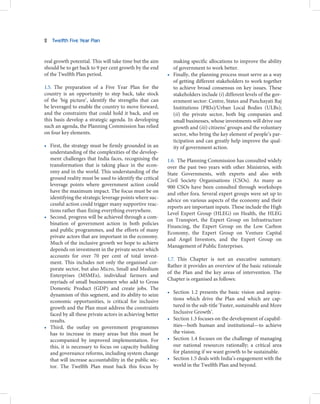
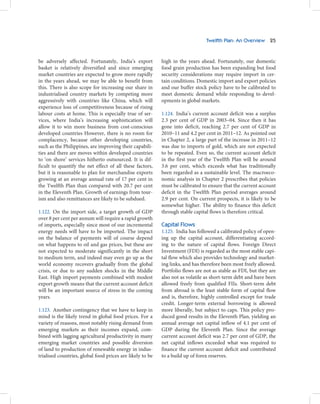
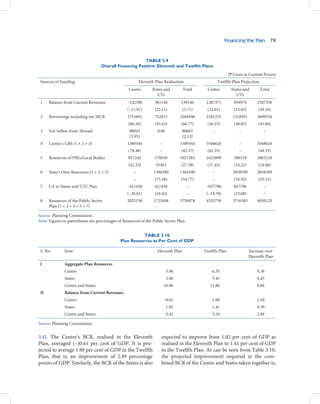
pattern of capital flows in the Eleventh Plan period of the Reserve Bank of India (RBI).
and projection for the Twelfth Plan are summarised
in Table 2.3. 2.64. The baseline projections made for the Twelfth
Plan, as presented in Table 2.4, are based on con-
2.60. In the Eleventh Plan, inflows by way of FDI servative assumptions, keeping in mind the cur-
ranged between 1.4 and 2.8 per cent of GDP, averag- rent uncertain conditions in the global economic
ing 2.2 per cent of GDP. In the same period, there environment. This uncertainty is bound to lead to
risk aversion, and also conservative assessment of
were also outflows as Indian companies acquired
the relative attractiveness of India as a destination
overseas assets and this ranged between 1.0 and
for global capital in present circumstances. On this
1.5 per cent in various years, being much higher in
basis, the inbound FDI flows are projected to be
2007–08 and 2008–09, averaging 1.1 per cent for the
slightly less than that in the Eleventh Plan, to average
Eleventh Plan period as a whole. In 2011–12, out-
1.8 per cent of GDP. It is likely that outbound FDI
bound FDI flows were much lower at 0.6 per cent
will also be lower than in the Eleventh Plan level, and
of GDP. The net FDI inflow was thus 1.1 per cent of
is projected to be 0.7 per cent of GDP, and as a result
GDP for the Eleventh Plan as a whole.
the net inflow of FDI will remain almost unchanged
at 1.0 per cent of GDP.
2.61. Portfolio equity inflows fluctuated to a greater
extent, from 1.1–2.4 per cent of GDP in the Eleventh 2.65. Portfolio equity inflows are volatile and given
Plan period, and averaged 1.3 per cent of GDP for the global conditions that have been prevalent for
the Plan period as a whole. It is worth noting that some time, our projections assume that the total of
they were highest at 1.1 per cent in 2008–09, the year such inflows would be only around 0.5 per cent of
immediately after the financial crisis but otherwise GDP, much lower than the 1.3 per cent recorded in
they were positive in every year. This suggests that the Eleventh Plan. This assumption is almost cer-
while FII flows are more volatile, than FDI, they are tainly unduly cautious. Early resolution of some
not the same as ‘hot money’. of the uncertainties that have arisen in the mind of
foreign investors in India, combined with a visible
2.62. Loan capital inflows occur mostly through resumption of growth momentum in 2013–14, could
external commercial borrowings (ECBs) of Indian easily lead to stronger inflows in the remaining years.
private and public sector companies and non- An average of 1 per cent of GDP over the Plan period
resident bank deposits. Short-term trade loans as is not at all infeasible.
well as FII investment in Indian government and
corporate debt securities are also significant. Net 2.66. Loan and banking capital inflows, net of repay-
inbound official assistance now forms a relatively ments, taken together are expected to be 1.7 per cent
small component of capital inflows. These sources of GDP, lower than that the 1.9 per cent recorded in
taken together accounted for 1.5 per cent of GDP in the Eleventh Plan. Taking all the flows together, the
the course of the Eleventh Plan. Net inflow through total of capital inflows in the Twelfth Plan is expected](https://image.slidesharecdn.com/vol1-130312055349-phpapp02/85/The-12th-Five-year-Plan-Volume-1-59-320.jpg)


![Sustainable Development 119
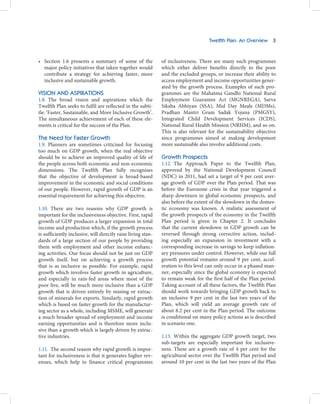
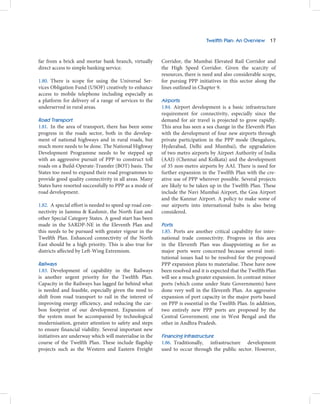
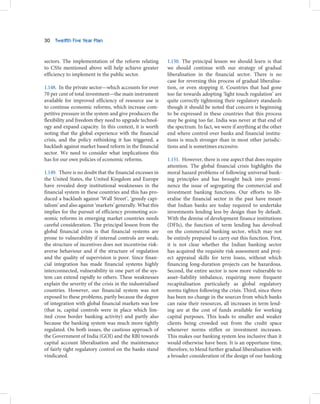
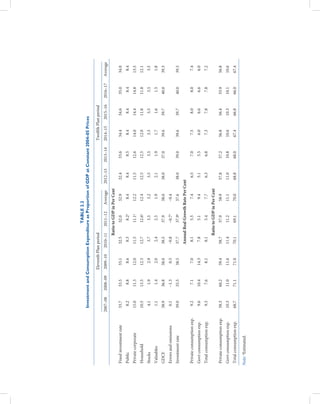
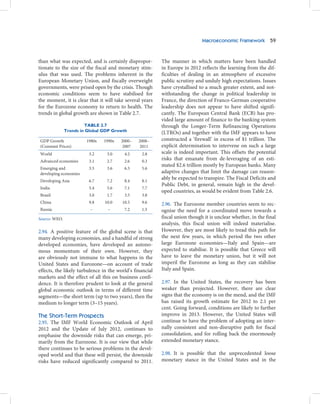
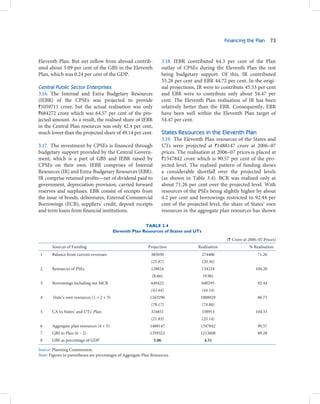
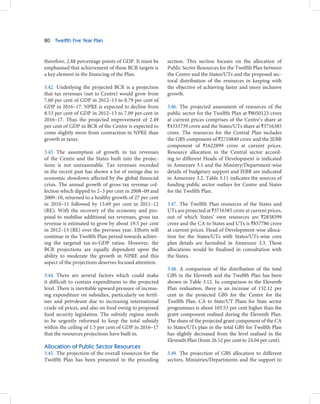
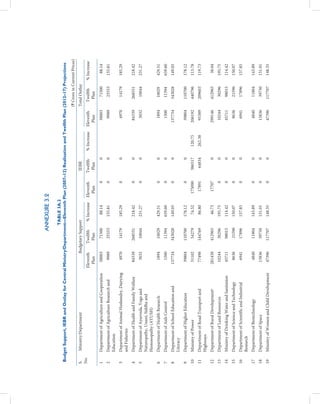
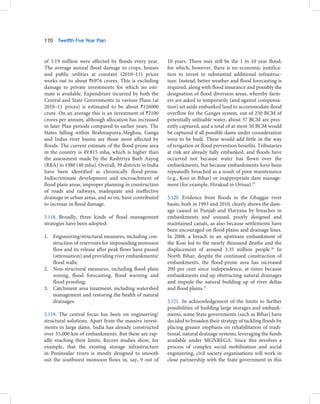
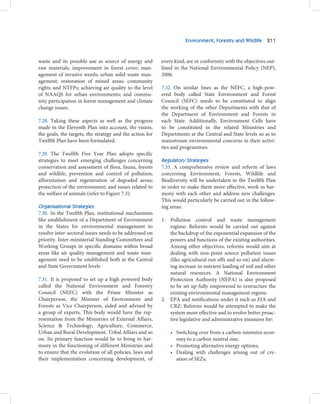
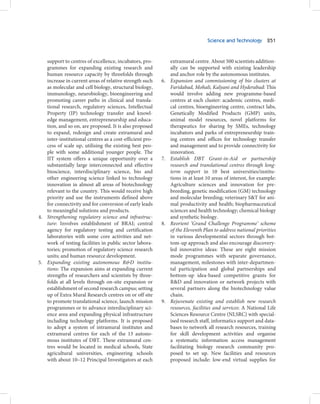
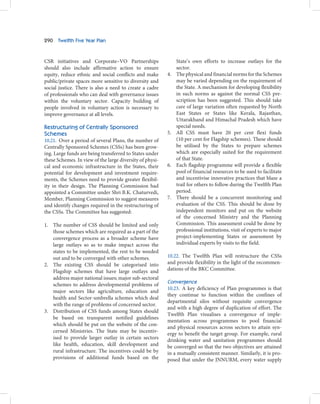
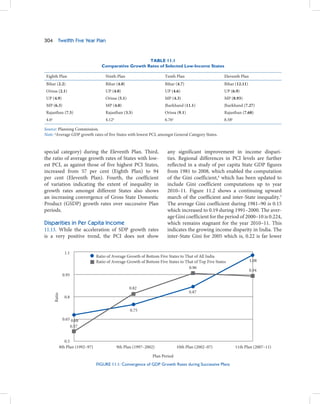
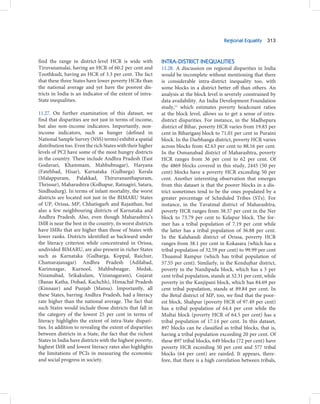
Box 4.2
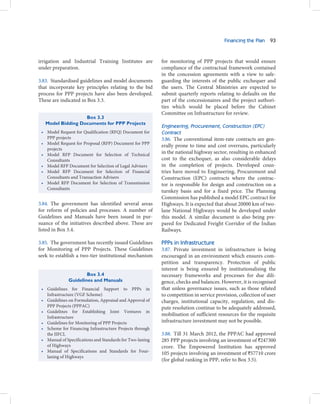
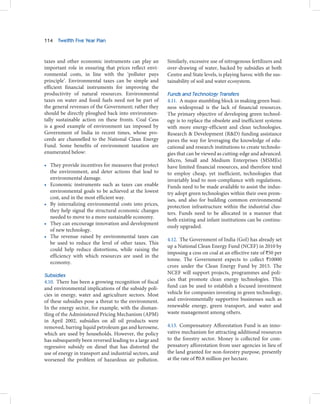
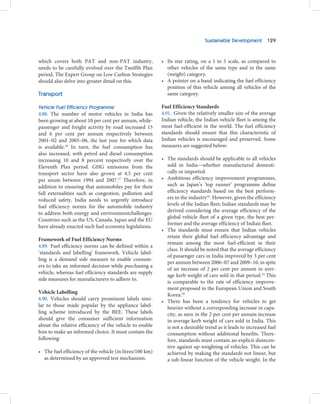
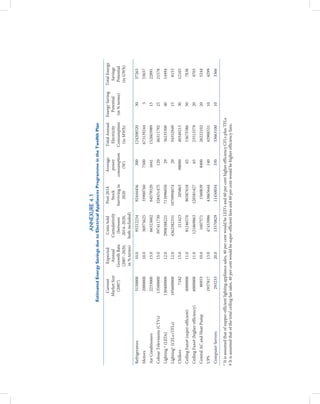
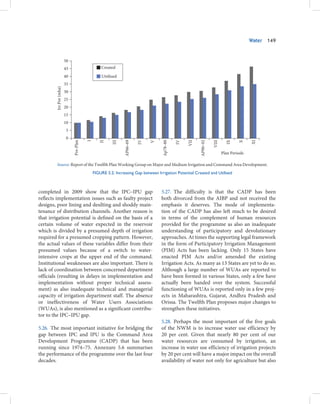
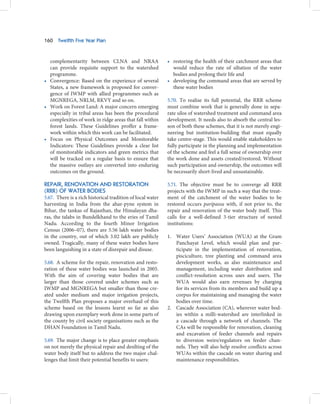
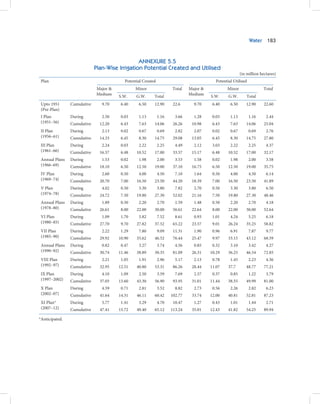
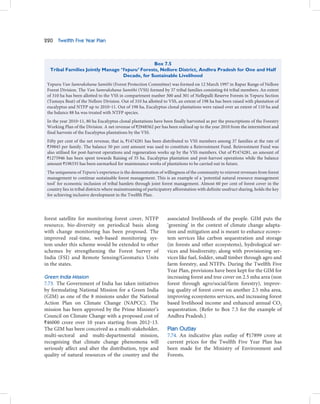
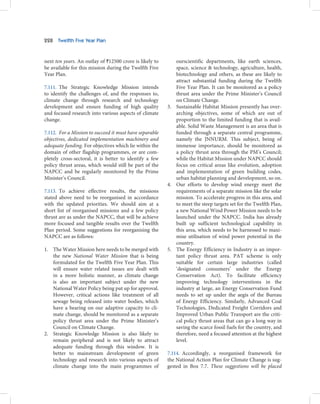
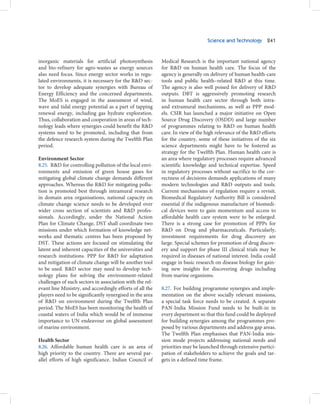
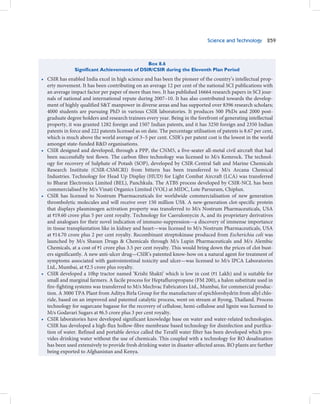
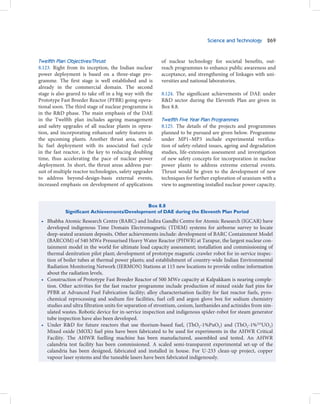
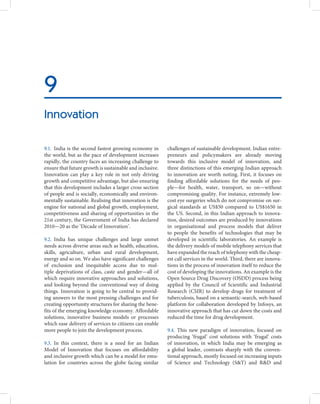
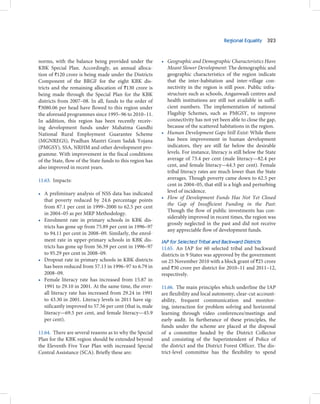
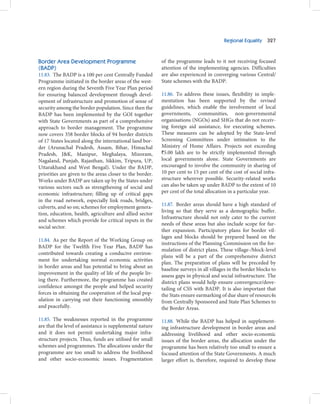
Importance of Clean Coal Technology: Ultra-super Critical Power Plants
An Ultra Super Critical (USC) coal-based power plant has an efficiency of 46 per cent compared with 34 per cent for a sub
critical plant and 40 per cent for a Super Critical (SC) plant. Thus, with an USC or SC plant, the savings in coal consumption
and reduction in CO2 emission can be substantial. A 10,000 MW power plant will generate 60 billion units of electricity per
year at around 70 per cent load factor. It has a specific heat of 1870 kcal/kwh compared to 2530 kcal/kwh for a sub-critical
plant. Thus, every unit generated with USC will save 0.165 kg [(2530-1870)/4000] coal of 4000 kcal/kg; and 60 billion units
will save 9.9 million tonnes of coal per year.
When we substitute a sub-critical coal plant with solar plants, for every kwh generated we save 0.63 kg of coal (2530/4000).
Thus, 15.6 billion units (1000*9.9/0.63) will have to be generated by solar plants to save the equivalent 9.9 million tonnes
of coal. Since a solar plant generates 1500 units per KW of installed capacity, the matching installed capacity needed will be
nearly 100,000 MW (15.6*1000/15000). To put it simply, faster adoption of USC and SC technology can save as much coal as
would be saved by installation of ten times the solar power capacity. While from a long term perspective we need the solar
option, from a medium term perspective, development of USC and SC technology should be pursued vigorously.
also requires the development of special materi- increases the power generation potential. At the
als that can withstand high temperatures and pres- same time, the size of wind turbines has increased—
sures. The government should support research and while the earlier turbines were typically less than
development to promote indigenous manufacturing 1 MW, the recent designs go up to over 5 MW. Taking
of USC units. The first USC plant, which is a joint these into consideration, the wind potential in India
effort of BHEL, NTPC and IGCAR, is expected to is now estimated at about 103000 MW for 80 m hub
be operational in 2017. Deployment of USC plants height. This is based on meso-scale weather models
may be suitably incentivised and targeted during the and a land utilization rate at 2 per cent thought to be
Thirteenth Plan period. reasonable for Indian conditions. Some recent stud-
ies have estimated India’s wind potential to be over
4.37. Coal gasification provides opportunities for 500000 MW based on still higher hub heights and
higher efficiency. However, Indian coal has very high more land availability. However, this assessment is
ash content and initial results suggest that efficiency yet to be validated by experts working under Indian
gain over sub-critical units is only marginal. Under- conditions.
ground coal gasification is an important technol-
ogy since it enables utilisation of deep coal deposits, 4.39. Recent technological innovations, including
which cannot be mined using conventional means raising the height of the tower, could make wind a
or because they are located in environmentally frag- major renewable source of power generation for
ile regions. It also allows the possibility of in situ India and we could safely target a wind capacity
carbon capture. Given India’s coal shortage, there addition of 30000 MW by 2020. However, as noted
should be greater research in this technology, includ- in Chapter 12, wind potential is unevenly distributed
ing execution of a few pilot projects. Another poten- across the country; only Karnataka, Tamil Nadu,
tially promising technology is coal bed methane and Andhra Pradesh, Maharashtra and Gujarat have
it may be desirable to undertake some pilot action in significant potential. Therefore, realisation of wind
this regard. potential requires careful regional level planning and
coordination.
Wind Power
4.38. India has a potentially large capacity for adding 4.40. Wind power has significant seasonal and even
generation capacity based on wind power. Since, the intra-day variations. Therefore, setting targets for
power generated by a wind turbine is highly sensitive wind power capacity addition, without making a
to wind speeds, the global practice is now to build careful assessment of the capacity of the regional grid
towers in the range of 80–120 m, which significantly to balance its intermittency with alternative sources,](https://image.slidesharecdn.com/vol1-130312055349-phpapp02/85/The-12th-Five-year-Plan-Volume-1-125-320.jpg)


![176 Twelfth Five Year Plan
because of the lack of capabilities and understanding landowner the right to take substantially as much
at lower levels of the institutional ladder is sought groundwater as she or he desires from wells dug
to be taken care of through the concept of phased on own land. Landowners do not own ground-
institutional transition by providing step-wise, gate- water but enjoy access as part and parcel of their
protected processes for gradual introduction of the ownership rights to the land above:
decentralised institutional structure.
The person who owns the surface may dig
5.146. The Bill also builds in enough flexibility in therein, and apply all that is there found to
its design to take care of differences across States his own purposes at his free will and plea-
through a modular structure, from which modules sure; and that if, in the exercise of such right,
based on the state-specific situation, requirements, he intercepts or drains off the water collected
priorities of water sector governance, and other fac- from underground springs in his neighbour’s
tors could be selected by the state government while well, this inconvenience to his neighbour falls
preparing and enacting their final draft of the Bill. within the description of damnumabsquein-
juria [damage without injury], which cannot
NEW GROUNDWATER LAW29 become the ground of an action.30
5.147. Since sustainable and equitable management
of groundwater based on aquifer management is • Defined vs Undefined channels: ‘Groundwater
going to occupy centre-stage, this requires a new that percolates through underground strata,
legal framework to support efforts in this direction. which has no certain course, no defined limits,
but which oozes through the soil in every direc-
Limitations of the Present Legal Framework tion in which the rain penetrates is not subject to
for Groundwater the same rules as flowing water in streams or riv-
5.148. As early as the 1970s, the GoI put forward a ers.’29 On the other hand, where groundwater was
model bill to regulate groundwater use for adoption found to flow in defined channels, case law says
by the States. This model bill has been revised several that rules applicable to surface water would also
times (1992, 1996 and 2005) but the basic scheme apply. This has been interpreted30 to mean that the
adopted in the 1970s has been retained to date. The right of the landowner would then be limited to
Model Bill to Regulate and Control the Development use and consumption for household and drinking
and Management of Ground Water, 2005 only intro- purpose, for watering their cattle and even for irri-
duces a limited regulatory framework to address gating their land or for purposes of manufacture
groundwater depletion and pollution and amounts provided that
to little more than ‘grandfathering’ existing uses.
− the use is reasonable;
5.149. Rules concerning access to and use of ground- − it is required for their purposes as owners of
water in India have been progressively developed the land and
through judicial decisions. What is remarkable is − it does not destroy or render useless or mate-
that some of the most important legal principles rially diminish or affect the application of the
governing groundwater even today were laid down water by riparian owners below the stream in
in British common law as early as the middle of the the exercise either of their natural right or right
nineteenth century and have not been updated since. of easement, if any.
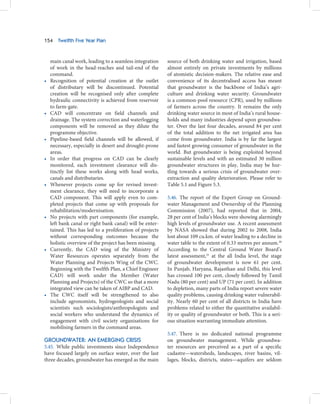
These legal principles are:
5.150. A lot of legal hermeneutics was devoted
• Landowners given full control of groundwater: over the years to clearly spelling out the distinction
Existing rules of access to and control over between defined and undefined channels of ground-
groundwater are still based on the common law water.31 The difficulty, of course, is that this differ-
doctrine of absolute dominion. This gives the entiation is completely meaningless in scientific](https://image.slidesharecdn.com/vol1-130312055349-phpapp02/85/The-12th-Five-year-Plan-Volume-1-182-320.jpg)


The document provides an overview of India's Twelfth Five Year Plan (2012-2017). The Plan aims to achieve faster, more inclusive and sustainable economic growth after growth slowed in the previous years. It focuses on immediately reviving investment to return to 9% growth, while also developing capabilities and managing resources rationally for long-term growth potential. Key areas of intervention include capacity building, governance reforms, developing human and institutional resources, managing national resources sustainably, and engaging with the global economy.


