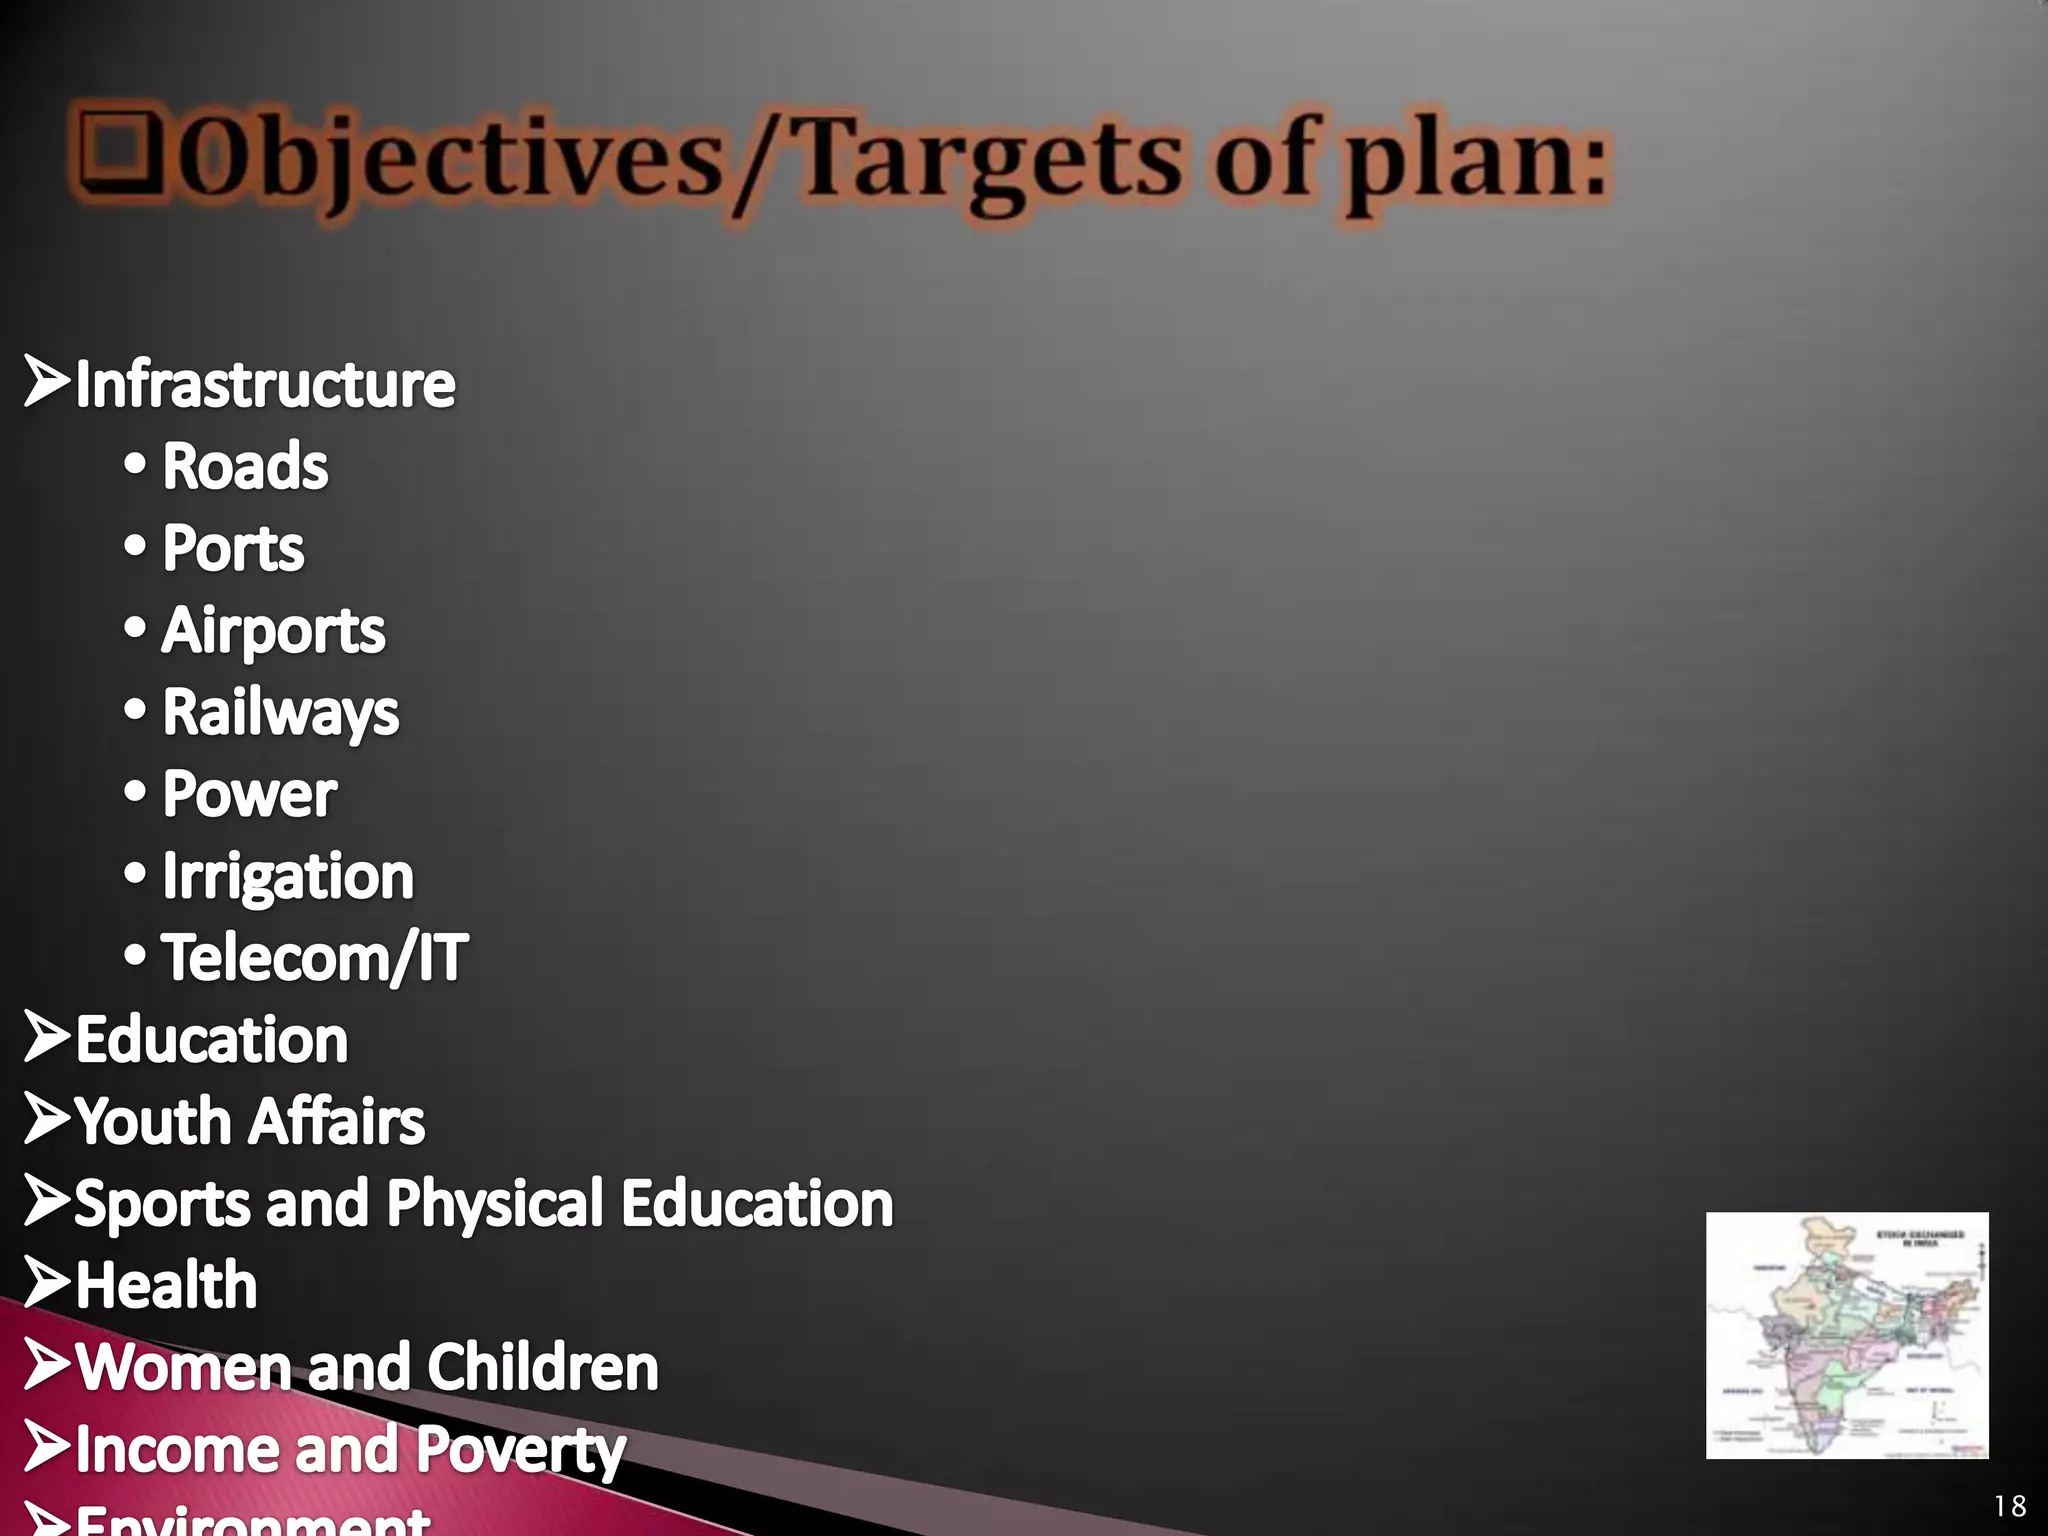
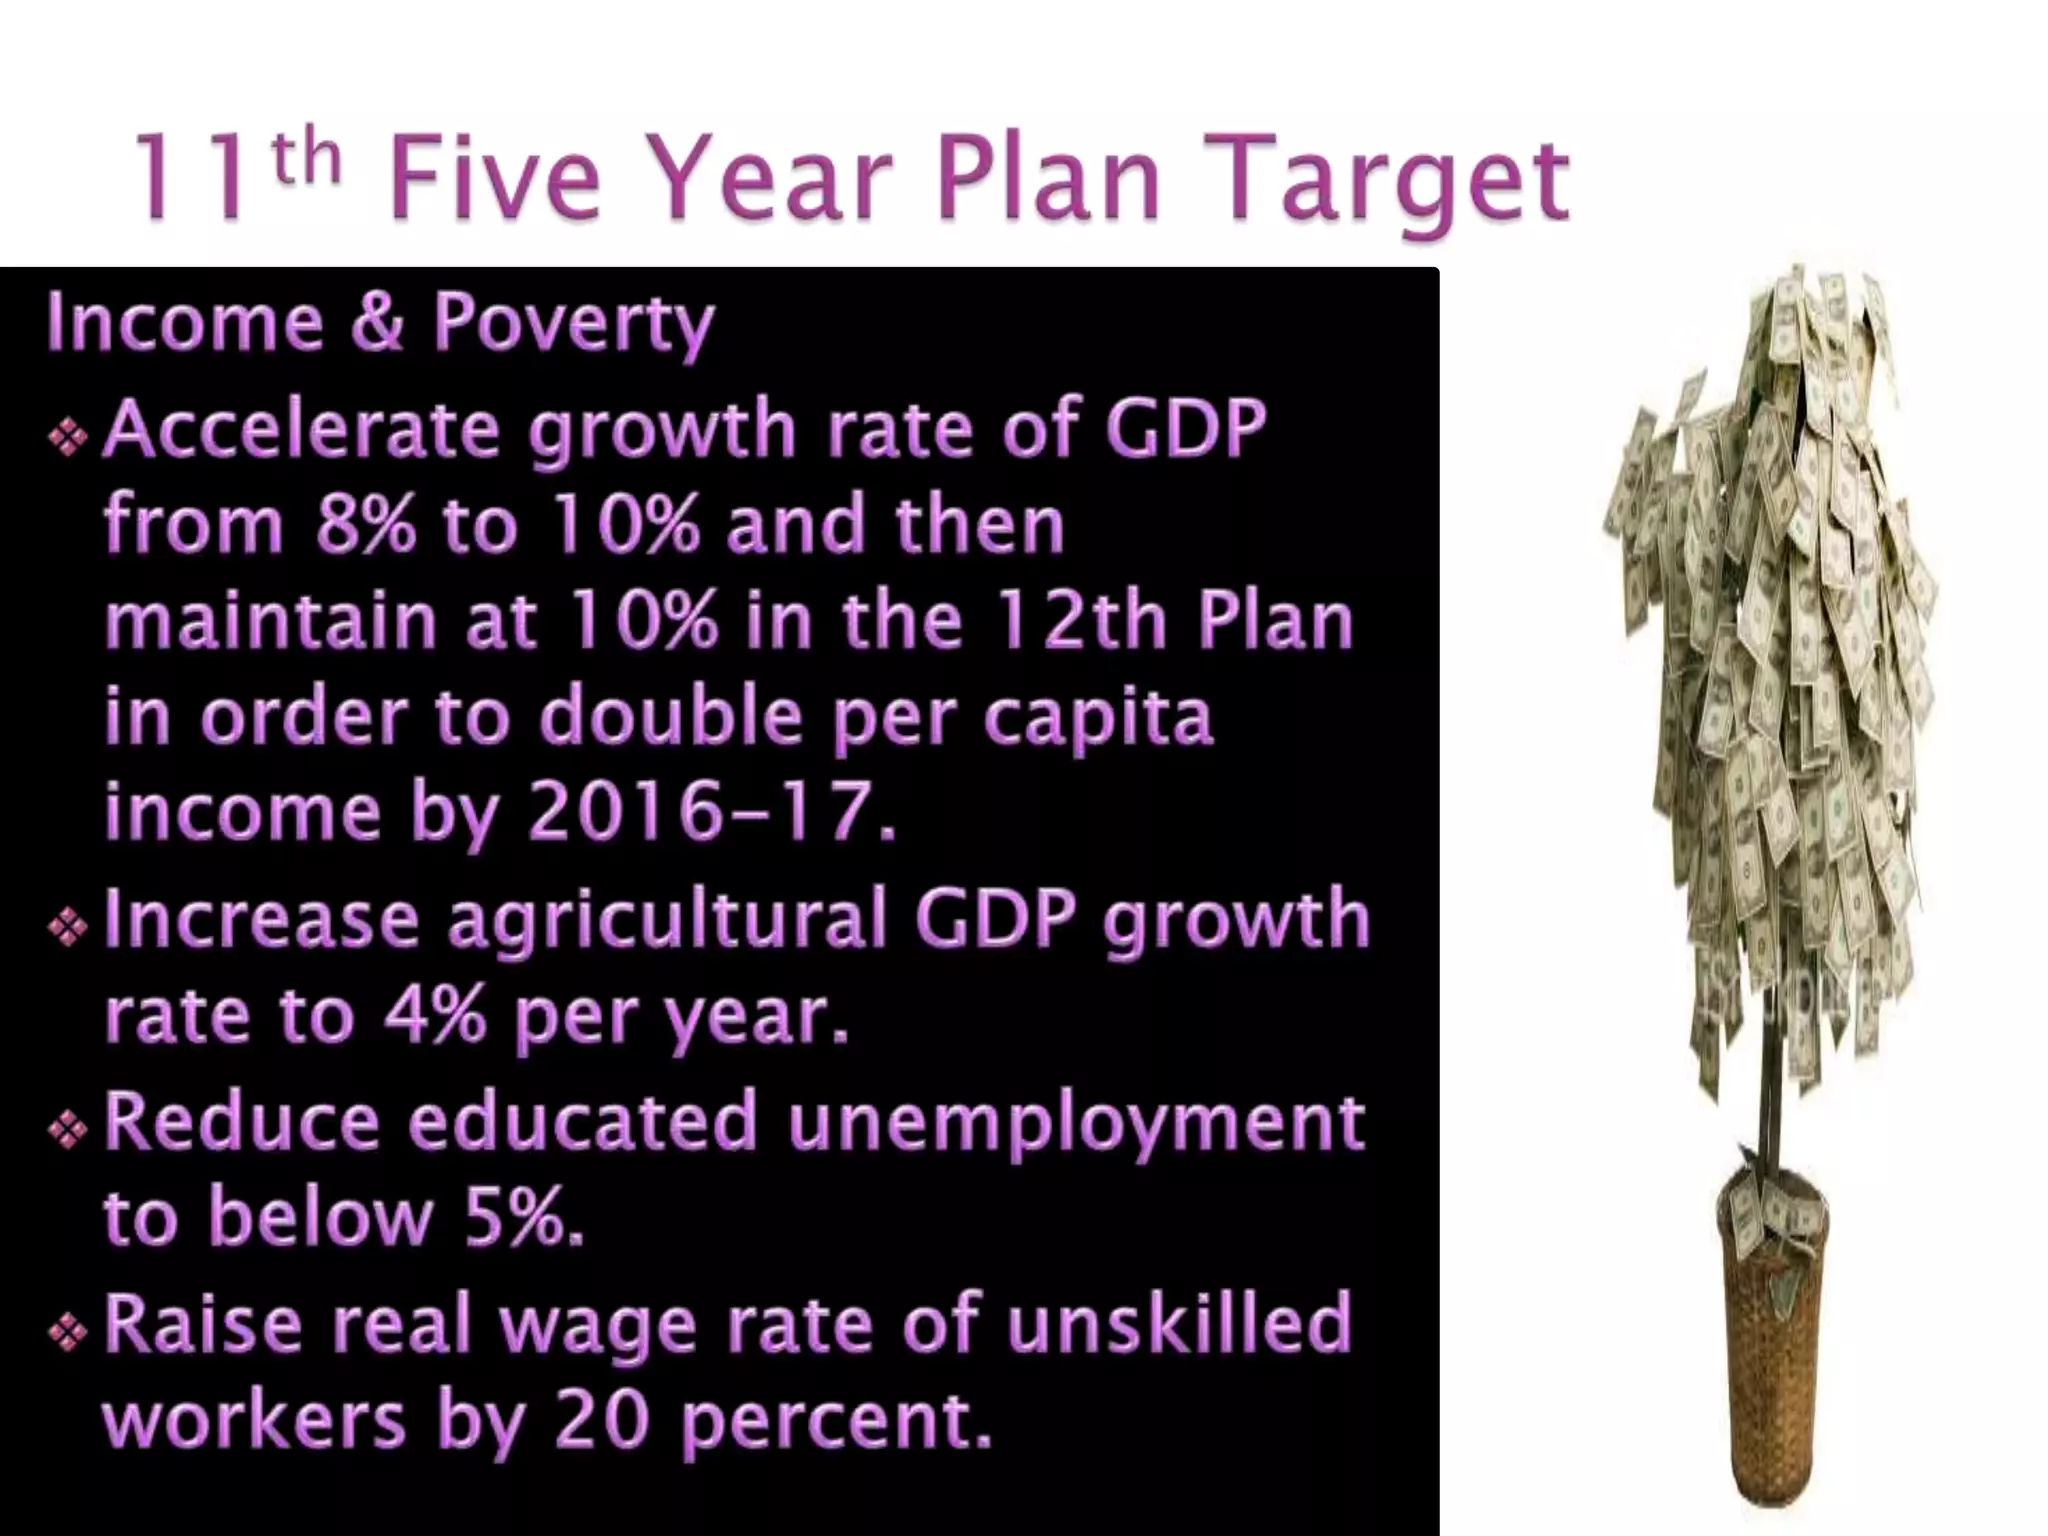
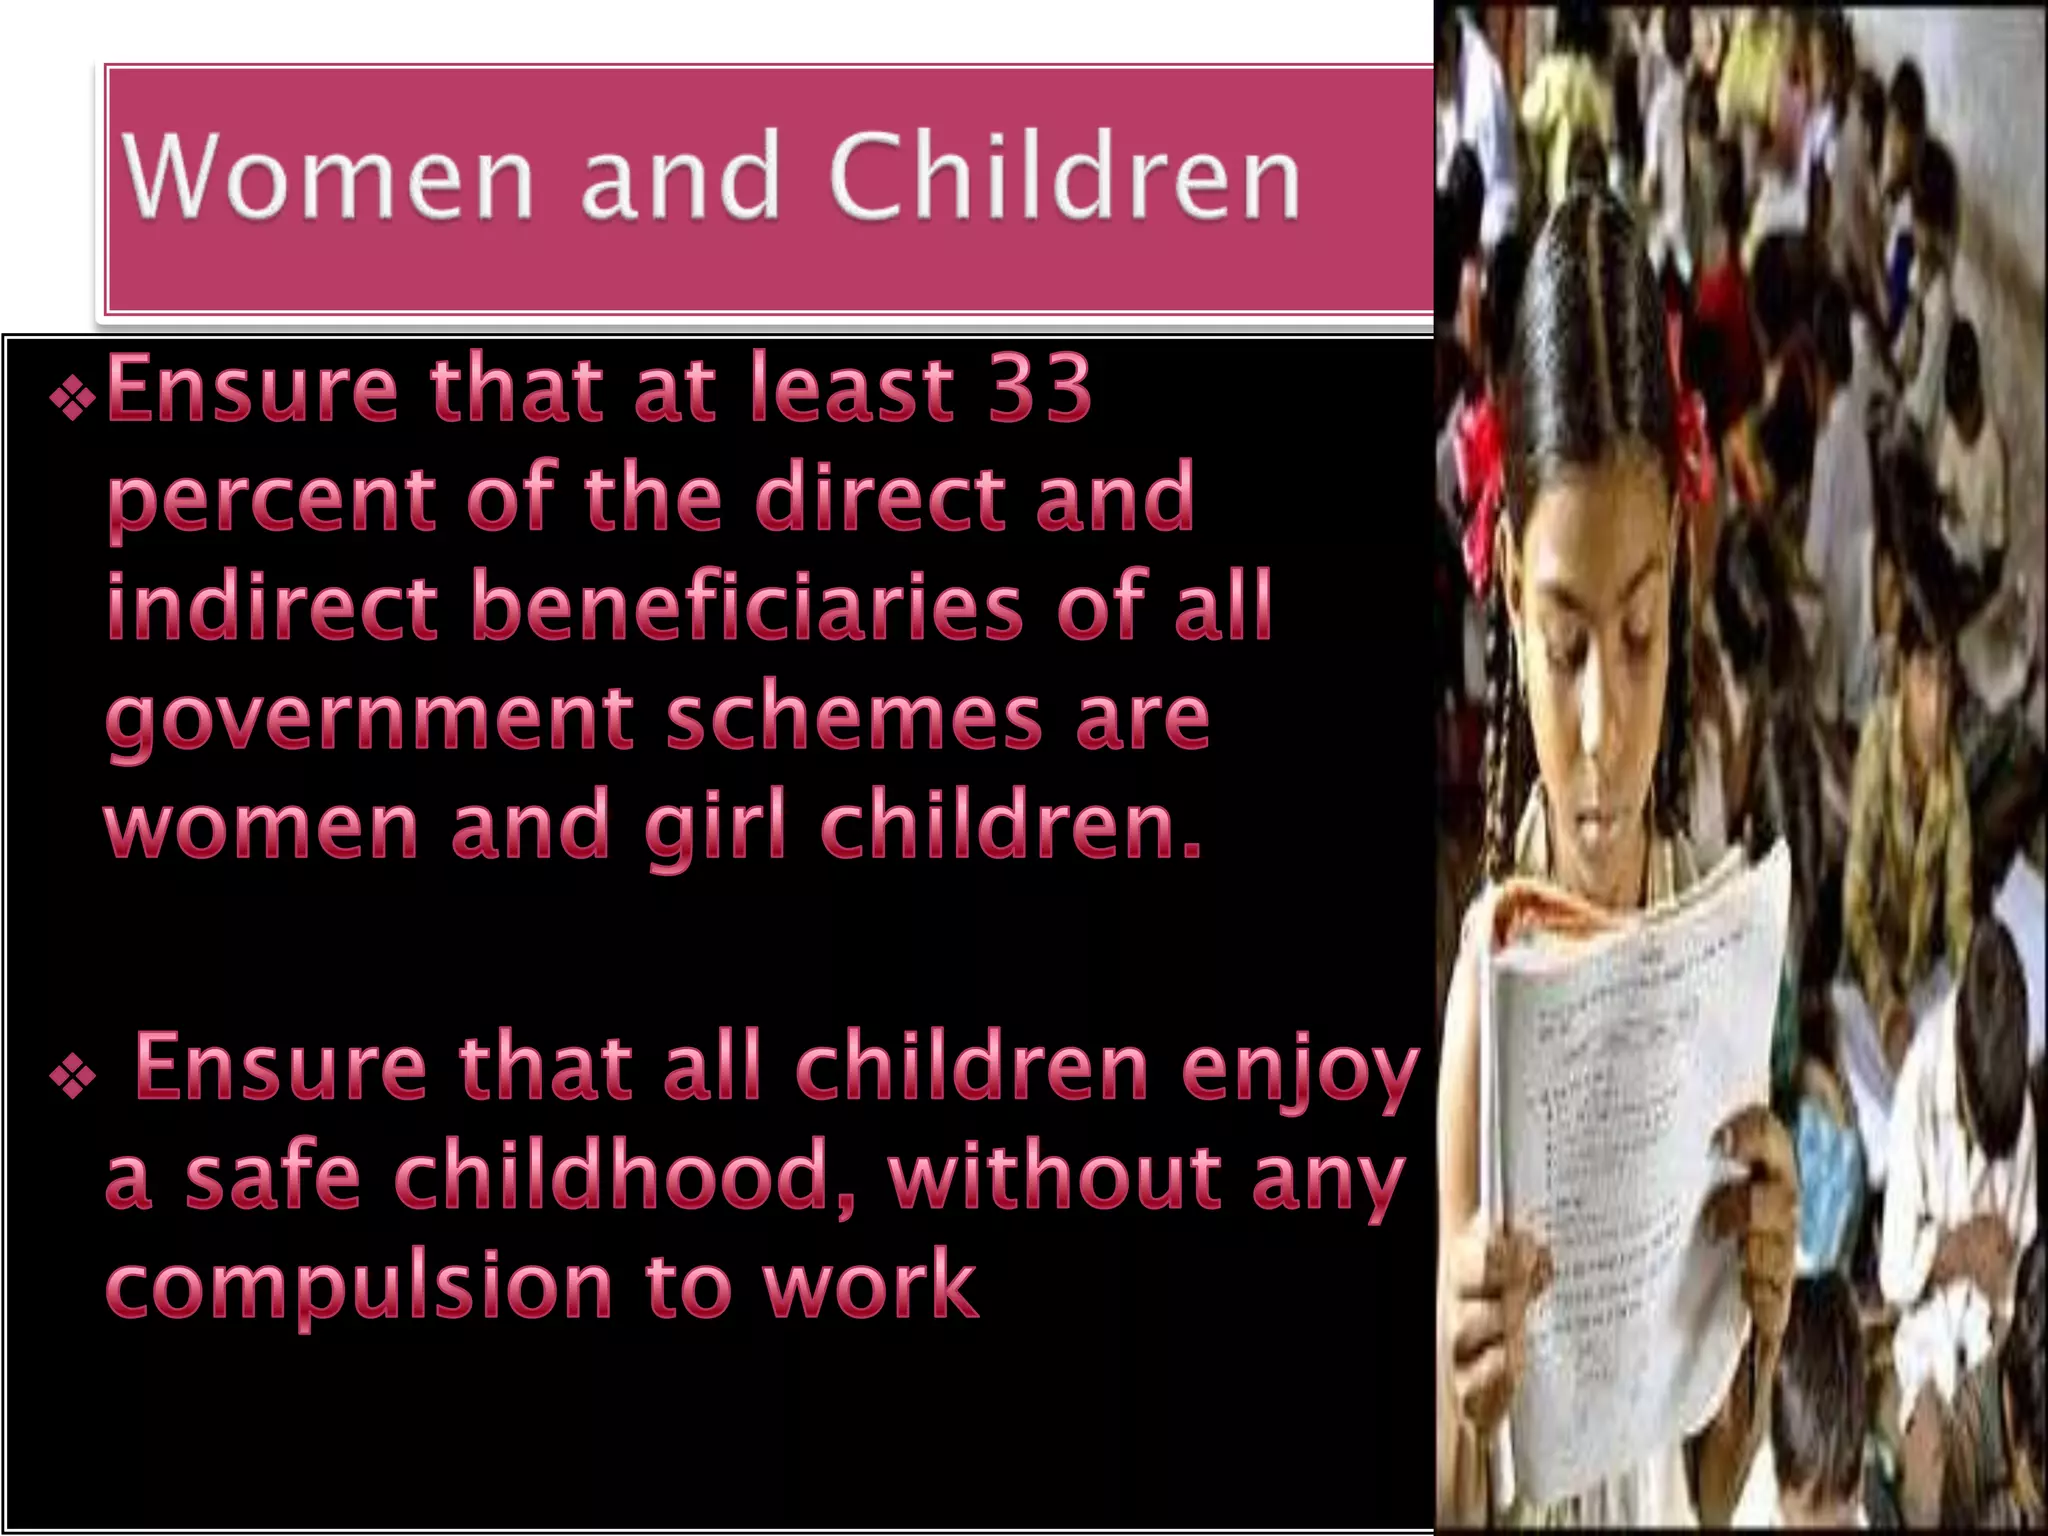
ECONOMIC
PLANNING IN INDIA
WHAT IS PLAN ?



                 .
PLANNING COMMISSION


After independence, India was in dire conditions and
needed to start acting soon
Some of the problems necessitated need for an
immediate plan:
Vicious circle of poverty

Foreign Trade
Need for Rapid industrialization

Population pressure

Development of Natural resources
Capital Deficiency & Market imperfections


                                             6
FIRST FIVE YEAR PLAN
      (1951-1956)
          • Presented by –
        JAWAHARLAL NEHRU
       •Total outlay - Rs. 2069
                Crores
     • Target growth – 2.1%growth
       in gross domestic product.

Introduction:
 The National Development Council has approved the 11th Five Year Plan for the
 period from 2007 to 2012. The plan document is entitled “Towards Faster and More
 Inclusive Growth”. The Indian economy on the eve of 11th Plan is much stronger than
 it was on the eve of 10th Plan. 10th Plan has achieved the highest growth rate of GDP
 at 7.8 percent. The 11th plan enters with a saving rate at 34.8 percent of GDP and the
 investment rate at 35.9 percent of GDP. The priority areas for this plan are agriculture,
 irrigation and water resources, education, health, infrastructure, employment,
 upliftment of SCs/STs, other backward classes, minorities, women and children.
           The Central vision of the 11th plan is to build on our strengths to trigger a
 development process which ensures broad-based improvement in the quality of life
 of the people, especially the poor, SCs/STs, OBCs, minorities and women. The
 National Development Council has endorsed a target of 9% GDP growth for 11th Plan.
 Government has visualized not only the faster but inclusive growth also. Inclusive
 growth means a growth process which yields broad-based benefits and ensures
 equality of opportunity for all.

                                                                                             17
18
Sectoral Growth                 Targets of                 Financing        of Eleventh Five Year
 11th Plan:                                                  Plan:
                                              Financing Pattern of Public Sector Outlay during 11th Plan
                                                                                 (Rs.` Crore at 2006-07 prices)

   Area          Growth                  Resources             Central     States and UTs              Total
                                                             Government
                 Rate per
                 Annum             1. Balance from            6,39,989         3,85,050             10,39,039
                                   Current Revenue
                  (in %)
                                   2. Borrowings              7,67,722         6,49,423             14,17,145
Gross               9.0
Domestic
                                   3. Net Inflow from             -                -                     -
Product                            abroad
(GDP)                              4. Resources of PSEs       10,59,711        1,28,824             11,88,535
Agriculture          4.1
Industry            10.5           5. Aggregate               24,81,422       11,63,296             36,44,718
                                   Resources (1 to 4)
Services             9.9           6. Assistance to States    -3,24,851        3,24,851                  -
                                   and UTs
Exports             16.4
                                    TOTAL RESOURCES           21,56,571       14,88,147             36,44,718
Imports             12.5
                                                                          (Source: Economic Survey, 2007-08, p.a-50)
  (Source: Planning Commission)
Eleventh Plan Outlay and Its Allocation (at 2006-07 Prices)
Items                        Proposed Outlay (Rs.`       Percentage of Total outlay
                             Crore)
1. Agriculture and Allied    1,36,381                    3.7
Activities
2.Rural Development          3,01,069                    8.3
3. Special Area Programme 26,329                         0.7
for Backward Regions
4. Irrigation and Flood   2,10,326                       5.8
Control
5. Energy                 8,54,123                       23.4
6. Industry and Minerals     1,53,600                    4.2
7.Transport                  5,72,443                    15.7
8. Communication             95,380                      2.6
9. Science, Technology and   87,933                      2.4
Environment
10. General Economic         62,523                      1.7
Services
11. Social Services          11,02,237                   30.3
12. General Services         42,284                      1.2
TOTAL                        36,44,718                   100
                                              (Source: Economic Survey, 2007-08, p.a-47)
Main Areas of 11th Plan:
Main areas of 11th plan are as follows:
1. Agriculture
2. Infrastructure
    Highways
    Airports
    Railways
    Power Generation
3. Rural Infrastructure: Specific Targets of
   Bharat Nirman Programme for the Period
   (2005-2009)
    Irrigation
    Rural Roads
    Rural Housing
    Rural Water
    Rural Electrification
    Rural Telephone
4. Industry
5. Employment
6. Education
7. Health
8. Social Sector
                                               21
 Ensure   electricity connection to all villages and
    BPL households by 2009 and round-the-clock
    power by the end of the Plan.

   Ensure all-weather road connection to all
    habitation with population 1000 and above (500 in
    hilly and tribal areas) by 2009, and ensure coverage
    of all significant habitation by 2015.

 Connect     every village by telephone by November
    2007 and provide broadband connectivity to all
    villages by 2012.
Planning in india
Planning in india
Planning in india

Planning in india

  • 1.
  • 3.
    WHAT IS PLAN?  .
  • 5.
  • 6.
    After independence, Indiawas in dire conditions and needed to start acting soon Some of the problems necessitated need for an immediate plan: Vicious circle of poverty Foreign Trade Need for Rapid industrialization Population pressure Development of Natural resources Capital Deficiency & Market imperfections 6
  • 12.
    FIRST FIVE YEARPLAN (1951-1956) • Presented by – JAWAHARLAL NEHRU •Total outlay - Rs. 2069 Crores • Target growth – 2.1%growth in gross domestic product.
  • 16.
  • 17.
    Introduction: The NationalDevelopment Council has approved the 11th Five Year Plan for the period from 2007 to 2012. The plan document is entitled “Towards Faster and More Inclusive Growth”. The Indian economy on the eve of 11th Plan is much stronger than it was on the eve of 10th Plan. 10th Plan has achieved the highest growth rate of GDP at 7.8 percent. The 11th plan enters with a saving rate at 34.8 percent of GDP and the investment rate at 35.9 percent of GDP. The priority areas for this plan are agriculture, irrigation and water resources, education, health, infrastructure, employment, upliftment of SCs/STs, other backward classes, minorities, women and children. The Central vision of the 11th plan is to build on our strengths to trigger a development process which ensures broad-based improvement in the quality of life of the people, especially the poor, SCs/STs, OBCs, minorities and women. The National Development Council has endorsed a target of 9% GDP growth for 11th Plan. Government has visualized not only the faster but inclusive growth also. Inclusive growth means a growth process which yields broad-based benefits and ensures equality of opportunity for all. 17
  • 18.
  • 19.
    Sectoral Growth Targets of Financing of Eleventh Five Year 11th Plan: Plan: Financing Pattern of Public Sector Outlay during 11th Plan (Rs.` Crore at 2006-07 prices) Area Growth Resources Central States and UTs Total Government Rate per Annum 1. Balance from 6,39,989 3,85,050 10,39,039 Current Revenue (in %) 2. Borrowings 7,67,722 6,49,423 14,17,145 Gross 9.0 Domestic 3. Net Inflow from - - - Product abroad (GDP) 4. Resources of PSEs 10,59,711 1,28,824 11,88,535 Agriculture 4.1 Industry 10.5 5. Aggregate 24,81,422 11,63,296 36,44,718 Resources (1 to 4) Services 9.9 6. Assistance to States -3,24,851 3,24,851 - and UTs Exports 16.4 TOTAL RESOURCES 21,56,571 14,88,147 36,44,718 Imports 12.5 (Source: Economic Survey, 2007-08, p.a-50) (Source: Planning Commission)
  • 20.
    Eleventh Plan Outlayand Its Allocation (at 2006-07 Prices) Items Proposed Outlay (Rs.` Percentage of Total outlay Crore) 1. Agriculture and Allied 1,36,381 3.7 Activities 2.Rural Development 3,01,069 8.3 3. Special Area Programme 26,329 0.7 for Backward Regions 4. Irrigation and Flood 2,10,326 5.8 Control 5. Energy 8,54,123 23.4 6. Industry and Minerals 1,53,600 4.2 7.Transport 5,72,443 15.7 8. Communication 95,380 2.6 9. Science, Technology and 87,933 2.4 Environment 10. General Economic 62,523 1.7 Services 11. Social Services 11,02,237 30.3 12. General Services 42,284 1.2 TOTAL 36,44,718 100 (Source: Economic Survey, 2007-08, p.a-47)
  • 21.
    Main Areas of11th Plan: Main areas of 11th plan are as follows: 1. Agriculture 2. Infrastructure Highways Airports Railways Power Generation 3. Rural Infrastructure: Specific Targets of Bharat Nirman Programme for the Period (2005-2009) Irrigation Rural Roads Rural Housing Rural Water Rural Electrification Rural Telephone 4. Industry 5. Employment 6. Education 7. Health 8. Social Sector 21
  • 26.
     Ensure electricity connection to all villages and BPL households by 2009 and round-the-clock power by the end of the Plan.  Ensure all-weather road connection to all habitation with population 1000 and above (500 in hilly and tribal areas) by 2009, and ensure coverage of all significant habitation by 2015.  Connect every village by telephone by November 2007 and provide broadband connectivity to all villages by 2012.