Download to read offline
![Contents
• Non-Renewable Energy Resources [slide 3]
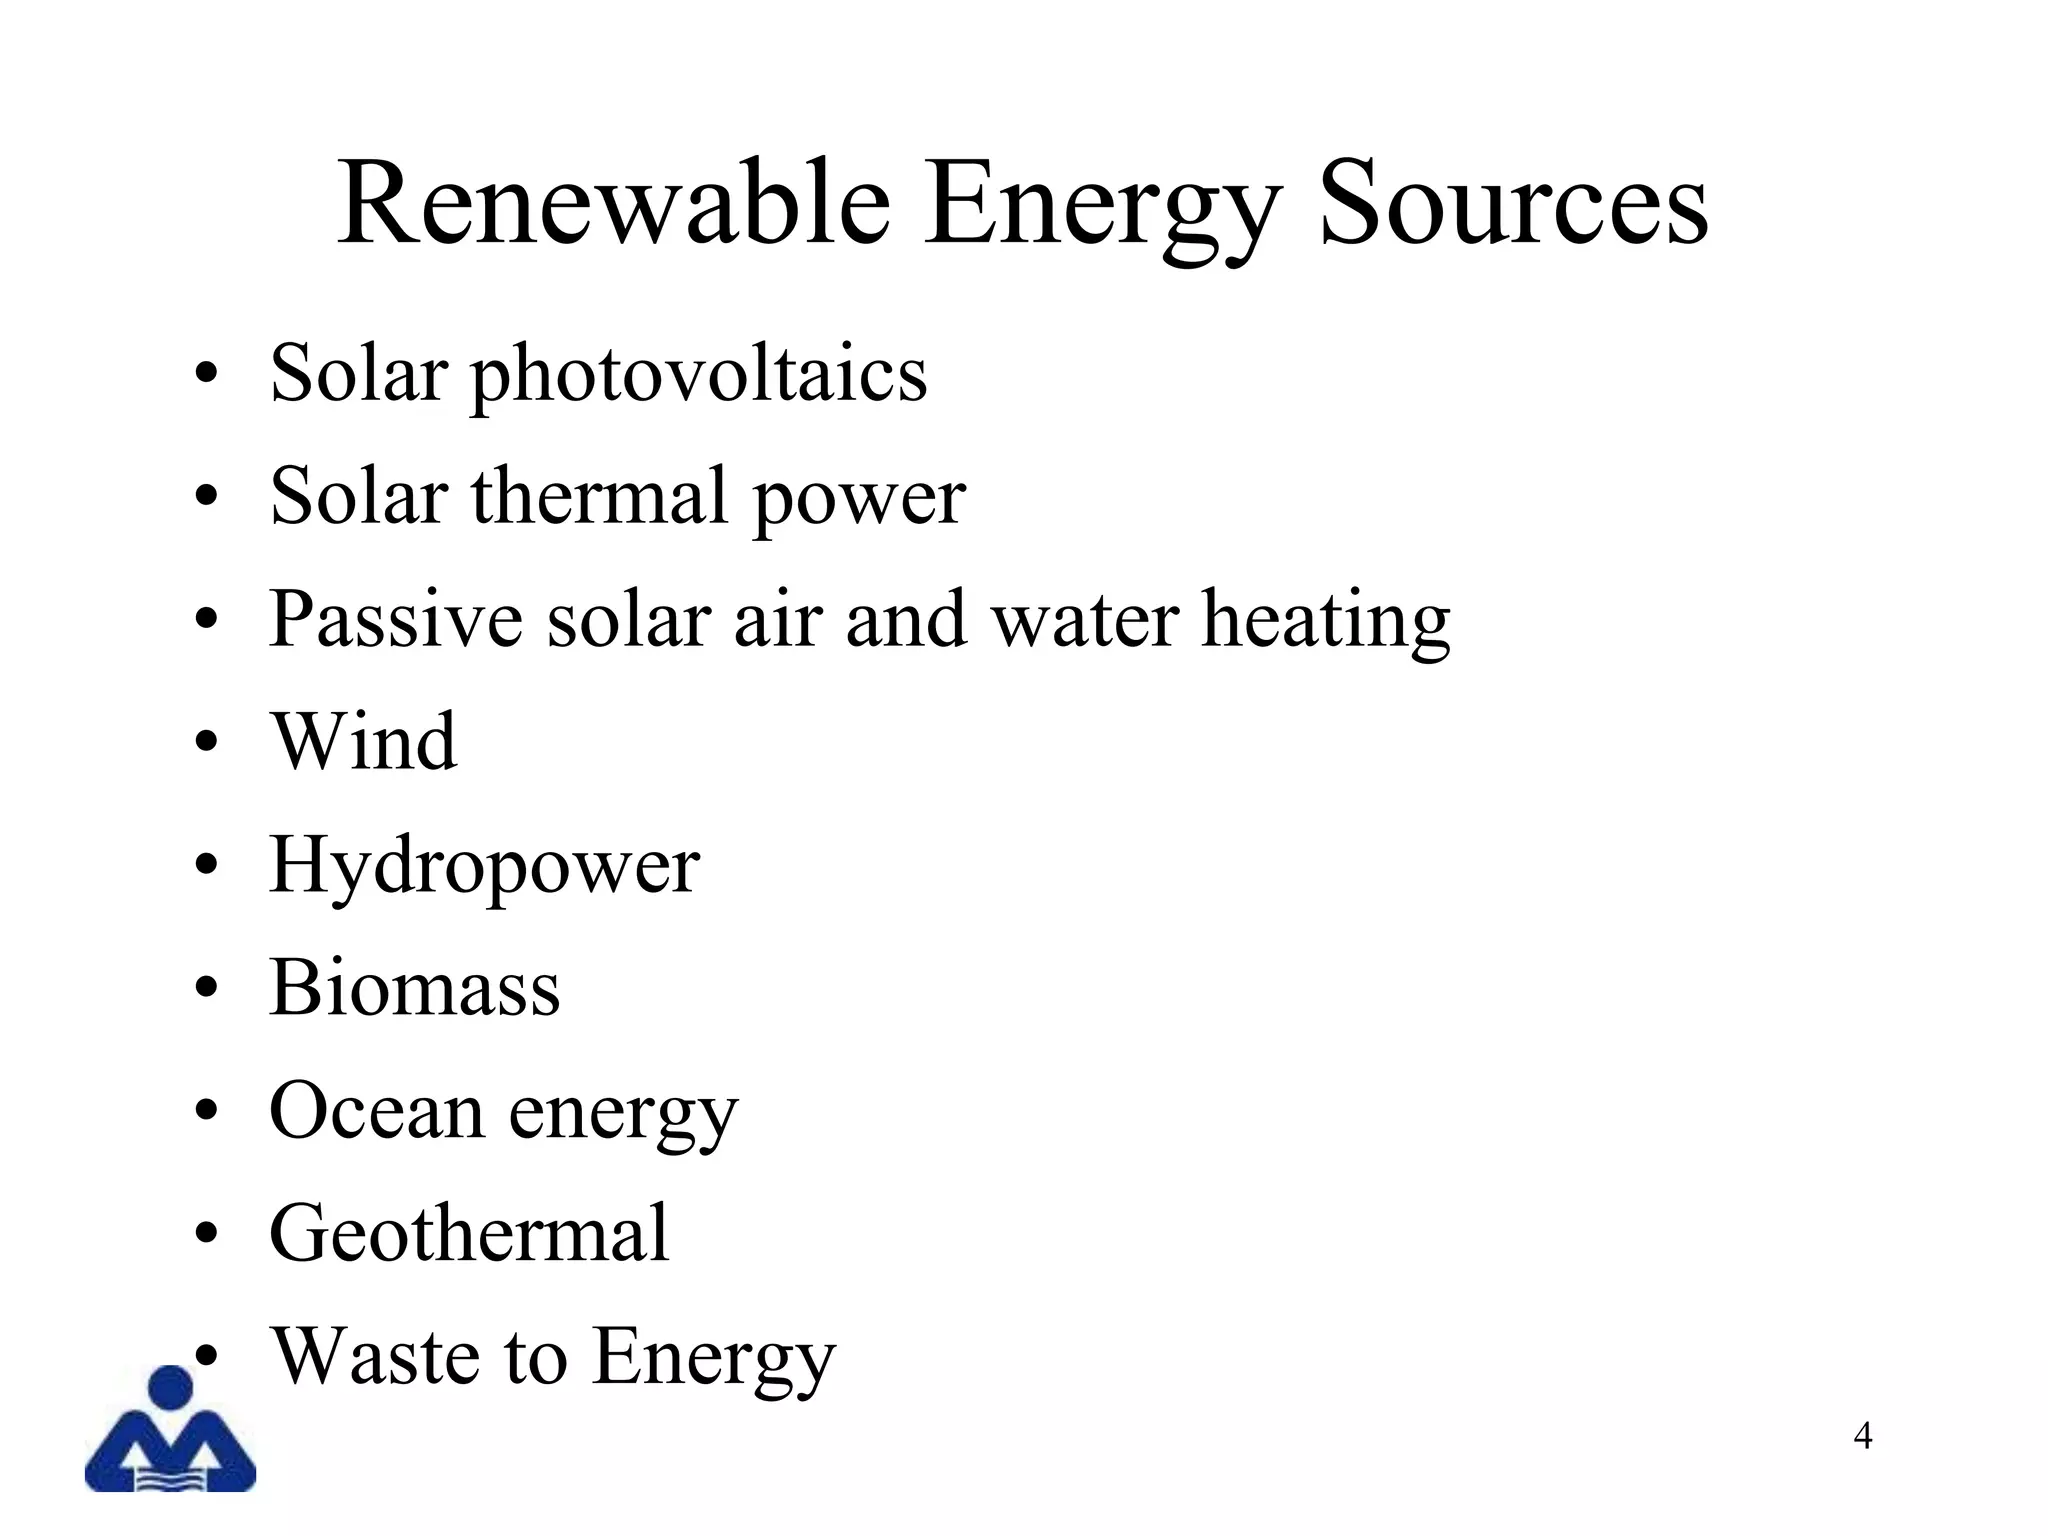
• Renewable Energy Sources [slide 4]
• Peak Production of Petroleum in US [slide 5]
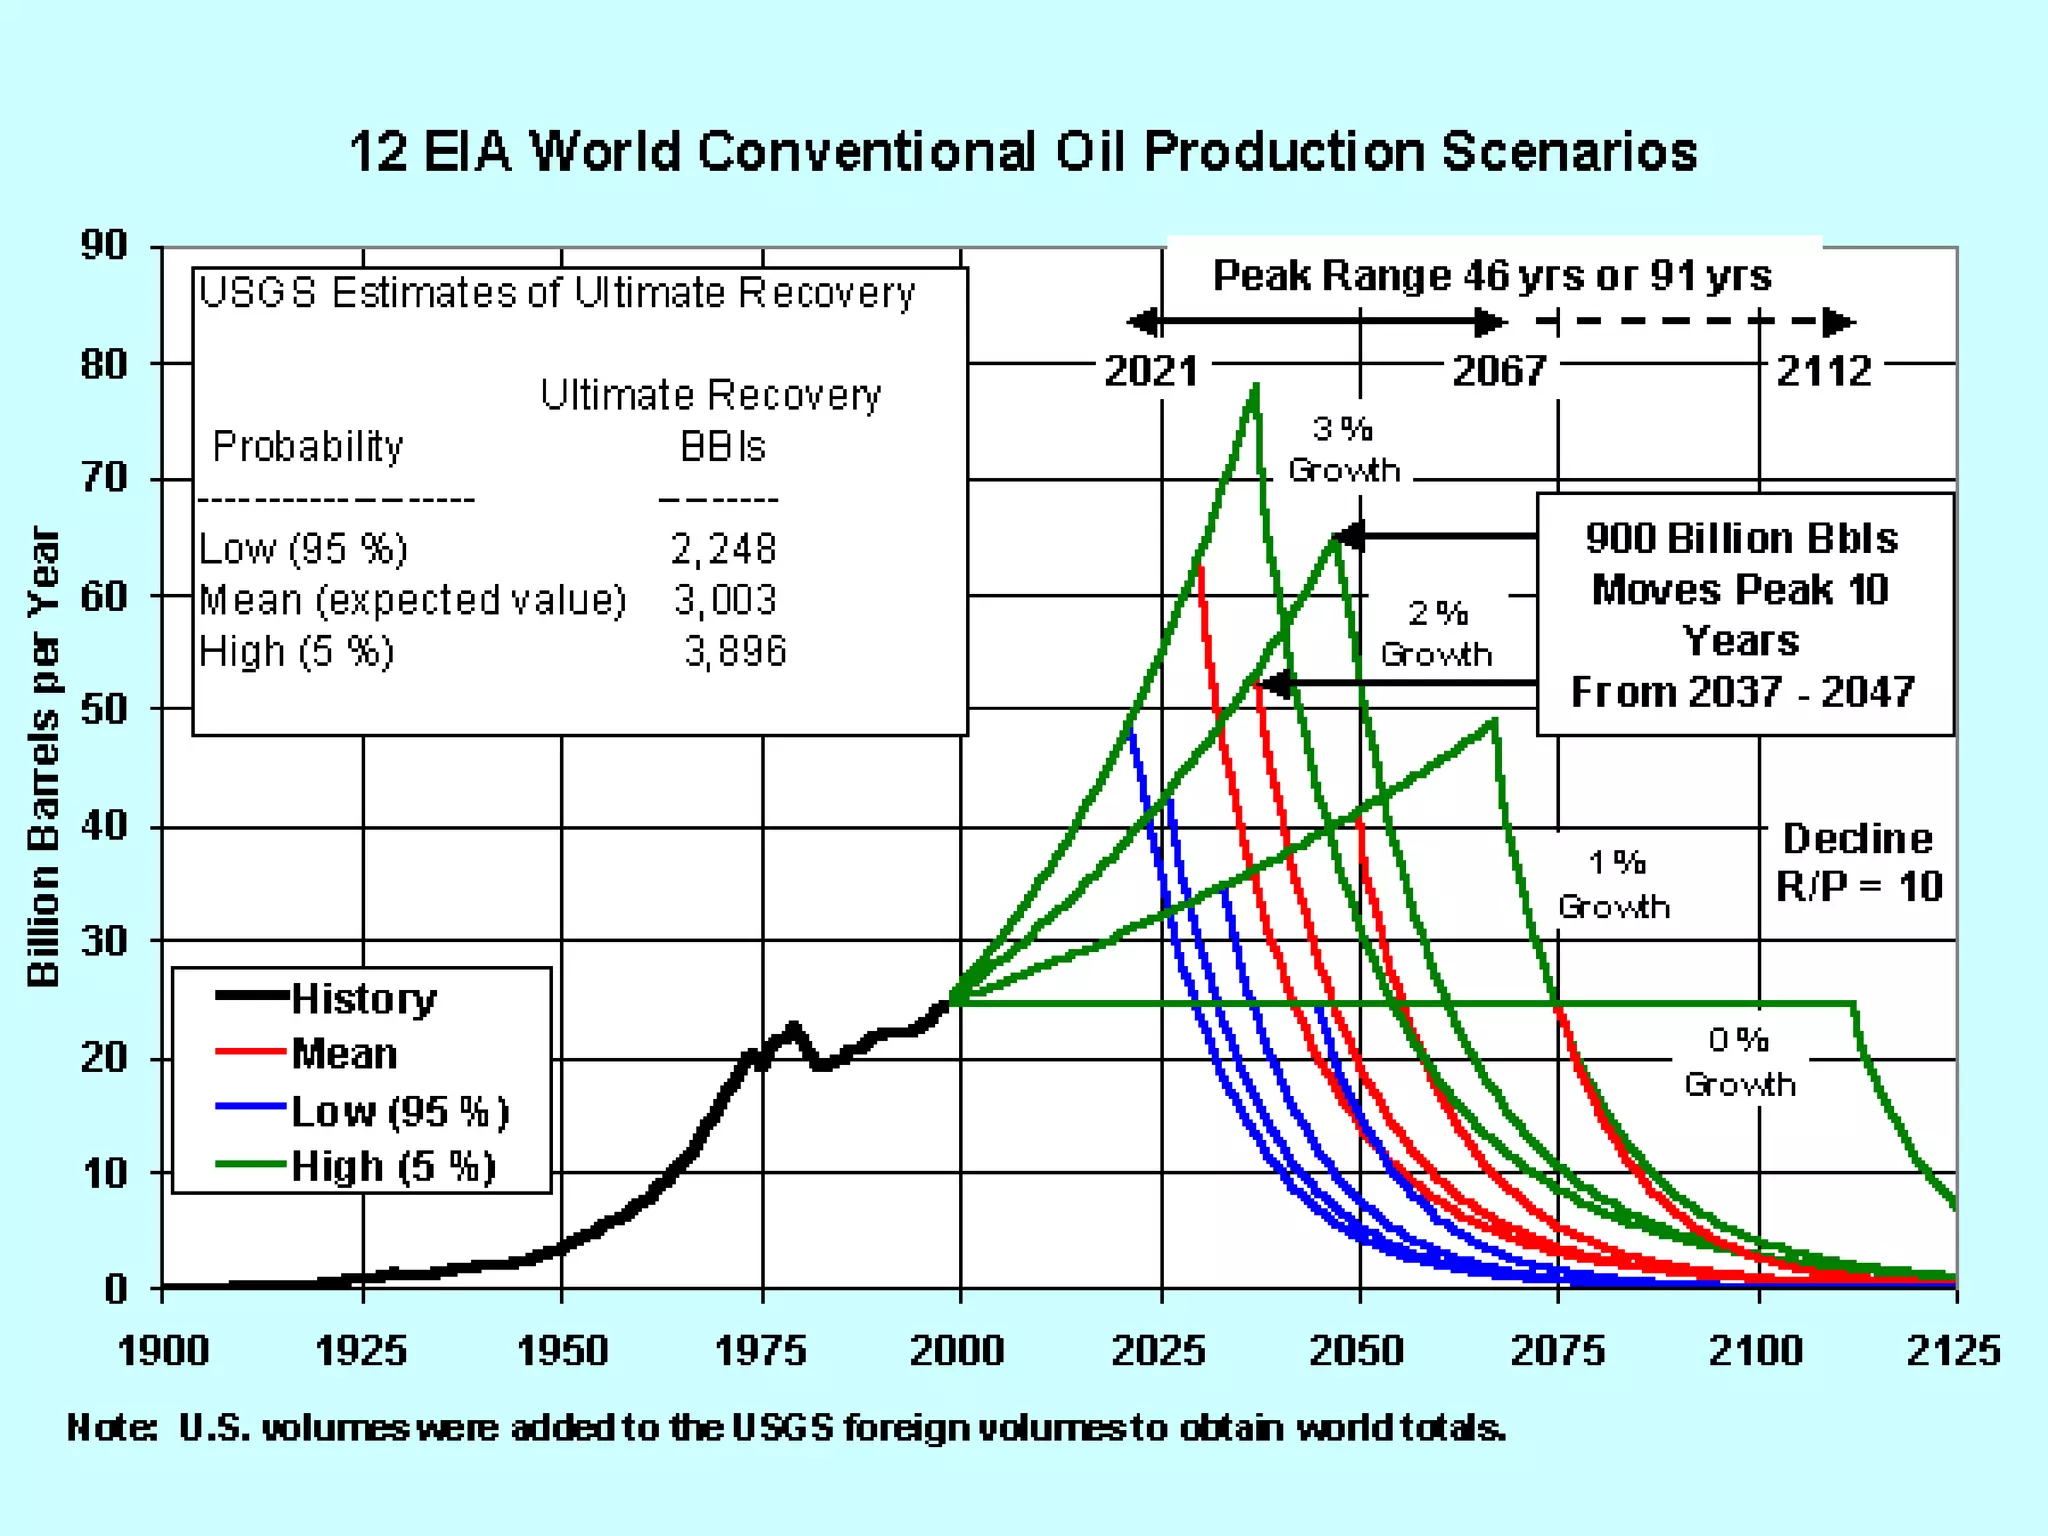
• Projected World Peak Production of Petroleum [slide 6]
• Projected World Peak Production of Petroleum [slide 7]
• Regional Shares of Crude Oil [slide 8]
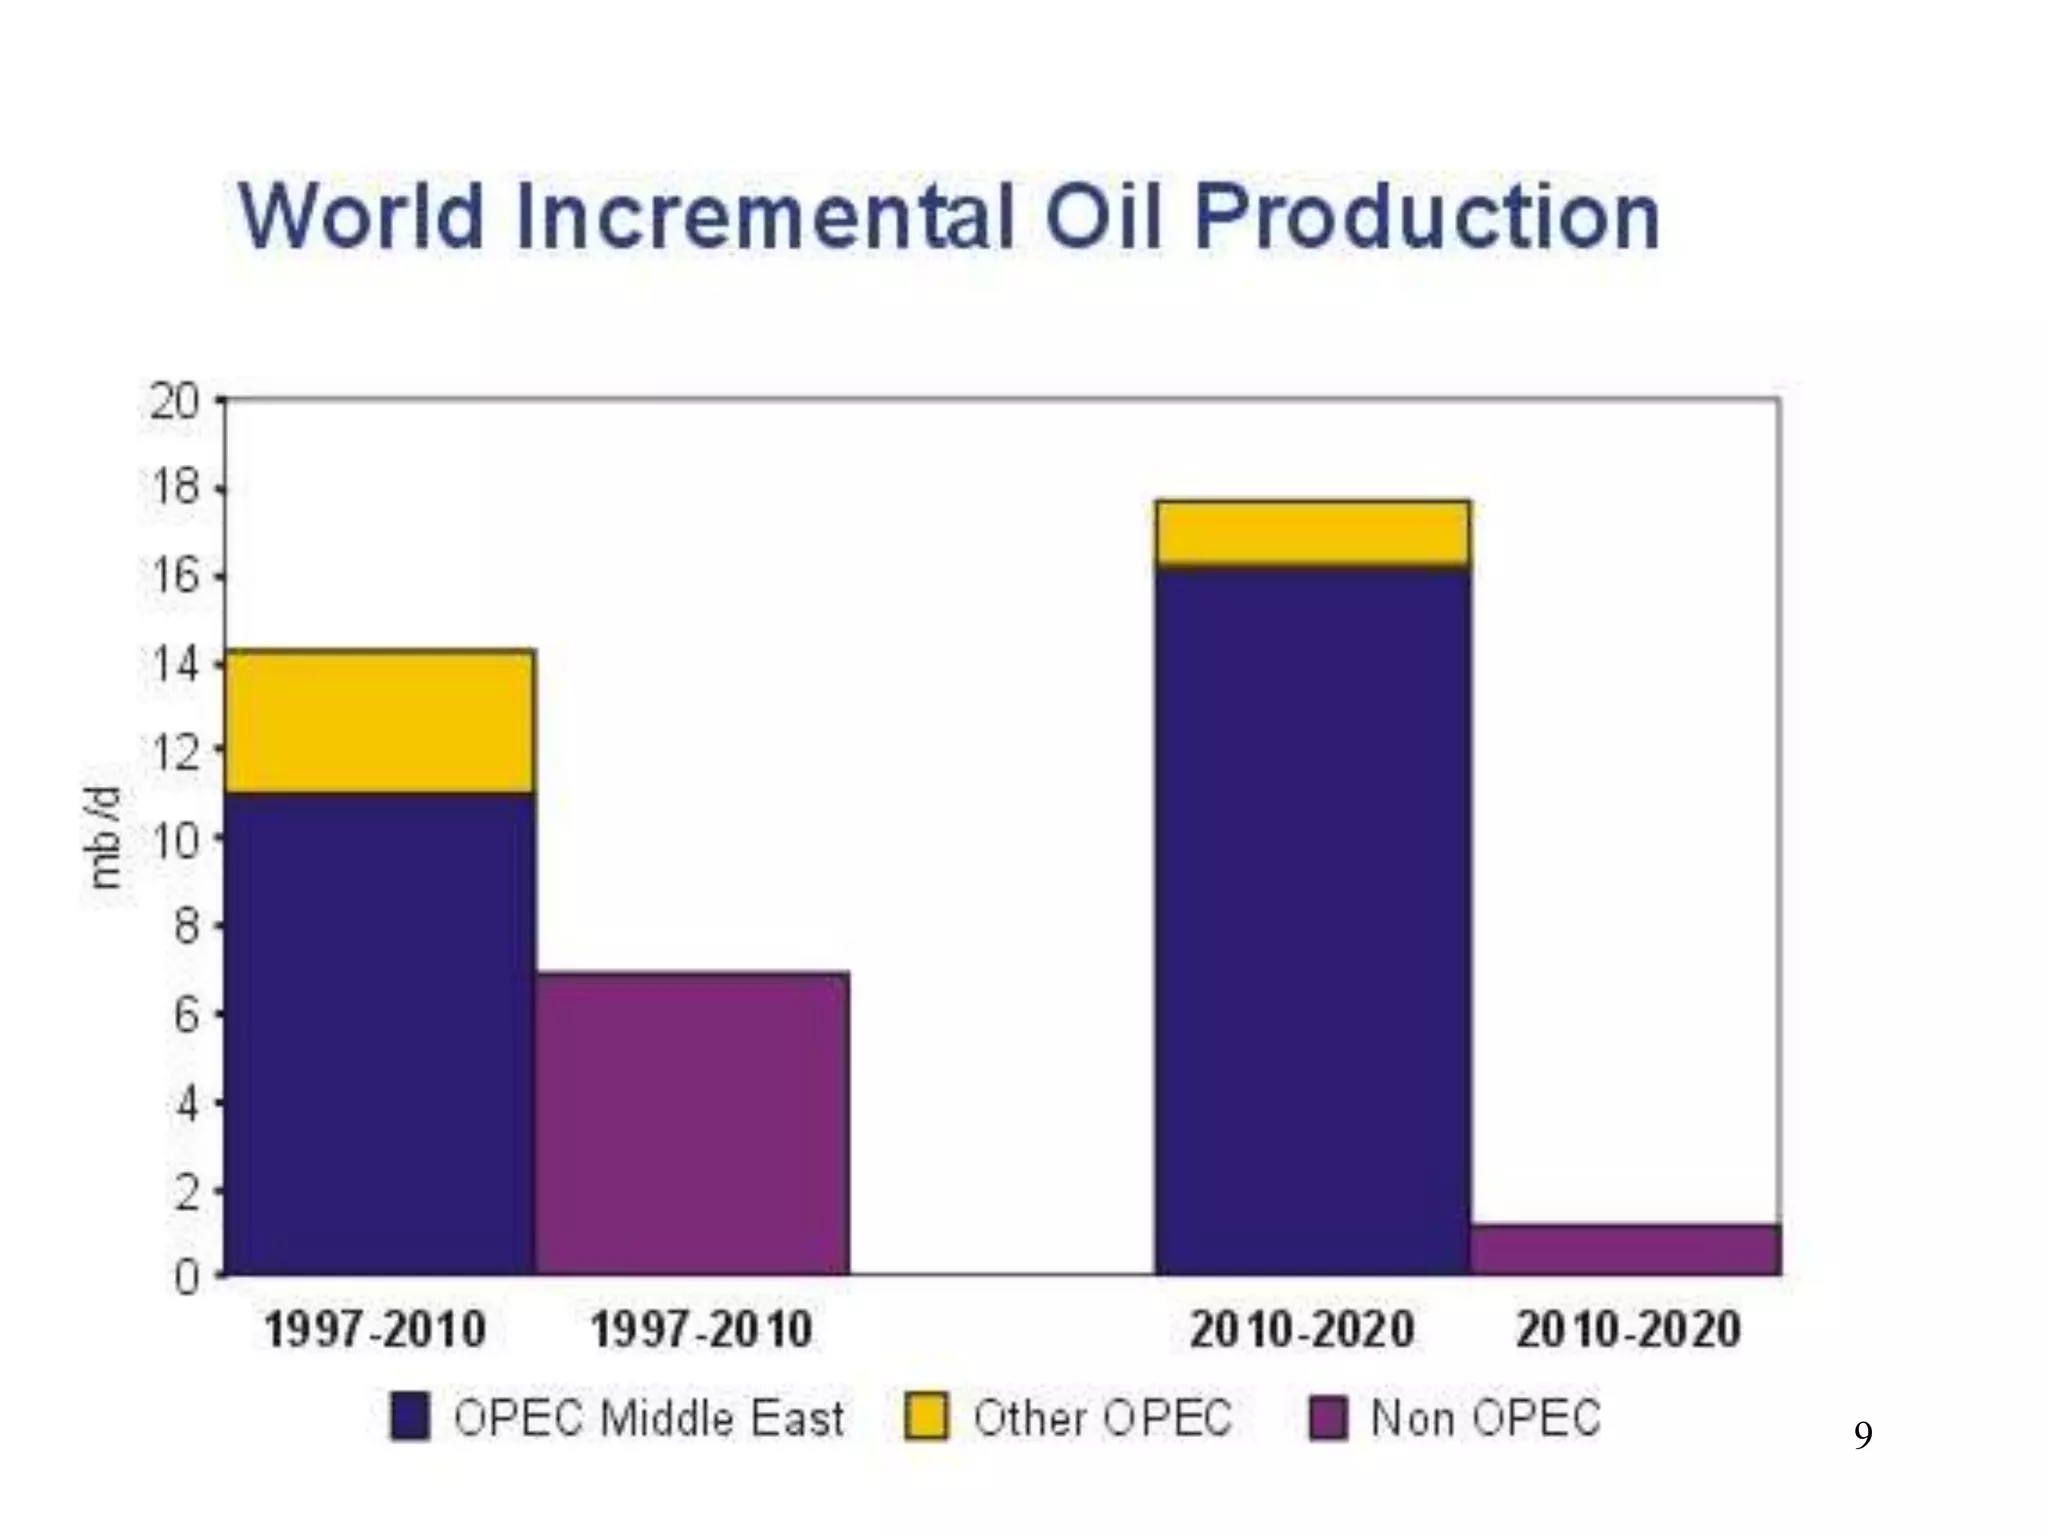
• World Oil Production [slide 9]
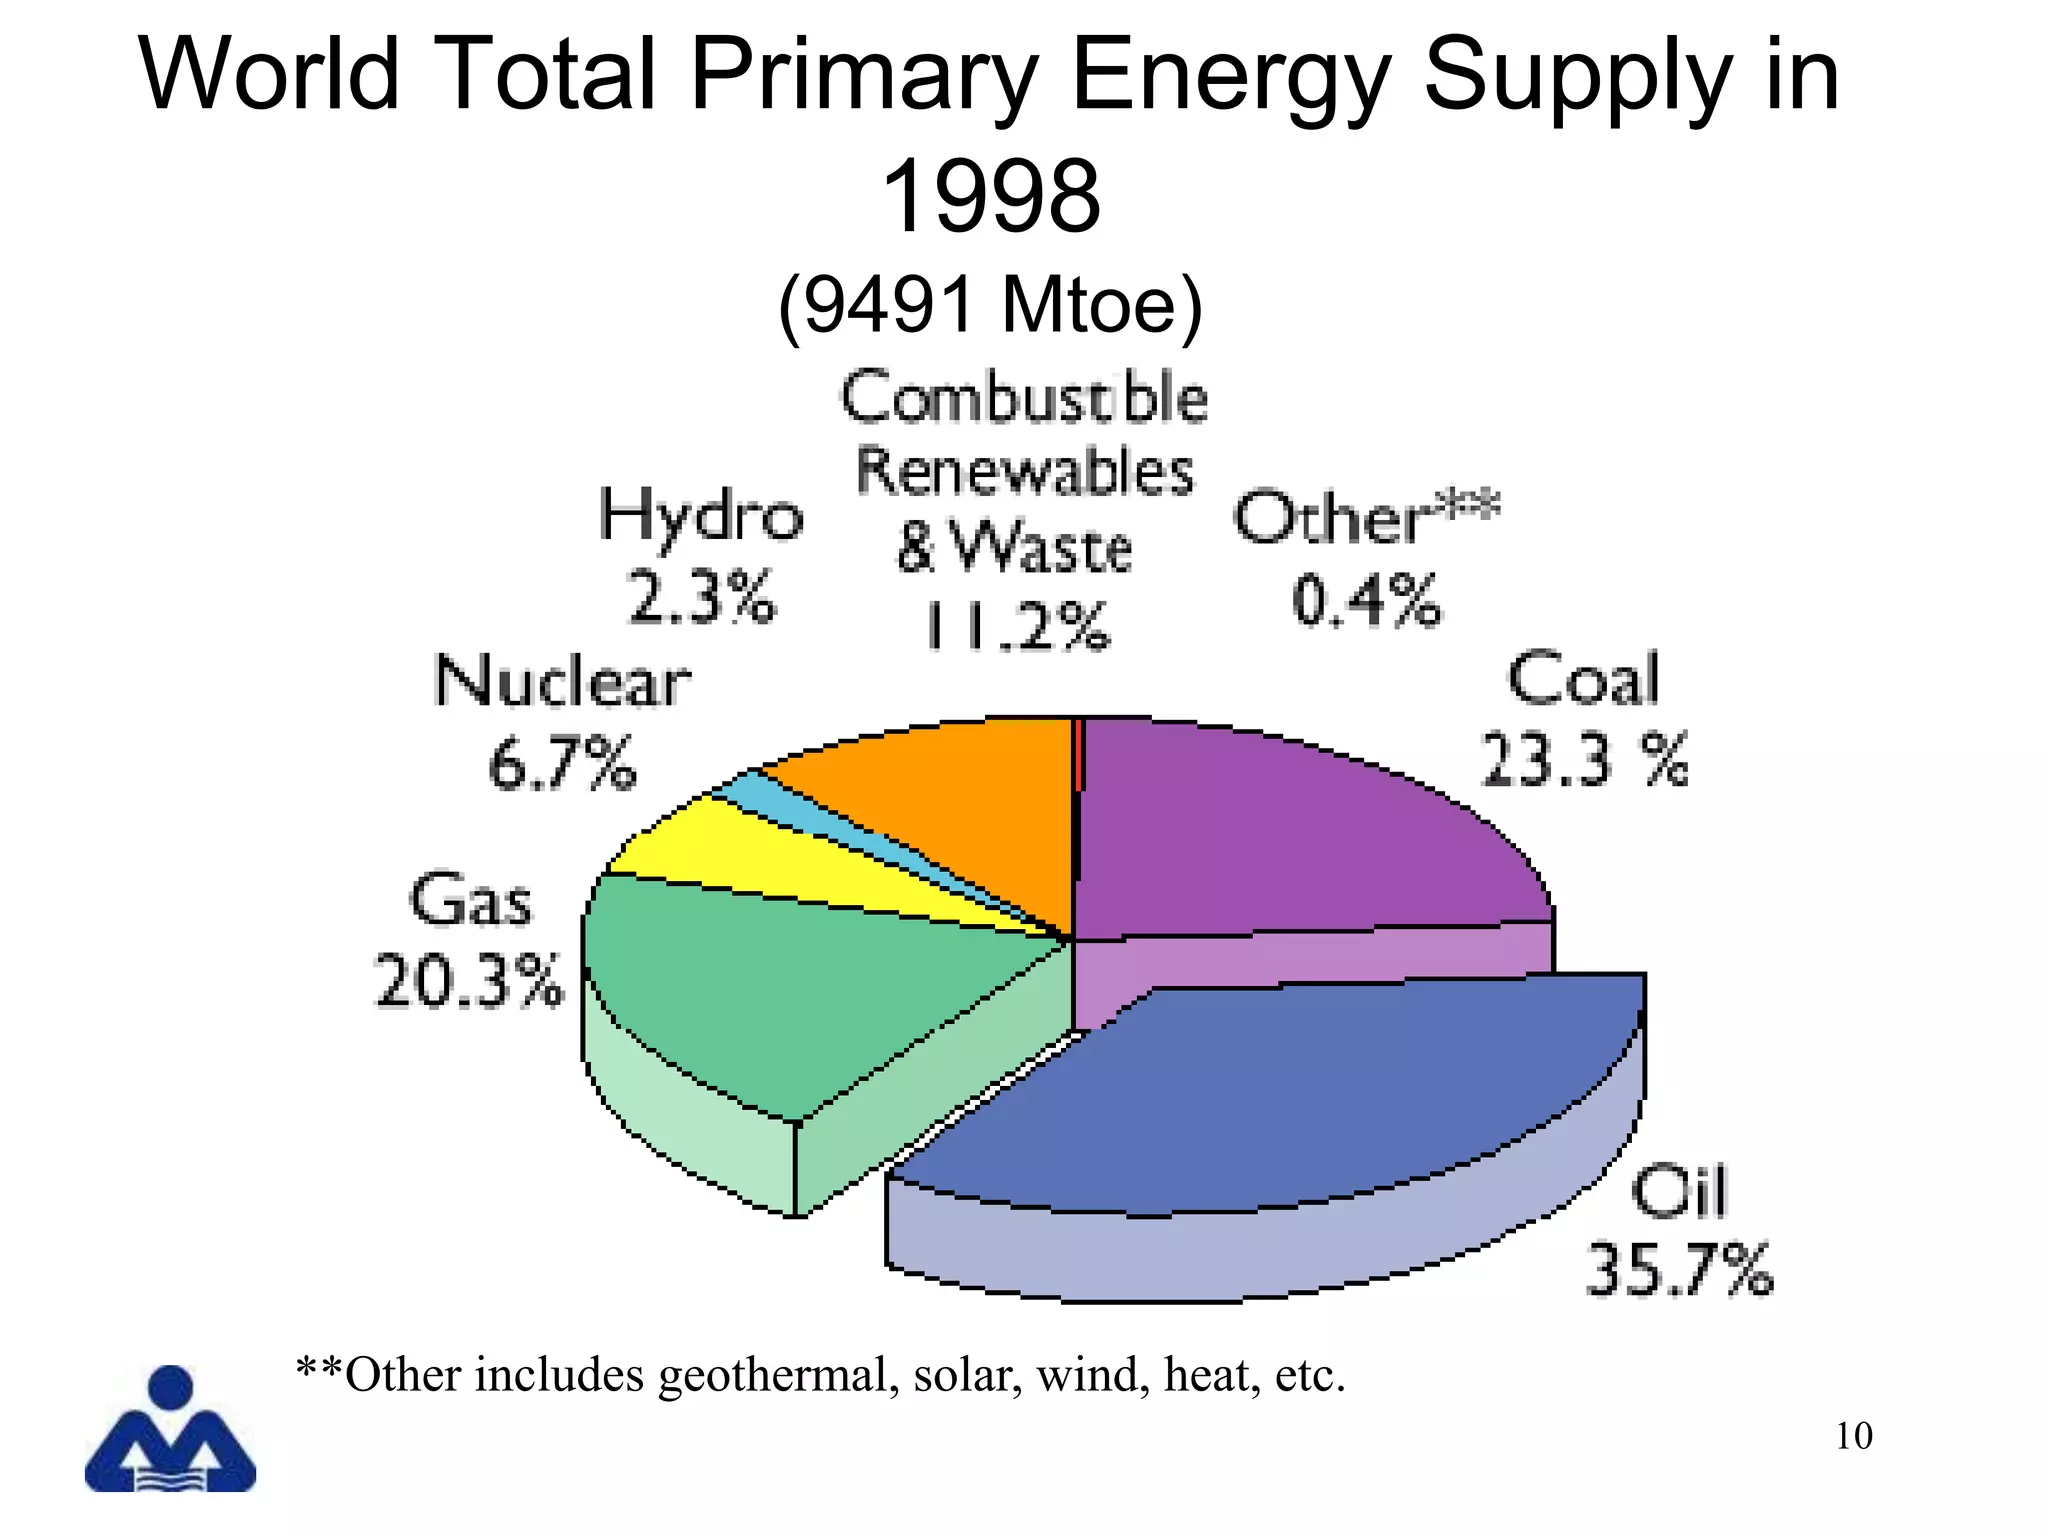
• World Total Primary Energy Supply [slide 10]
• World Total Energy Consumption Projections [slide 11]
• World Total Energy Consumption Projections (by fuel type) [slide 12]
• World Total Energy Consumption 1990 -2020 (by region) [slide 13]
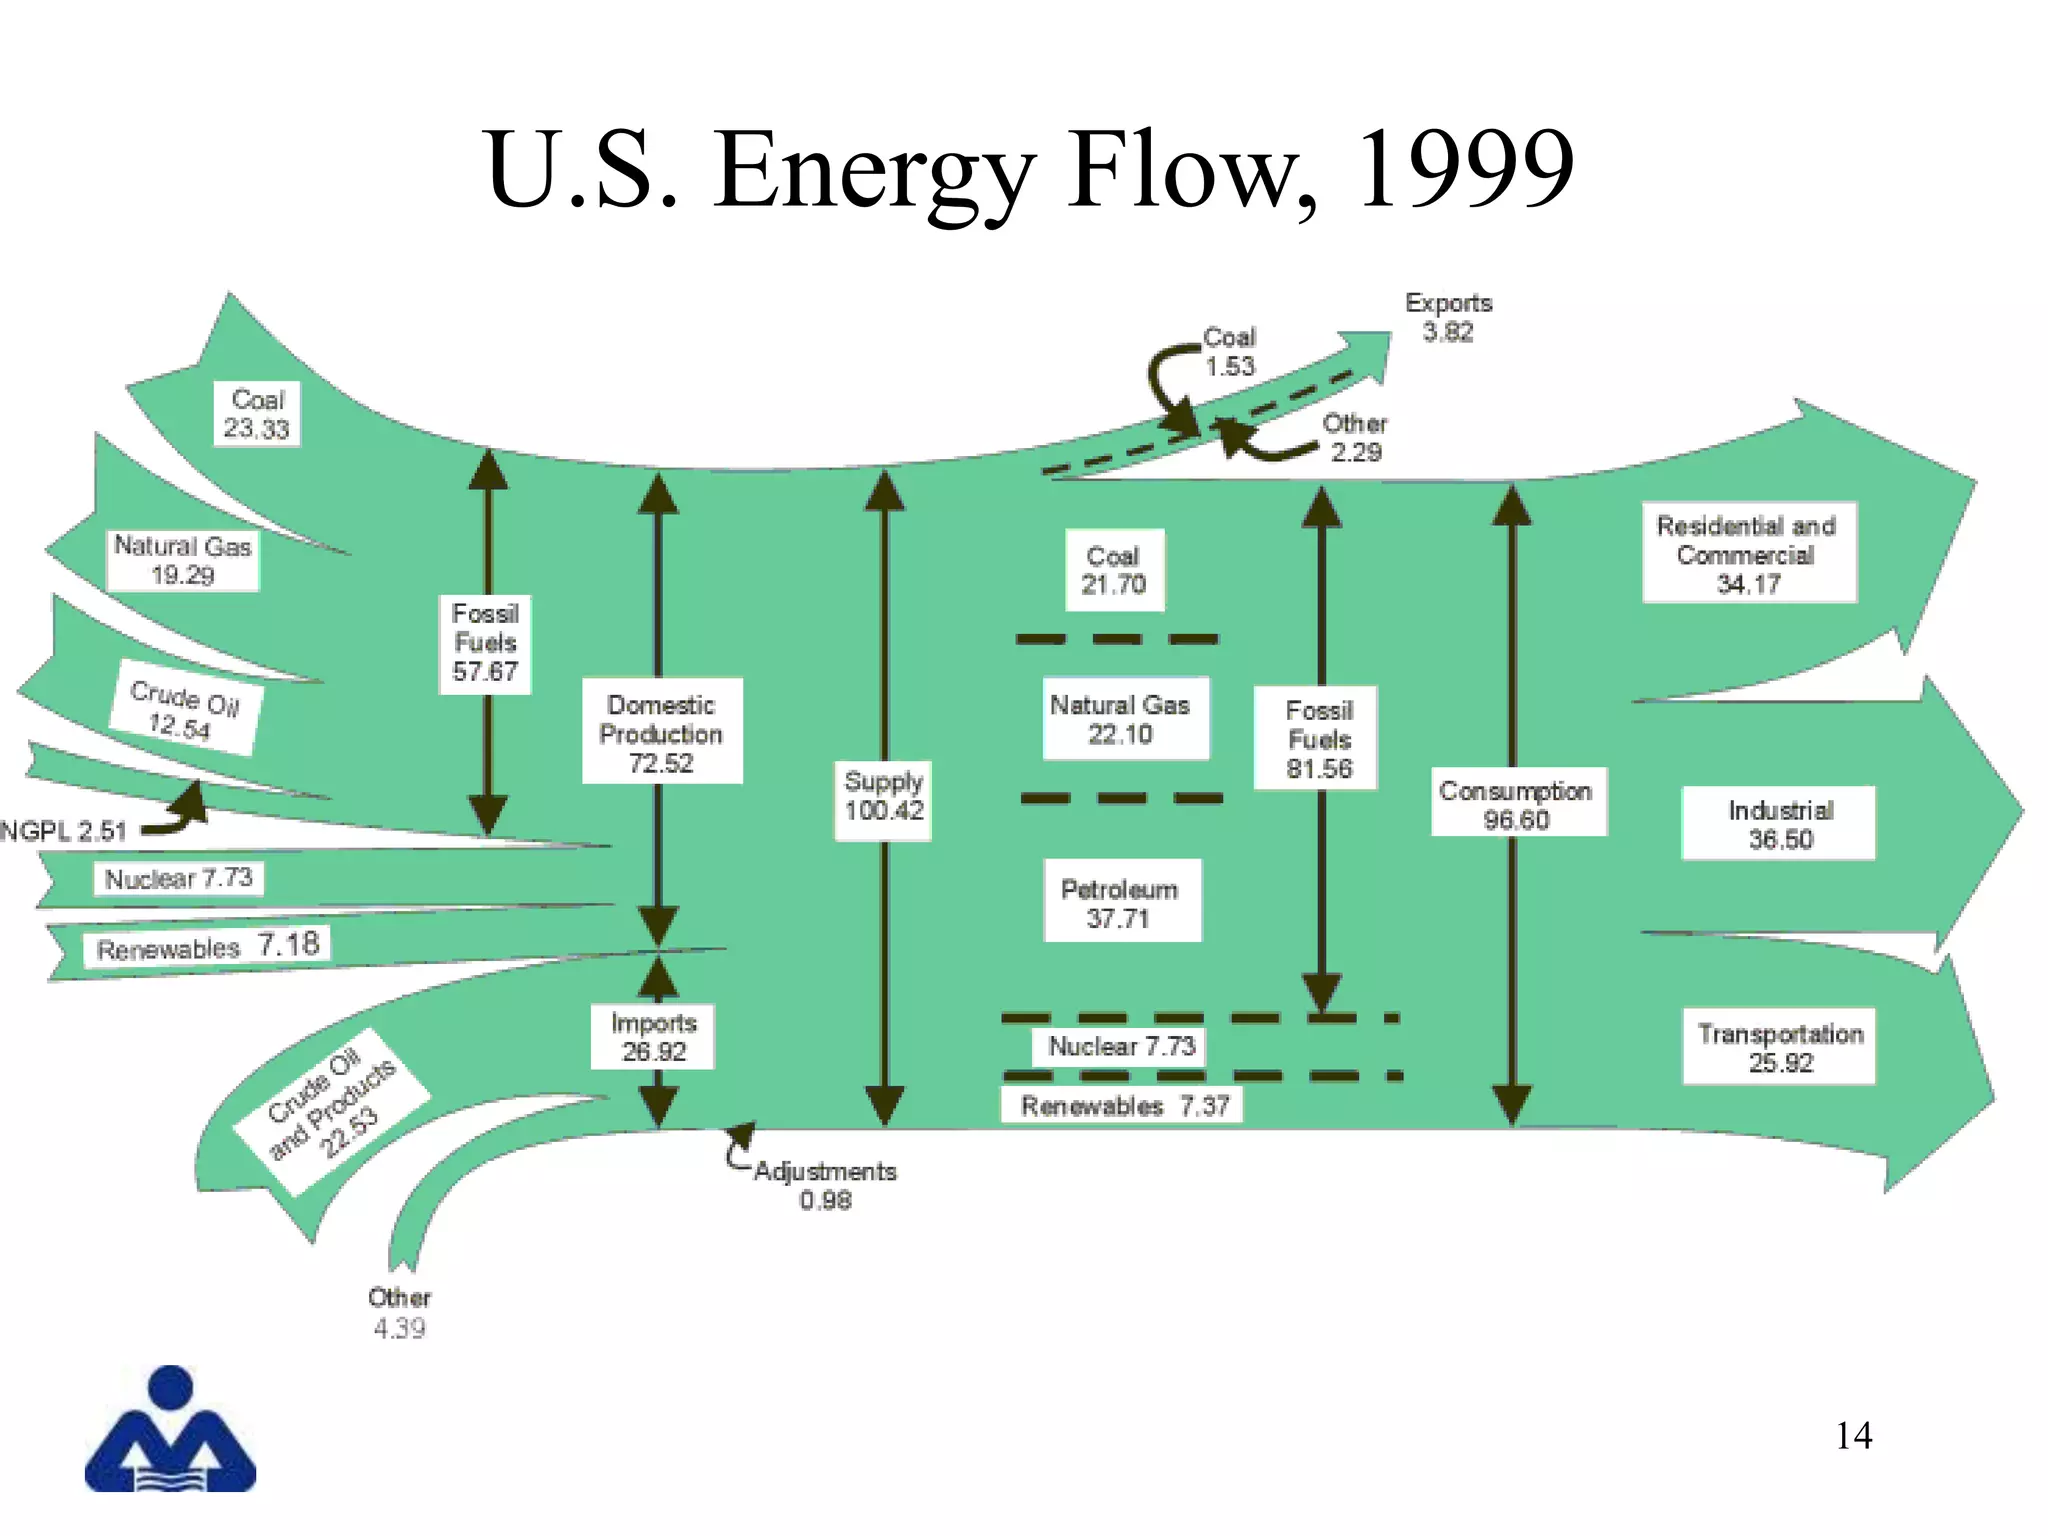
• U.S. Energy Flow [slide 14]
• U.S. Energy Consumption and Renewable Supply [slide 15]
• Additional Resources [slide 16]
2](https://image.slidesharecdn.com/energy-130326013426-phpapp02/75/Energy-2-2048.jpg)


The document outlines global energy resources and consumption trends, including projections that world petroleum production will peak between 2010-2030, with non-renewable fossil fuels like petroleum and coal currently dominating the energy supply. Data is presented on energy production, consumption levels by fuel type and region from 1990-2020, showing China and other developing nations increasing their share of global energy use. Charts and graphs provide statistical overviews of topics like U.S. and world energy flows and the regional distribution of crude oil production.


