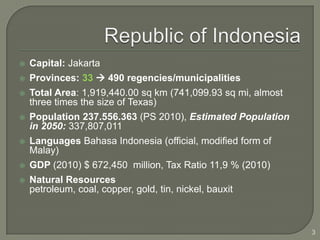
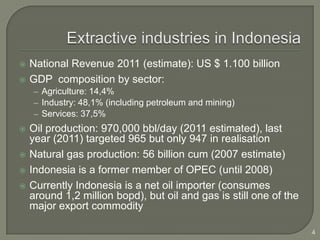
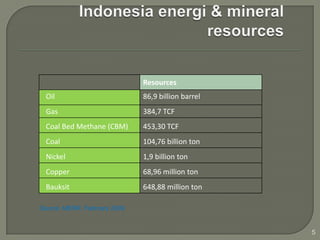
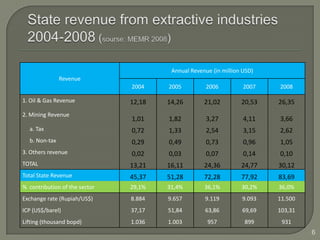
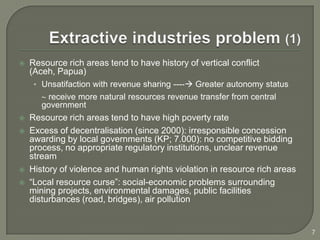
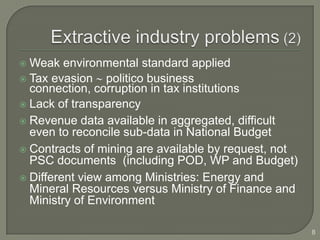
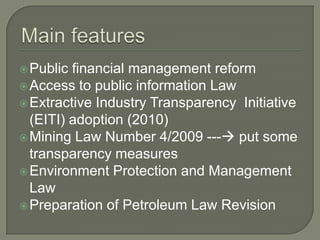
Ridaya Laodengkowe
Coordinator, National Coalition Publish What
                         You Pay Indonesia
2
   Capital: Jakarta
   Provinces: 33  490 regencies/municipalities
   Total Area: 1,919,440.00 sq km (741,099.93 sq mi, almost
    three times the size of Texas)
   Population 237.556.363 (PS 2010), Estimated Population
    in 2050: 337,807,011
   Languages Bahasa Indonesia (official, modified form of
    Malay)
   GDP (2010) $ 672,450 million, Tax Ratio 11,9 % (2010)
   Natural Resources
    petroleum, coal, copper, gold, tin, nickel, bauxit


                                                               3
   National Revenue 2011 (estimate): US $ 1.100 billion
   GDP composition by sector:
    – Agriculture: 14,4%
    – Industry: 48,1% (including petroleum and mining)
    – Services: 37,5%
   Oil production: 970,000 bbl/day (2011 estimated), last
    year (2011) targeted 965 but only 947 in realisation
   Natural gas production: 56 billion cum (2007 estimate)
   Indonesia is a former member of OPEC (until 2008)
   Currently Indonesia is a net oil importer (consumes
    around 1,2 million bopd), but oil and gas is still one of the
    major export commodity

                                                                    4
Resources
  Oil                         86,9 billion barrel
  Gas                         384,7 TCF
  Coal Bed Methane (CBM)      453,30 TCF
  Coal                        104,76 billion ton
  Nickel                      1,9 billion ton
  Copper                      68,96 million ton
  Bauksit                     648,88 million ton

Source: MENR, February 2009


                                                    5
Annual Revenue (in million USD)
               Revenue
                               2004    2005          2006          2007   2008

1. Oil & Gas Revenue           12,18   14,26        21,02         20,53   26,35
2. Mining Revenue
                               1,01    1,82          3,27          4,11   3,66
  a. Tax                       0,72    1,33          2,54          3,15   2,62
  b. Non-tax                   0,29    0,49          0,73          0,96   1,05
3. Others revenue              0,02    0,03          0,07          0,14   0,10
TOTAL                          13,21   16,11        24,36         24,77   30,12
Total State Revenue            45,37   51,28        72,28         77,92   83,69
% contribution of the sector   29,1%   31,4%        36,1%         30,2%   36,0%
Exchange rate (Rupiah/US$)     8.884   9.657        9.119         9.093   11.500
ICP (US$/barel)                37,17   51,84        63,86         69,69   103,31
Lifting (thousand bopd)        1.036   1.003         957           899     931
                                                                                   6
   Resource rich areas tend to have history of vertical conflict
    (Aceh, Papua)
     • Unsatifaction with revenue sharing ---- Greater autonomy status
        receive more natural resources revenue transfer from central
       government
   Resource rich areas tend to have high poverty rate
   Excess of decentralisation (since 2000): irresponsible concession
    awarding by local governments (KP; 7.000): no competitive bidding
    process, no appropriate regulatory institutions, unclear revenue
    stream
   History of violence and human rights violation in resource rich areas
   “Local resource curse”: social-economic problems surrounding
    mining projects, environmental damages, public facilities
    disturbances (road, bridges), air pollution


                                                                            7
 Weak environmental standard applied
 Tax evasion    politico business
  connection, corruption in tax institutions
 Lack of transparency
 Revenue data available in aggregated, difficult
  even to reconcile sub-data in National Budget
 Contracts of mining are available by request, not
  PSC documents (including POD, WP and Budget)
 Different view among Ministries: Energy and
  Mineral Resources versus Ministry of Finance and
  Ministry of Environment

                                                      8
..... Some progress


                      9
 Public financial management reform
 Access to public information Law
 Extractive Industry Transparency Initiative
  (EITI) adoption (2010)
 Mining Law Number 4/2009 --- put some
  transparency measures
 Environment Protection and Management
  Law
 Preparation of Petroleum Law Revision
 Put more transparency in budget process
  and management
 There is space for public engagement, but
  very limited
 Audit of government financial statements
  (agency by agency) are disclouse
 Information of extractive revenue transfer
  are available, though questions remain
 Limited disclousure on (country) revenue
  from extractive industry
 Initiated   by the House of Representative
  (DPR)
 Government agencies mostly do n ot
  realize the significant of the law
 CSOs have been using this for demanding
  document related to extractive industry
 Become the legal basis for adopting EITI
 Government of Indonesia took 2,5 years to come
  up with Presidential Decree to adopt EITI ----
  extensive coordinating works inside government
 Become candidate country on December 20, 2010
  ------ 2 years to achieve compliance country
 Bring uniqueness in EITI implementing countries:
    • Oil and gas
    • Mining
    • Sub-national
   Promote EITI in regional level ---- ASEAN
    (Association of South East Asia Nations, 10
    countries)
 Growing   demand for specific laws
 Limitedcapacity of the House‟s members
 and their staff
 Tendency to „compete‟ with government
 whose staff are more experienced, or more
 chance to hire independent experts
   Awareness of the important to draw reform agenda
    in public finance management (MoF):
    efficiency, uplift Indonesia position in global arena
   Awareness of the important to response to new
    investment challenges (MoF, MENR)
   There are growing concern internationally on the
    important of transparency and accountability
   Need to balance decentralisation with
    „ACCOUNTABILITY‟ (MoF, MOHA)

Transparancyof Extractive Industry in Indonesia - Ridaya Laodengkowe

  • 1.
    Ridaya Laodengkowe Coordinator, NationalCoalition Publish What You Pay Indonesia
  • 2.
  • 3.
    Capital: Jakarta  Provinces: 33  490 regencies/municipalities  Total Area: 1,919,440.00 sq km (741,099.93 sq mi, almost three times the size of Texas)  Population 237.556.363 (PS 2010), Estimated Population in 2050: 337,807,011  Languages Bahasa Indonesia (official, modified form of Malay)  GDP (2010) $ 672,450 million, Tax Ratio 11,9 % (2010)  Natural Resources petroleum, coal, copper, gold, tin, nickel, bauxit 3
  • 4.
    National Revenue 2011 (estimate): US $ 1.100 billion  GDP composition by sector: – Agriculture: 14,4% – Industry: 48,1% (including petroleum and mining) – Services: 37,5%  Oil production: 970,000 bbl/day (2011 estimated), last year (2011) targeted 965 but only 947 in realisation  Natural gas production: 56 billion cum (2007 estimate)  Indonesia is a former member of OPEC (until 2008)  Currently Indonesia is a net oil importer (consumes around 1,2 million bopd), but oil and gas is still one of the major export commodity 4
  • 5.
    Resources Oil 86,9 billion barrel Gas 384,7 TCF Coal Bed Methane (CBM) 453,30 TCF Coal 104,76 billion ton Nickel 1,9 billion ton Copper 68,96 million ton Bauksit 648,88 million ton Source: MENR, February 2009 5
  • 6.
    Annual Revenue (inmillion USD) Revenue 2004 2005 2006 2007 2008 1. Oil & Gas Revenue 12,18 14,26 21,02 20,53 26,35 2. Mining Revenue 1,01 1,82 3,27 4,11 3,66 a. Tax 0,72 1,33 2,54 3,15 2,62 b. Non-tax 0,29 0,49 0,73 0,96 1,05 3. Others revenue 0,02 0,03 0,07 0,14 0,10 TOTAL 13,21 16,11 24,36 24,77 30,12 Total State Revenue 45,37 51,28 72,28 77,92 83,69 % contribution of the sector 29,1% 31,4% 36,1% 30,2% 36,0% Exchange rate (Rupiah/US$) 8.884 9.657 9.119 9.093 11.500 ICP (US$/barel) 37,17 51,84 63,86 69,69 103,31 Lifting (thousand bopd) 1.036 1.003 957 899 931 6
  • 7.
    Resource rich areas tend to have history of vertical conflict (Aceh, Papua) • Unsatifaction with revenue sharing ---- Greater autonomy status receive more natural resources revenue transfer from central government  Resource rich areas tend to have high poverty rate  Excess of decentralisation (since 2000): irresponsible concession awarding by local governments (KP; 7.000): no competitive bidding process, no appropriate regulatory institutions, unclear revenue stream  History of violence and human rights violation in resource rich areas  “Local resource curse”: social-economic problems surrounding mining projects, environmental damages, public facilities disturbances (road, bridges), air pollution 7
  • 8.
     Weak environmentalstandard applied  Tax evasion politico business connection, corruption in tax institutions  Lack of transparency  Revenue data available in aggregated, difficult even to reconcile sub-data in National Budget  Contracts of mining are available by request, not PSC documents (including POD, WP and Budget)  Different view among Ministries: Energy and Mineral Resources versus Ministry of Finance and Ministry of Environment 8
  • 9.
  • 10.
     Public financialmanagement reform  Access to public information Law  Extractive Industry Transparency Initiative (EITI) adoption (2010)  Mining Law Number 4/2009 --- put some transparency measures  Environment Protection and Management Law  Preparation of Petroleum Law Revision
  • 11.
     Put moretransparency in budget process and management  There is space for public engagement, but very limited  Audit of government financial statements (agency by agency) are disclouse  Information of extractive revenue transfer are available, though questions remain  Limited disclousure on (country) revenue from extractive industry
  • 12.
     Initiated by the House of Representative (DPR)  Government agencies mostly do n ot realize the significant of the law  CSOs have been using this for demanding document related to extractive industry  Become the legal basis for adopting EITI
  • 13.
     Government ofIndonesia took 2,5 years to come up with Presidential Decree to adopt EITI ---- extensive coordinating works inside government  Become candidate country on December 20, 2010 ------ 2 years to achieve compliance country  Bring uniqueness in EITI implementing countries: • Oil and gas • Mining • Sub-national  Promote EITI in regional level ---- ASEAN (Association of South East Asia Nations, 10 countries)
  • 14.
     Growing demand for specific laws  Limitedcapacity of the House‟s members and their staff  Tendency to „compete‟ with government whose staff are more experienced, or more chance to hire independent experts
  • 15.
    Awareness of the important to draw reform agenda in public finance management (MoF): efficiency, uplift Indonesia position in global arena  Awareness of the important to response to new investment challenges (MoF, MENR)  There are growing concern internationally on the important of transparency and accountability  Need to balance decentralisation with „ACCOUNTABILITY‟ (MoF, MOHA)