The document provides an overview of India's infrastructure sector, including trends, projected investments, and developments in key subsectors. Some of the key points summarized are:
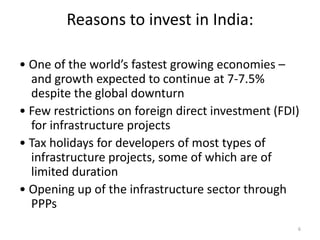
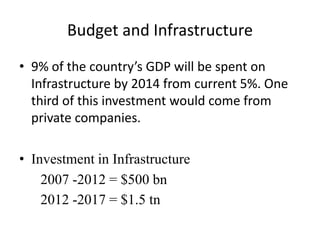
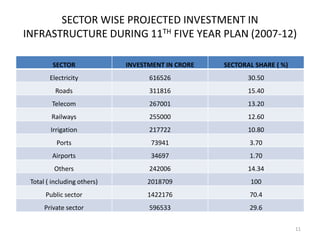
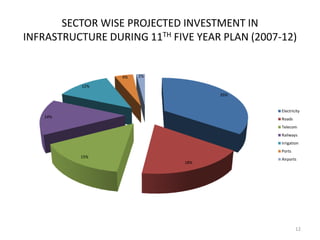
- Total projected investment in infrastructure from 2007-2012 is $500 billion, with electricity, roads, and telecom receiving the largest shares. Private companies are expected to contribute one-third of total infrastructure investment.
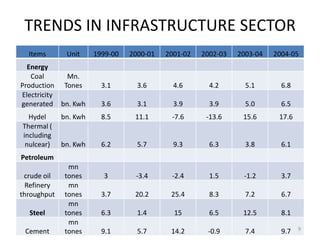
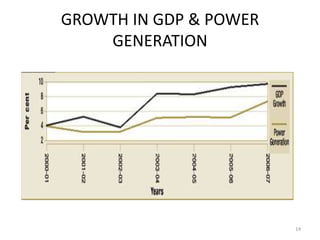
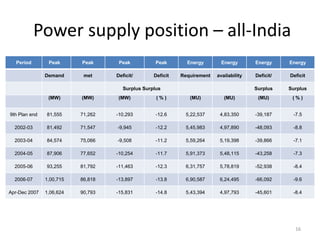
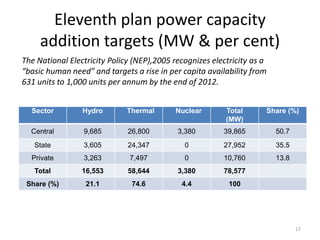
- Power generation grew significantly from 1999-2004, but a supply deficit remains. The 11th Five Year Plan targets adding 78,577 MW of new capacity.
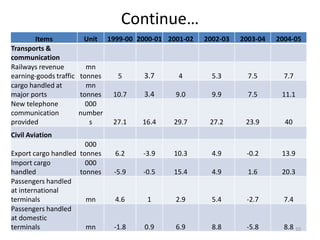
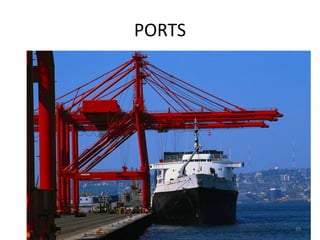
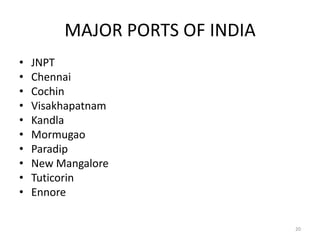
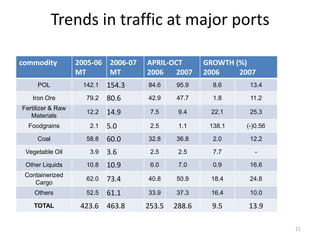
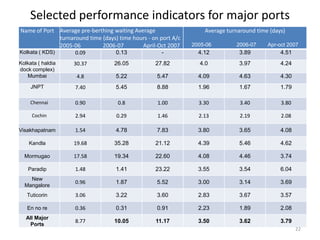
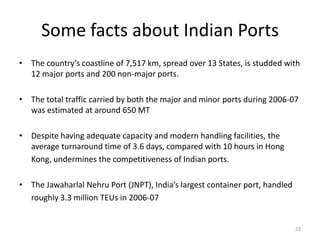
- Cargo traffic at major ports grew nearly 10% annually from 1999-2004. Average turnaround time exceeds international standards.
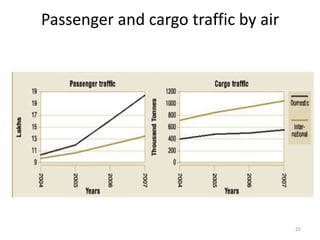
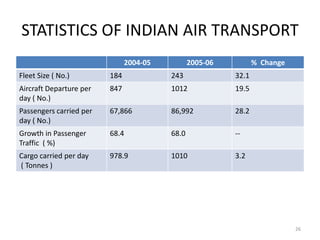
- The aviation sector saw 32
![Conti……………………..
“Expanding investment in infrastructure can play
an important counter cyclical role. Projects and
programmes [are] to be reviewed in the area
of infrastructure development, including pure
public private partnerships, to ensure that their
implementation is expedited and does not suffer
from *the+ fund crunch.”
Mr. Manmohan Singh, Indian Prime Minister,
(quoted in newspaper reports, October, 2008)
4](https://image.slidesharecdn.com/24500117-indias-infrastructure-100129132618-phpapp02/85/24500117-India-S-Infrastructure-4-320.jpg)