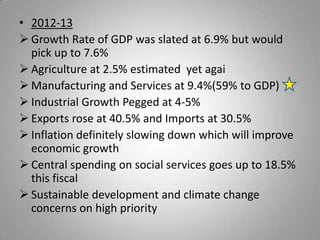
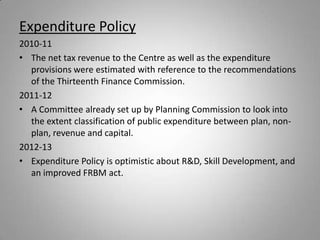
Economic Survey and Union
     Budget Analysis
       By Gaurav Tuli
Content
•   Introduction
•   Union Budget Analysis
•   Expenditure Comparison
•   Deficits and Policies Compared
•   Budget Impacts
•   Where is The Economy Headed ?
•   Conclusion
Introduction
• Budget :- The most extensive account of the
  Government`s finances, in which revenues
  from all sources and expenses of all activities
  undertaken are aggregated. It comprises the
  revenue budget and the capital budget. It also
  contains estimates for the next fiscal year
  called budgeted estimates.
• 2010-11
 Growth Rate of GDP was slated at 8.6%
 Agriculture at 5.4%
 Manufacturing and Services at 8.6%
 Exports and Imports rose at 29.5% and 19% respectively
 Food Inflation, Higher Prices and Volatile Global Markets
  were of concern
 Investments and Savings saw a rise in 2009-10
 In Comparison to Last Year -Trade Gap Narrowed to US $
  82.01 bn and BOP Improved in the year therefore – FD
  and PD
 Survey advised on development of schemes to address
  poverty issues and unemployment
• 2011-12
 Growth Rate of GDP was slated at 6.7% due to
  slowdown of industrial growth
 Agriculture at 2.5% estimated
 Manufacturing and Services at 9.4%(58% to GDP)
 Exports rose at 40% initially but then decelerated
 Food Inflation, Higher Prices saw slowdown due to
  tight monetary policy by RBI
 Investments slowed down, Savings were stable
 BOP Widened in the year to $32.8 Billion
 Sustainable development and climate change are
  becoming central areas of global concern
• 2012-13
 Growth Rate of GDP was slated at 6.9% but would
  pick up to 7.6%
 Agriculture at 2.5% estimated yet agai
 Manufacturing and Services at 9.4%(59% to GDP)
 Industrial Growth Pegged at 4-5%
 Exports rose at 40.5% and Imports at 30.5%
 Inflation definitely slowing down which will improve
  economic growth
 Central spending on social services goes up to 18.5%
  this fiscal
 Sustainable development and climate change
  concerns on high priority
Planned
         Year        Planned Expenditure (in Rs. 00 Crore) Increase %

         2010-11 3,73,092                                        15%

         2011-12 4,41,368                                        18.30%

         2012-13 5,21,025                                        18%

2010-2011:- The government sought to increase payloads on R&D, India was having a
progressive outlook as it was striving to enhance itself on terms on new technology

2011-2012:- Defense was the main front to improve upon for this year as a major chunk
of the budget increase where allocation of funds were Rs. 69,199 crore for Defense in
terms of capital expenditure

2012-2013:- As the budget allocated, was met at almost 99 percent in the 11th Plan, the
government has estimated an 18% again. 15 % higher than approach to 12th Plan
Non-Planned
   Year         Non-Planned Expenditure (in Rs. 00 Crore) Increase %

   2010-11      7,35,657                                            6%

   2011-12      8,15,844                                            10.90%

   2012-13      9,69,900                                            15.89%

2010-2011:- Due to the 34% rise of non-plan expenditure, this year attributed to a
marginal increase as the majority of funds were allocated last year

2011-2012:- XI Plan expenditure more than 100 per cent in nominal terms than
envisaged for the Plan period. Also parts of the funds were transferred to State UT’s

2012-2013:- Estimates are based on agri-extension services and skill development
Year             2010-11           2011-12            2012-2013

Gross Tax
Receipts         7,46,651          9,32,440           10,77,612

Non Tax
Revenue
Receipts         1,48,118          1,25,435           1,64,614


                 3,66,152 (5.1% of 3,95,444(5.9% of   3,66,152(5.1%
Fiscal Deficit   GDP)              GDP)               of GDP)


Net Market
Borrowing        3,45,010          3,43,000           4,79,000
Fiscal Policy
 2010-11
 • With recovery taking root, there was a need to review public
   spending, to mobilize resources and geared them towards
   building the productivity of the economy.

 2011-2012
 • Fiscal consolidation targets at Centre and States have shown
   positive effect on macroeconomic management of the economy
 • Structural concerns on inflation management were addressed by
   improving supply response of agriculture to the expanding
   domestic demand and through stronger fiscal consolidation

 2012-2013
 • Fiscal policy response is better part of past 2 years aimed at
   taming domestic inflationary pressure.
 • To maintain a healthy fiscal situation proposal to raise service tax
   rate from 10 per cent to 12 per cent.
Expenditure Policy
2010-11
• The net tax revenue to the Centre as well as the expenditure
  provisions were estimated with reference to the recommendations
  of the Thirteenth Finance Commission.
2011-12
• A Committee already set up by Planning Commission to look into
  the extent classification of public expenditure between plan, non-
  plan, revenue and capital.
2012-13
• Expenditure Policy is optimistic about R&D, Skill Development, and
  an improved FRBM act.
2010-11
• Automobiles: The proposal to extend weighted deduction for a period of 5
  more years will help auto companies reduce their taxes, while
  simultaneously helping them scale up technologies to global standards.
  The proposed reduction in customs duty on most chemicals and plastics
  from 12.5% to 7.5% will help marginally reduce raw materials costs.

• IT: Companies that benefit from tax exemption under the provisions of the
  Income-Tax Act will have to pay an effective minimum alternate tax.
  Employee stock options will be included for calculating the Fringe Benefit
  tax (FBT).

• Infrastructure: Construction- Benefits of Section 80IA may not be available
  to construction companies. Development of roadways, dedicated freight
  corridors and ports to enhance efficiencies and lower costs
• Pharma: Extension of the 150% weighted average deduction on R&D
  expenditure until FY07 to Be extended by another 5 years. Service tax
  exemption on clinical trials of new drugs

• Capital Goods : More Incentives to Rapid Power Expansion
2011-12
•   Automobile: Positive for the Automobile sector ,central excise duty kept
    unchanged. Special incentives were announced for companies manufacturing
    hybrid vehicles in India.
•   IT: It was low key affair for the Software Sector. The Budget did not mention
    extension of fiscal benefits under the STPI Scheme for Export of Software
    Services, which is due to expire in FY2011. Plan allocation for School Education
    increased by 24% this would boost business opportunities for the IT-Education
    companies
•   Infrastructure: It was continued to lay stress on infrastructure development, as the
    allocation for the sector has been increased by 23%
•   Metals & Mining: Export duty on export of iron ore has been raised to ad valorem
    20% on lumps as well as fines. Negative news for iron ore exporters .No imposition
    of mining tax is a positive for mining companies as well as steel companies with
    captive mines.
•   Pharma: The Budget is neutral for the pharmaceutical sector. Allocation to
    Ministry of Health & Family Welfare have been increased by 20%
    only, Disappointment prevailed for the Pharma companies actively involved in R&D
    activities. There were no indications on the extension of the EOU benefit which
    was available only till FY2011.
•   Capital Goods: The Budget 2011-12, though it did not have many significant direct
    measures for the Capital Goods sector, it sent a positive signal with regards to the
    continued impetus being provided to the Infrastructure and Power Sector of the
    country.
• This year’s budget is more focused on reducing
  fiscal deficits. (2012-13)
• Government intends to recovers the demand
  driven growth, private investments, and fighting
  against corruption.
• Government has to make a growth balance
  among Services and Agriculture Industrial Sector.
• Service sector taxes have as it’s the major
  revenue contributor. This might cause a slight
  slowdown in service sector.
• However, all of these assumptions are dependent
  to world economy and oil price. In my opinion
  this year budget is a fiscal remedy budget rather
  than a real growth stimulating budget.
Sector           Budget Impact
Agriculture      Positive
Automobile       Negative
Aviation         Neutral
Banking          Positive
Capital Goods    Positive
Cement           Positive
FMCG             Negative
Infrastructure   Positive
IT               Neutral
Metal            Neutral
Oil and Gas      Negative
Pharmaceutical   Positive
Power            Positive
Real Estate      Neutral
Union budget analysis

Union budget analysis

  • 1.
    Economic Survey andUnion Budget Analysis By Gaurav Tuli
  • 2.
    Content • Introduction • Union Budget Analysis • Expenditure Comparison • Deficits and Policies Compared • Budget Impacts • Where is The Economy Headed ? • Conclusion
  • 3.
    Introduction • Budget :-The most extensive account of the Government`s finances, in which revenues from all sources and expenses of all activities undertaken are aggregated. It comprises the revenue budget and the capital budget. It also contains estimates for the next fiscal year called budgeted estimates.
  • 5.
    • 2010-11  GrowthRate of GDP was slated at 8.6%  Agriculture at 5.4%  Manufacturing and Services at 8.6%  Exports and Imports rose at 29.5% and 19% respectively  Food Inflation, Higher Prices and Volatile Global Markets were of concern  Investments and Savings saw a rise in 2009-10  In Comparison to Last Year -Trade Gap Narrowed to US $ 82.01 bn and BOP Improved in the year therefore – FD and PD  Survey advised on development of schemes to address poverty issues and unemployment
  • 6.
    • 2011-12  GrowthRate of GDP was slated at 6.7% due to slowdown of industrial growth  Agriculture at 2.5% estimated  Manufacturing and Services at 9.4%(58% to GDP)  Exports rose at 40% initially but then decelerated  Food Inflation, Higher Prices saw slowdown due to tight monetary policy by RBI  Investments slowed down, Savings were stable  BOP Widened in the year to $32.8 Billion  Sustainable development and climate change are becoming central areas of global concern
  • 7.
    • 2012-13  GrowthRate of GDP was slated at 6.9% but would pick up to 7.6%  Agriculture at 2.5% estimated yet agai  Manufacturing and Services at 9.4%(59% to GDP)  Industrial Growth Pegged at 4-5%  Exports rose at 40.5% and Imports at 30.5%  Inflation definitely slowing down which will improve economic growth  Central spending on social services goes up to 18.5% this fiscal  Sustainable development and climate change concerns on high priority
  • 9.
    Planned Year Planned Expenditure (in Rs. 00 Crore) Increase % 2010-11 3,73,092 15% 2011-12 4,41,368 18.30% 2012-13 5,21,025 18% 2010-2011:- The government sought to increase payloads on R&D, India was having a progressive outlook as it was striving to enhance itself on terms on new technology 2011-2012:- Defense was the main front to improve upon for this year as a major chunk of the budget increase where allocation of funds were Rs. 69,199 crore for Defense in terms of capital expenditure 2012-2013:- As the budget allocated, was met at almost 99 percent in the 11th Plan, the government has estimated an 18% again. 15 % higher than approach to 12th Plan
  • 10.
    Non-Planned Year Non-Planned Expenditure (in Rs. 00 Crore) Increase % 2010-11 7,35,657 6% 2011-12 8,15,844 10.90% 2012-13 9,69,900 15.89% 2010-2011:- Due to the 34% rise of non-plan expenditure, this year attributed to a marginal increase as the majority of funds were allocated last year 2011-2012:- XI Plan expenditure more than 100 per cent in nominal terms than envisaged for the Plan period. Also parts of the funds were transferred to State UT’s 2012-2013:- Estimates are based on agri-extension services and skill development
  • 12.
    Year 2010-11 2011-12 2012-2013 Gross Tax Receipts 7,46,651 9,32,440 10,77,612 Non Tax Revenue Receipts 1,48,118 1,25,435 1,64,614 3,66,152 (5.1% of 3,95,444(5.9% of 3,66,152(5.1% Fiscal Deficit GDP) GDP) of GDP) Net Market Borrowing 3,45,010 3,43,000 4,79,000
  • 13.
    Fiscal Policy 2010-11 • With recovery taking root, there was a need to review public spending, to mobilize resources and geared them towards building the productivity of the economy. 2011-2012 • Fiscal consolidation targets at Centre and States have shown positive effect on macroeconomic management of the economy • Structural concerns on inflation management were addressed by improving supply response of agriculture to the expanding domestic demand and through stronger fiscal consolidation 2012-2013 • Fiscal policy response is better part of past 2 years aimed at taming domestic inflationary pressure. • To maintain a healthy fiscal situation proposal to raise service tax rate from 10 per cent to 12 per cent.
  • 14.
    Expenditure Policy 2010-11 • Thenet tax revenue to the Centre as well as the expenditure provisions were estimated with reference to the recommendations of the Thirteenth Finance Commission. 2011-12 • A Committee already set up by Planning Commission to look into the extent classification of public expenditure between plan, non- plan, revenue and capital. 2012-13 • Expenditure Policy is optimistic about R&D, Skill Development, and an improved FRBM act.
  • 16.
    2010-11 • Automobiles: Theproposal to extend weighted deduction for a period of 5 more years will help auto companies reduce their taxes, while simultaneously helping them scale up technologies to global standards. The proposed reduction in customs duty on most chemicals and plastics from 12.5% to 7.5% will help marginally reduce raw materials costs. • IT: Companies that benefit from tax exemption under the provisions of the Income-Tax Act will have to pay an effective minimum alternate tax. Employee stock options will be included for calculating the Fringe Benefit tax (FBT). • Infrastructure: Construction- Benefits of Section 80IA may not be available to construction companies. Development of roadways, dedicated freight corridors and ports to enhance efficiencies and lower costs • Pharma: Extension of the 150% weighted average deduction on R&D expenditure until FY07 to Be extended by another 5 years. Service tax exemption on clinical trials of new drugs • Capital Goods : More Incentives to Rapid Power Expansion
  • 17.
    2011-12 • Automobile: Positive for the Automobile sector ,central excise duty kept unchanged. Special incentives were announced for companies manufacturing hybrid vehicles in India. • IT: It was low key affair for the Software Sector. The Budget did not mention extension of fiscal benefits under the STPI Scheme for Export of Software Services, which is due to expire in FY2011. Plan allocation for School Education increased by 24% this would boost business opportunities for the IT-Education companies • Infrastructure: It was continued to lay stress on infrastructure development, as the allocation for the sector has been increased by 23% • Metals & Mining: Export duty on export of iron ore has been raised to ad valorem 20% on lumps as well as fines. Negative news for iron ore exporters .No imposition of mining tax is a positive for mining companies as well as steel companies with captive mines. • Pharma: The Budget is neutral for the pharmaceutical sector. Allocation to Ministry of Health & Family Welfare have been increased by 20% only, Disappointment prevailed for the Pharma companies actively involved in R&D activities. There were no indications on the extension of the EOU benefit which was available only till FY2011. • Capital Goods: The Budget 2011-12, though it did not have many significant direct measures for the Capital Goods sector, it sent a positive signal with regards to the continued impetus being provided to the Infrastructure and Power Sector of the country.
  • 19.
    • This year’sbudget is more focused on reducing fiscal deficits. (2012-13) • Government intends to recovers the demand driven growth, private investments, and fighting against corruption. • Government has to make a growth balance among Services and Agriculture Industrial Sector. • Service sector taxes have as it’s the major revenue contributor. This might cause a slight slowdown in service sector. • However, all of these assumptions are dependent to world economy and oil price. In my opinion this year budget is a fiscal remedy budget rather than a real growth stimulating budget.
  • 20.
    Sector Budget Impact Agriculture Positive Automobile Negative Aviation Neutral Banking Positive Capital Goods Positive Cement Positive FMCG Negative Infrastructure Positive IT Neutral Metal Neutral Oil and Gas Negative Pharmaceutical Positive Power Positive Real Estate Neutral