

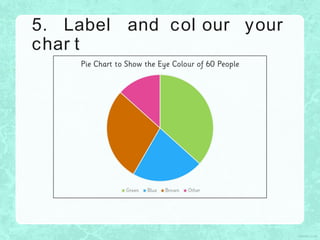


This document provides instructions for creating a pie chart from a set of data. It explains how to 1) collect and organize the data, 2) calculate the size of each section by dividing 360 degrees by the total number of data points to get the degrees each represents, 3) draw the pie chart by constructing the angles for each section using a protractor, and 4) label and color the chart. It also discusses how to handle more complex data sets involving larger numbers or decimals.


![Presenting-Experimental-Data-Grade-8 [Autosaved].pptx](https://cdn.slidesharecdn.com/ss_thumbnails/presenting-experimental-data-grade-8autosaved-240925105557-9775d0ae-thumbnail.jpg?width=640&height=640&fit=bounds)
![Presenting-Experimental-Data-Grade-8 [Autosaved].pptx](https://cdn.slidesharecdn.com/ss_thumbnails/presenting-experimental-data-grade-8autosaved-240925104859-008a237a-thumbnail.jpg?width=640&height=640&fit=bounds)


