This document discusses using complex wavelet transforms to analyze power signals and classify power quality disturbances. It generates simulated power signals containing different disturbance types and extracts features from the signal decompositions. A neural network is trained on these features to classify the disturbance types. The summary finds that complex wavelet transforms provide higher classification accuracy compared to discrete wavelet transforms, due to the complex wavelets' shift invariant nature.
![Abstract-- This paper deals with analysis of power signals using
complex wavelet transform. In the first step power signals
containing sag, swell, harmonic, sag-harmonic, swell harmonic,
transient and spike were generated using Matlab. Various
features like energy, kurtosis, entropy, skewness etc. were
extracted using ‘db4’ and complex wavelet decomposition up to
11 levels. Next, an extensive database of these features was
created. A neural network based on these parameters was
trained and tested. It has been shown that the accuracy achieved
by using complex wavelet is higher than obtained by the use of
‘db4’ wavelet.
Index Terms-- Complex wavelet, Feature extraction, Neural
network, Power quality
I. INTRODUCTION
Power quality analysis has been of utmost importance to
experts which helps in determining any disturbances in the
network and proposes if any fault is present in the system.
Through effective power monitoring, system errors can be
classified at an earlier stage and thus the safety and reliability
can be improved.
It is important to note that the disturbances like harmonics
give a non-stationary characteristic to the power signal.
Various techniques [1-7] have been used for analysis of
signals. FT gives the frequency-amplitude plot of a signal.
Consider a stationary voltage signal and choose another signal
having varying frequency components. FT analysis of both
signals will give the same plot. Hence FT cannot be applied
to non-stationary signals. STFT considers some part of the
non-stationary signal as stationary and then analyses it. This
involves the use of a window function of a constant width and
This work was supported by the DST under Grant SR/S3/EECE/46/2007
B.K. Panigrahi is with the Department of Electrical Engineering, Indian
Institute of Technology Delhi, New Delhi 110016 India (e-mail:
bkpanigrahi@ee.iitd.ac.in).
Anant Baijal is UG student in School of Electrical Engineering, VIT
University, Vellore, TN 632014 India (e-mail: anantbaijal2008@vit.ac.in)
Krishna Chaitanya P. and Preetam P. Nayak are UG students in School of
Electrical Sciences, Indian Institute of Technology, Bhubaneshwar India
(email: krishna.iitbbsr@gmail.com, preetam.iitbbs@gmail.com)
thus is a mono-resolution technique. To beat the problem of
resolution WT was developed. The history of wavelets can be
traced in [8]. WT is similar to STFT as it also involves a
signal which is multiplied with a window function but differs
because width of the window changes with every spectral
component. This is also called Multi Resolution Analysis. It is
a powerful time-frequency analysis tool which also gives
information about the time instant at which a particular
frequency component is present unlike FT or STFT. Wavelet
based analysis finds application in image processing, video
compression, numerical methods and power signal analysis. It
is shown that power quality analysis using complex wavelet
transformation is superior to that obtained by discrete wavelet
transform.
II. WAVELET TRANSFORM
Wavelets are localised waves having their energy concerted
in space and time. The wavelet transformation yields poor
frequency resolution and better time resolution at high
frequency but better frequency resolution at lower frequencies.
WT can be classified into continuous WT and DWT. In
continuous WT, each wavelet is created by scaling and
translating operations in a mother wavelet. The mother
wavelet is an oscillate function with finite energy and zero
average [9]. The continuous WT of a continuous time signal
x(t) is defined as
∫
∞
∞−
= dtttx baba )()(
*
,, ψψ (1)
where
)(tψ is the mother wavelet, a is scaling parameter, b is
translating parameter
and ⎟
⎠
⎞
⎜
⎝
⎛ −
=
a
bt
a
tba
**
,
1
)( ψψ (2)
The discrete WT of the sampled signal x(i) is given by
∑= i dcdc iix )()(
*
,, ψψ (3)
where
⎟⎟
⎠
⎞
⎜⎜
⎝
⎛ −
= c
o
c
oo
c
o
dc
a
adbi
a
i **
,
1
)( ψψ (4)
‘c’ and ‘d’ are scaling and sampling numbers respectively.
Power Quality Analysis using Complex Wavelet
Transform
B.K. Panigrahi, Senior Member, IEEE, Anant Baijal, Krishna Chaitanya P. and Preetam P. Nayak](https://image.slidesharecdn.com/c0371a3c-3563-423c-9e6c-bc05529e0ba0-151221065156/75/PID1563185-1-2048.jpg)
![There are many wavelet functions named as mother
wavelets. A mother wavelet which closely resembles the
signal to be analysed is chosen for transformation. Wavelet
families include Haar, Coiflet, Daubechies, Morlet and Symlet
wavelets.
A. db4
The db4 wavelet is compactly supported, orthogonal and
has highest number of vanishing moment for a given width
but is shift variant in nature. The scaling filters are minimum-
phase filters. These wavelets best match to signals with sag,
swell or harmonic disturbances and so are considered for
feature extraction. DWT is performed by the use of low pass
and high pass decomposition filters and down sampling by
two at each level.
B. Complex Wavelet
Family of complex wavelets is built using complex
Gaussian function. The complex wavelet transform has a real
filter and an imaginary filter for both low pass and high pass
and so a total of four filters per level. The real and imaginary
coefficients are used to compute amplitude and phase
information of the signal, which are needed to describe the
energy localizations of the functions on the wavelet basis.
Fig.1 gives the structure of complex wavelet decomposition of
a signal x(t).
Fig. 1 Decomposition of signal using Complex wavelet Transformation
CWT is shift invariant [10], unlike DWT. To show this, a
sine signal was generated using the parametric equations.
Complex wavelet filters were used to extract energy feature.
This was performed on the original signal and also on the
signals obtained by phase-shift. Fig2 confirms the shift
invariant nature of CWT.
0
0.5
1
1.5
2
2.5
1 2 3 4 5 6 7
Decomposition Levels
Energy
(-pi/6) degrees
0 degree
pi/6 degrees
Fig. 2 Wave Energies of Coefficients at each level using CWT
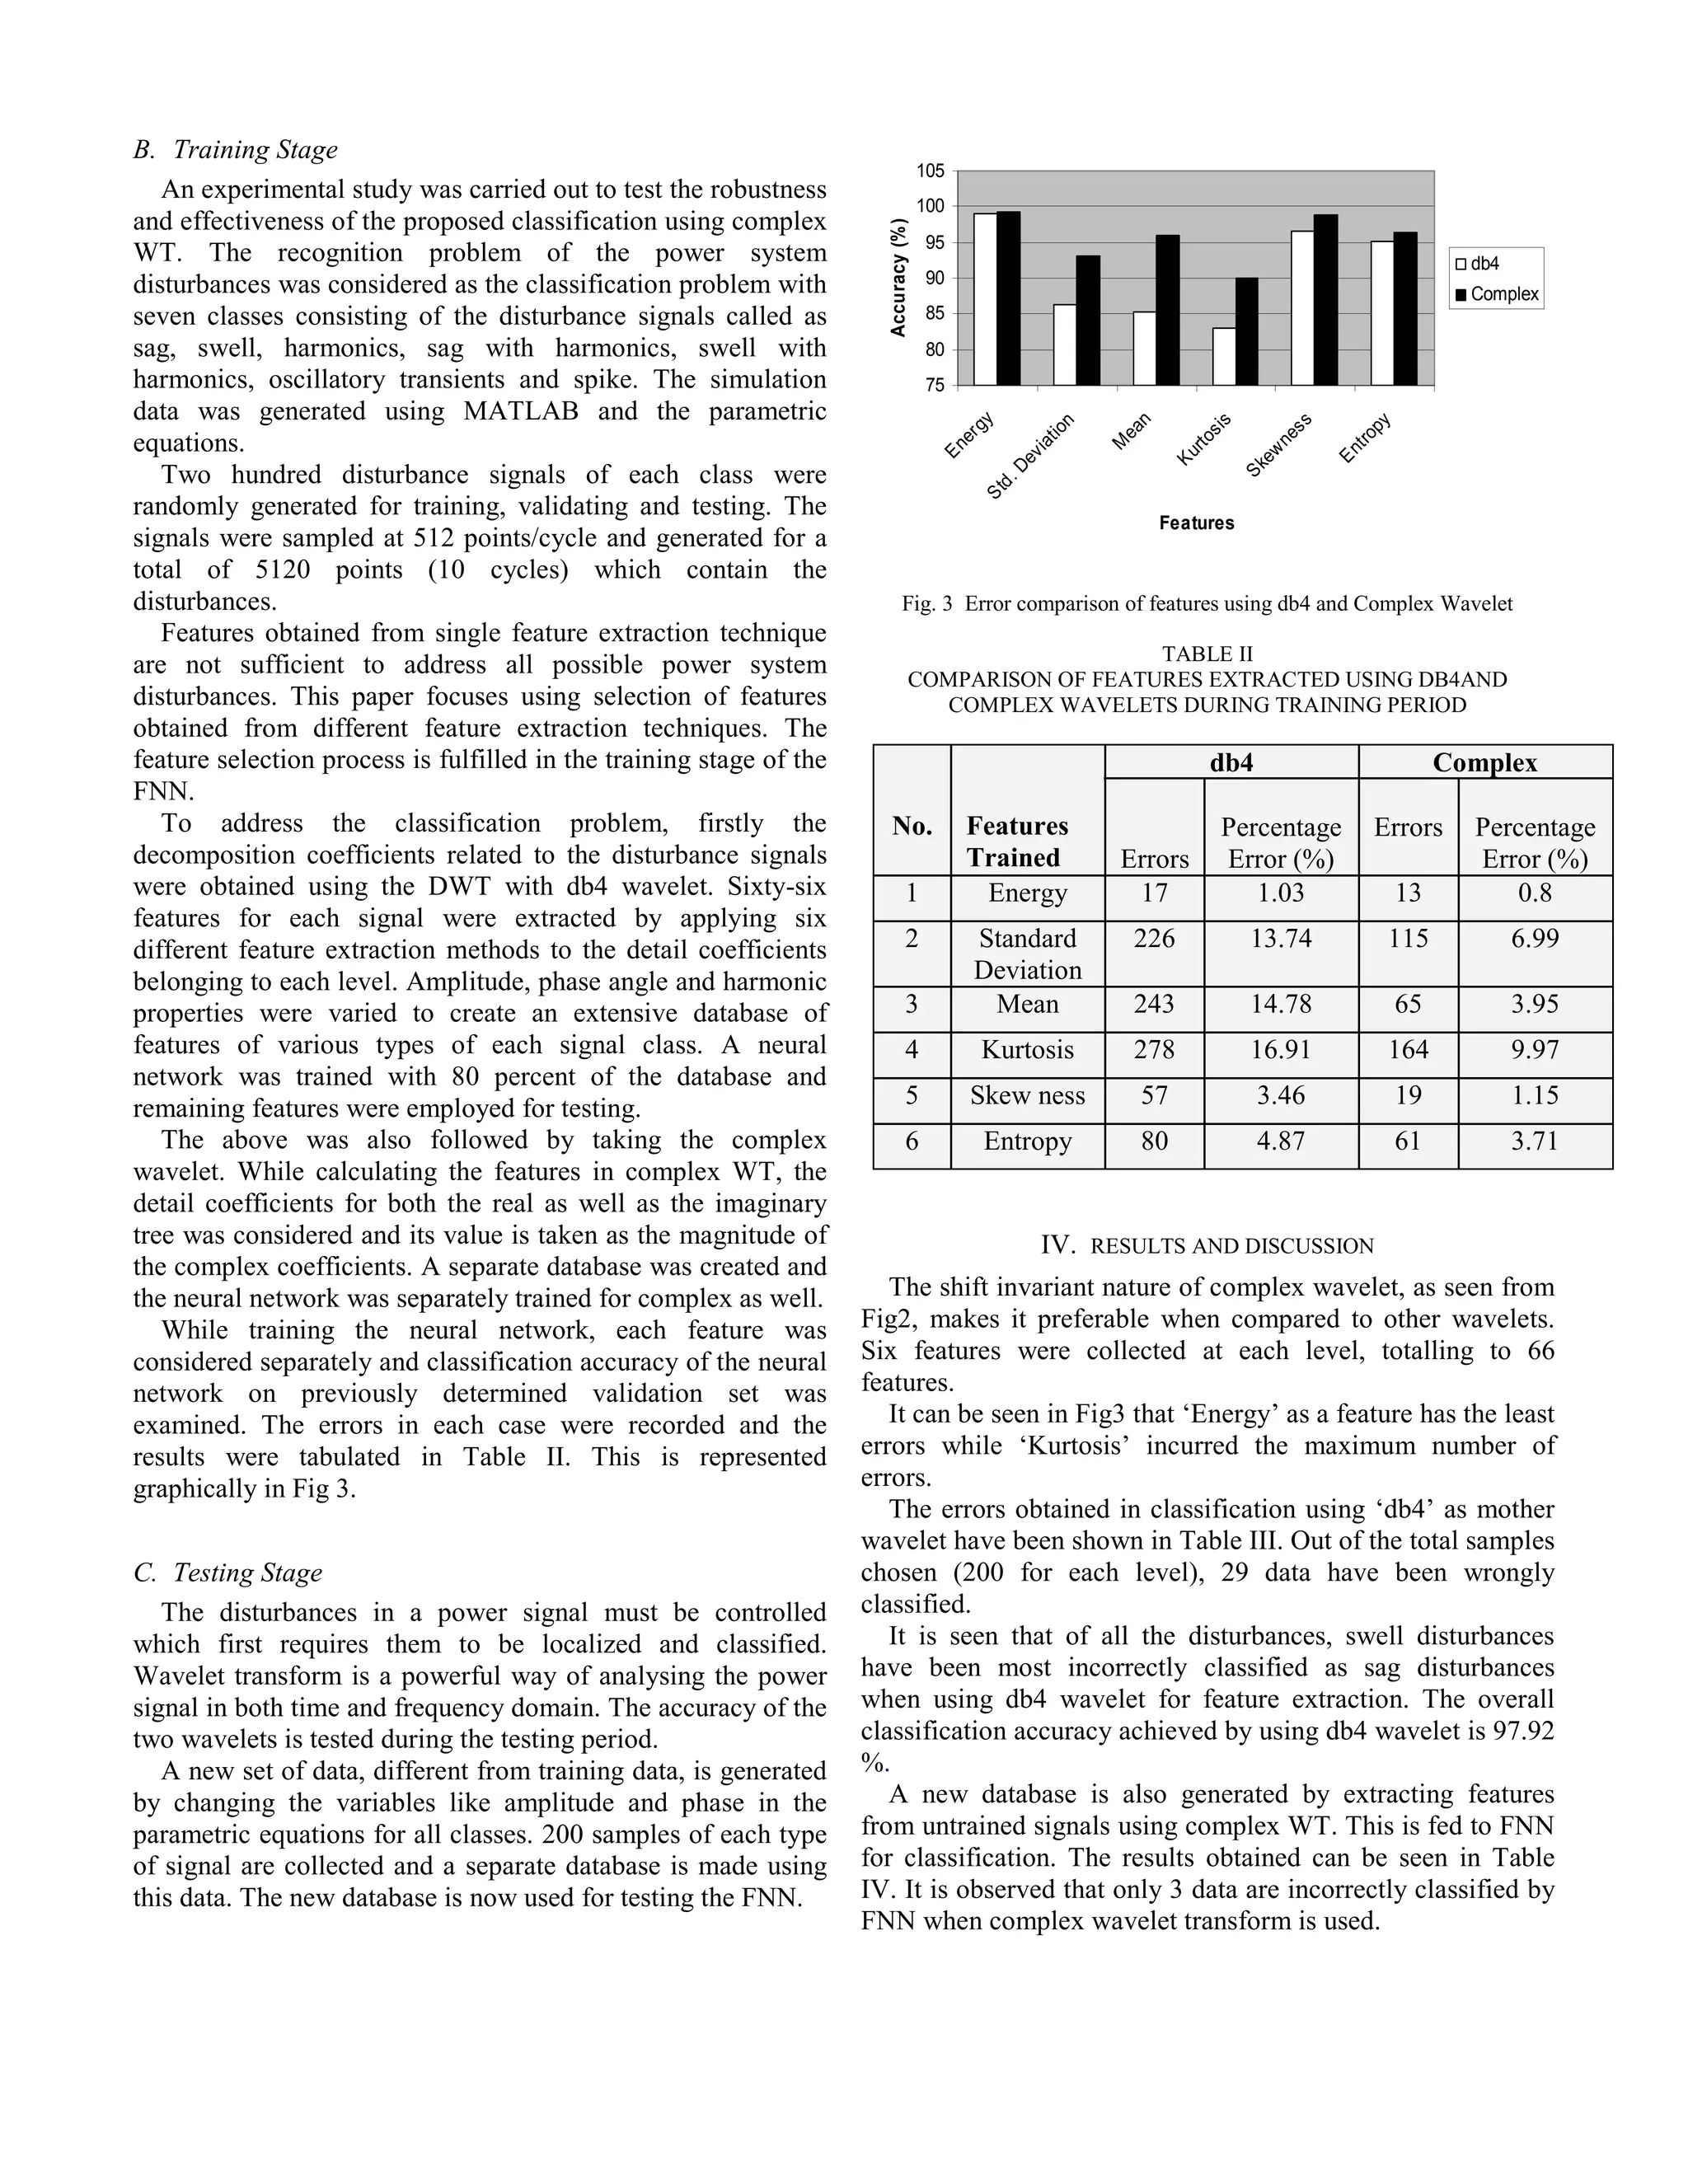
III. POWER QULAITY ANALYSIS
A. Feature Extraction
The detail and approximation coefficients are not directly
used as classifier inputs. To reduce the feature dimension, the
feature extraction methods have been applied to the
coefficients at every decomposition level. In this study, all the
methods of mean, standard deviation, skewness, kurtosis,
energy and shannon-entropy given in Table I were used as the
features extractors. All methods were individually applied to
the detail coefficients of each level up to 11 levels and
features were extracted.
TABLE I.
FORMULATION OF FEATURES EXTRACTION TECHNIQUES
Features Formulation of Detailed Coefficients
(i=1,2…..,11)
Mean ∑=
=
N
j
ijd d
N 1
1
μ
Standard
Deviation
2
1
2
)(
1
d
N
j
ijd d
N
μσ −= ∑=
Skewness
∑=
−
=
N
j d
dijd
N
S
1
3
3
)(
6
1
σ
μ
Kurtosis }3
)(
{
1
24 1
4
4
∑=
−
−
=
N
j d
dijd
N
N
K
σ
μ
Energy
2
1
∑=
=
N
j
ijdE
Shanon
Entropy
)log(
2
1
2
ij
N
j
ij ddE ∑=
−=](https://image.slidesharecdn.com/c0371a3c-3563-423c-9e6c-bc05529e0ba0-151221065156/75/PID1563185-2-2048.jpg)
![d Sampling number
C1 Sag
C2 Swell
C3 Harmonic
C4 Sag Harmonic
C5 Swell Harmonic
C6 Oscillatory transient
C7 Spike signal
Analysis Filters used in CWT
Real Tree
Low pass High pass
0 0
-0.08838834764832 -0.01122679215254
0.08838834764832 0.01122679215254
0.69587998903400 0.08838834764832
0.69587998903400 0.08838834764832
0.08838834764832 -0.69587998903400
-0.08838834764832 0.69587998903400
0.01122679215254 -0.08838834764832
0.01122679215254 -0.08838834764832
0 00
Imaginary Tree
Low pass High pass
0.01122679215254 0
0.01122679215254 0
-0.08838834764832 -0.08838834764832
0.08838834764832 -0.08838834764832
0.69587998903400 0.69587998903400
0.69587998903400 -0.69587998903400
0.08838834764832 0.08838834764832
-0.08838834764832 0.08838834764832
0 0.01122679215254
0 -0.01122679215254
VII. ACKNOWLEDGMENT
The authors wish to acknowledge GIPEDI.AICET of Bharti
School of Telecom Technology and Management, IIT Delhi
and the Indian Academy of Sciences for providing an
opportunity to undertake this project.
VIII. REFERENCES
[1] S. Santoso, W.M. Grady, E.J. Powers, J.Lamoree, S.C. Bhatt,
Distribution power quality events with fourier and wavelet transforms,
IEEE Trans. Power Deliv. 15 (1) (2000)
[2] P.K. Dash, M.M.A. Salama, S.Mishra, A.C. Liew, Classification of
power system disturbances using a fuzzy expert system and a fourier
linear combiner, IEEE Trans. Power Deliv. 15 (2) (2000) 472-477
[3] C.H. Lee, S.W. Nam, Efficient feature vector extraction for automation
classification of power quality disturbances, Electr. Lett. 34 (11) (1998)
1059-1061
[4] L. Angrisani, P.Daponte and Massimo D. Apuzzo, Wavelet network
based detection and classification of transients, IEEE Trans. Power
Deliv., vol. 50, no. 5 (2001) 1425-1435
[5] J. Huang, M.Negnevitsky, D.T. Nguyen, A Neural fuzzy classifier for
recognition of power quality disturbances, IEEE Trans. Power Deliv.,
vol.15, no.2 (2002) 609-616
[6] J.L.J Driesen R. J.L. Belmans, Wavelet based power quantification
approaches, IEEE Trans. Power Deliv., vol. 52, no.4 (2003) 1232-1238
[7] G.T. Heydt, A.W. Galli, Transient power quality problems analysed
using wavelets, IEEE Trans. Power Deliv. Vol.12, no.2 (1997) 908-915
[8] I Daubechies, Where do wavelets come from?- A personal point of
view, Porc. IEEE, 84(4), 510-513, 1996
[9] A.M. Gaouda, M.M.A. Salama, M.R. Sulatan, A.Y. Chikhani, Power
quality detection and classification using wavelet multiresolution signal
decomposition, IEEE Trans. Power Deliv. 14 (4) (1999) 1469-1476
[10] N G Kingsbury, Complex wavelets for shift invariant analysis and
filtering of signals, Journal of Applied and Computational Harmonic
Analysis, vol. 10, no 3 (2001) 234-253](https://image.slidesharecdn.com/c0371a3c-3563-423c-9e6c-bc05529e0ba0-151221065156/75/PID1563185-5-2048.jpg)