This document discusses using wavelet transforms to analyze vibration signals from bearings for condition monitoring. It describes performing discrete wavelet transforms and wavelet packet transforms on bearing vibration data to extract statistical features like wavelet energy, entropy, and FFT magnitudes. These features are then used as inputs to an artificial neural network to classify signals as normal or faulty. The results show wavelet-based vibration monitoring can successfully detect and classify bearing faults.
![Najad K K1
www.ijetst.in Page 388
IJETST- Vol.||03||Issue||05||Pages 388-395||May||ISSN 2348-9480 2016
International Journal of Emerging Trends in Science and Technology
Wavelet Based Bearing Health Condition Monitoring
Najad K K1
, Shrikantha S. Rao2
and VPS Naidu3
1
Dept. of Mechanical Engg, National Institute of Technology, Surathkal, India, najadkk@gmail.com
2
Dept. of Mechanical Engg, National Institute of Technology, Karnataka, Surathkal, India, srcsr@gmail.com
3
MSDF lab, FMCD, CSIR-National Aerospace Laboratories, Bangalore, India, vpsnaidu@gmail.com
ABSTRACT
Bearings are one of the major machinery components used in industries such as automotive, power plants
and chemical plants. Thus condition based monitoring and fault diagnoses of rolling bearings represent the
condition of machine and their failures, which result in a system critical damage, downtime, and costly
repair. This paper deals with fault diagnosis of bearing using vibration analysis techniques. The statistical
features such as wavelet energy, Wavelet entropy and FFT magnitude of bearing signal is estimated from the
wavelet transform of signals, which is later used for the classification of normal and faulty bearing signals
using artificial neural network. The resultsireveal that vibration based monitoring method using wavelet
transform is successful in detecting and classifying theffaults in the bearing.
Keywords: Condition monitoring, Wavelet transform, Bearing Diagnosis, Neural network.
1 INTRODUCTION
Condition health monitoring is an important
technique used in maintenance of the machines. It
is the process of monitoring various parameters of
machine conditions such as vibration, temperature,
etc to identify the tunexpected breakdown and
maximize the running time [1]. Vibration analysis
is one of the best tools for diagnosis of rotating
machinery problems in order to keep the machine
performing at its best. It can be used to extract the
fault features and then identify the fault patterns
involved with it. Here, the vibration monitoring is
employed as a method for monitoring the bearing
condition. The commonly used vibration
monitoring techniques are: Time domain Analysis,
Frequency domain Analysis, Time-Frequency
domain analysis.
Time domain analysis is a much simpler
techniquesto implement compared to the other
mentioned techniques. In this technique, various
statistical features such as Root Mean Square
(RMS), Kurtosis, Crest factor, Variance, etc. are
calculated and by comparing these features,
particular faults can be easily identified [2].
In Frequency domain analysis, the time
domain signal is converted (transformed) into
frequency domain by Fourier Transform (FT).
Characteristic defect frequencies [2] of bearing are
determined, which provides the information on the
type of bearing faultsobserved. Frequency domain
analysis can be observed by using the techniques
such as Fast Fourier Transform (FFT), Envelope
analysis, Cepstrum analysis, Hilbert transform, and
Spectral kurtosis[3].
Time-Frequency analysis consists of
techniques, which analyze a signal in both time
domain and frequency domain simultaneously.
This technique can be implemented using Wavelet
Transform, Short Time Fourier Transform and
Wigner-Ville distribution [3].
This paper focuses on condition monitoring
of industrial bearing using Time-Frequency
analysis. Discrete Wavelet Transform (DWT) and
Wavelet Packet Transform (WPT) are used as the
method for Time-Frequency analysis. These
methods have been carried out to extract features,
which are then used to classify the bearing signals
using Neural Network.
2 METHODOLOGY
Wavelet packet analysis and statistical
methods are integrated to diagnose bearings fault.
First, the wavelet packet analysis is used to carry
on the division of the bearing's vibration signal,
and then the statistical methods are used to
determine/diagnosis whether the bearing is in
normal or fault condition.](https://image.slidesharecdn.com/daefadbe-f156-44c3-aafa-8df69025a86b-160628184830/85/Conference-Full-Paper-template-1-320.jpg)
![Najad K K1
www.ijetst.in Page 388
IJETST- Vol.||03||Issue||05||Pages 388-395||May||ISSN 2348-9480 2016
International Journal of Emerging Trends in Science and Technology
Wavelet Based Bearing Health Condition Monitoring
Najad K K1
, Shrikantha S. Rao2
and VPS Naidu3
1
Dept. of Mechanical Engg, National Institute of Technology, Surathkal, India, najadkk@gmail.com
2
Dept. of Mechanical Engg, National Institute of Technology, Karnataka, Surathkal, India, srcsr@gmail.com
3
MSDF lab, FMCD, CSIR-National Aerospace Laboratories, Bangalore, India, vpsnaidu@gmail.com
ABSTRACT
Bearings are one of the major machinery components used in industries such as automotive, power plants
and chemical plants. Thus condition based monitoring and fault diagnoses of rolling bearings represent the
condition of machine and their failures, which result in a system critical damage, downtime, and costly
repair. This paper deals with fault diagnosis of bearing using vibration analysis techniques. The statistical
features such as wavelet energy, Wavelet entropy and FFT magnitude of bearing signal is estimated from the
wavelet transform of signals, which is later used for the classification of normal and faulty bearing signals
using artificial neural network. The resultsireveal that vibration based monitoring method using wavelet
transform is successful in detecting and classifying theffaults in the bearing.
Keywords: Condition monitoring, Wavelet transform, Bearing Diagnosis, Neural network.
1 INTRODUCTION
Condition health monitoring is an important
technique used in maintenance of the machines. It
is the process of monitoring various parameters of
machine conditions such as vibration, temperature,
etc to identify the tunexpected breakdown and
maximize the running time [1]. Vibration analysis
is one of the best tools for diagnosis of rotating
machinery problems in order to keep the machine
performing at its best. It can be used to extract the
fault features and then identify the fault patterns
involved with it. Here, the vibration monitoring is
employed as a method for monitoring the bearing
condition. The commonly used vibration
monitoring techniques are: Time domain Analysis,
Frequency domain Analysis, Time-Frequency
domain analysis.
Time domain analysis is a much simpler
techniquesto implement compared to the other
mentioned techniques. In this technique, various
statistical features such as Root Mean Square
(RMS), Kurtosis, Crest factor, Variance, etc. are
calculated and by comparing these features,
particular faults can be easily identified [2].
In Frequency domain analysis, the time
domain signal is converted (transformed) into
frequency domain by Fourier Transform (FT).
Characteristic defect frequencies [2] of bearing are
determined, which provides the information on the
type of bearing faultsobserved. Frequency domain
analysis can be observed by using the techniques
such as Fast Fourier Transform (FFT), Envelope
analysis, Cepstrum analysis, Hilbert transform, and
Spectral kurtosis[3].
Time-Frequency analysis consists of
techniques, which analyze a signal in both time
domain and frequency domain simultaneously.
This technique can be implemented using Wavelet
Transform, Short Time Fourier Transform and
Wigner-Ville distribution [3].
This paper focuses on condition monitoring
of industrial bearing using Time-Frequency
analysis. Discrete Wavelet Transform (DWT) and
Wavelet Packet Transform (WPT) are used as the
method for Time-Frequency analysis. These
methods have been carried out to extract features,
which are then used to classify the bearing signals
using Neural Network.
2 METHODOLOGY
Wavelet packet analysis and statistical
methods are integrated to diagnose bearings fault.
First, the wavelet packet analysis is used to carry
on the division of the bearing's vibration signal,
and then the statistical methods are used to
determine/diagnosis whether the bearing is in
normal or fault condition.](https://image.slidesharecdn.com/daefadbe-f156-44c3-aafa-8df69025a86b-160628184830/75/Conference-Full-Paper-template-1-2048.jpg)
![Najad K K1
www.ijetst.in Page 389
IJETST- Vol.||03||Issue||05||Pages 388-395||May||ISSN 2348-9480 2016
The steps involved in health condition
monitoring and classification of the bearing
signals is shown in Figure 1.
The acquired vibration signals from bearing are
first divided into segments of length with 12000
data samples.
Wavelet Transform is then applied to the each
segmented vibration signal. The coefficients in
a wavelet tree are determined using wavelet
decomposition that used to extract signal
features within in a frequency band.
Decomposed signal is further processed to
extract statistical features such as wavelet
energy, Wavelet entropy, FFT magnitude of
coefficients in each level. Each Wavelet
coefficient is used as “features” describing the
time and frequency component of signals.
The features thus extracted from the processing
operation are fed as input into an artificial
neural network, which carries out the
classification over the set of extracted
parameters.
Figure 1: Bearing signal classification Process
3 WAVELET TRANSFORM
Wavelet Transform is a mathematical tool,
which transformssequential data in time axis to
the spectral data in both time and frequency.
Waveletstransformsprovides information of non-
stationary signals regarding a particular frequency
of interest. This information in wavelet transform
can be easily used to detect clocal features in a
signal. Wavelet Transform can be done through
two approaches:
3.1. Discrete Wavelet Transform (DWT)
The discrete wavelet transform (DWT)
provides a very efficient-representation for a wide
range of real signals. In DWT, a signal, or data is
decomposediinto many frequency segments. As
shown in Figure 2, DWT issachieved by dividing
Signal Nnnx ,...,2,1),( whose length is N as
„Approximation‟ part cA1 and „Detail‟ part cD1.
Approximation part is the segments with low
ifrequency range and high scale, whereassDetail
part is the bsegment with high frequency range
and low scale [4]. Figure 2 shows DWT of a
signal with sampling frequency of 12000Hz. The
maximum frequency component (nyquist
frequency) that appears in the signal is 6000 Hz.
The approximation part is obtained by
passing the signal through Low Pass Filter (LPF)
and Detail part is obtained by passing the signal
through High Pass Filter (HPF). The
approximation part is subsequently split into a
second-level approximation and detail part, and
the process is repeated. Maximum number of
decomposition levels for a signal ‘x’ is
log2(length(x)).For k-level decomposition, there
are k+1 possible ways to decompose or encode the
signal [5].
Figure 2: Discrete wavelet transform
decomposition for level 3
3.2. Wavelet Packet Transform (WPT)
Wavelet Packet Transform (WPT)
decomposition is an extended method of Discrete
Wavelet Transform to overcome the problems
faced in analyzing the signals particularly in
middlesandnhigh frequency band.
In WPT, the signal is passed through
additional filters when compared to the DWT, so
at each level both the approximation and detail
coefficient is filtered as shown in Figure 3.
Therefore, there is no difference between
approximation and detail coefficient in each level
[5, 6]. For k levels of decomposition, the WPT
produces 2k
different sets of coefficients (or
nodes).
Raw
vibration
signals
Divide
vibration
data into
segments
Feature extraction:
Wavelet Energy,
Wavelet Entropy,
FFT magnitude
Artificial
Neural
Network
Signal
classification
WPT
Decomposition
0 – 6k
0 – 0.75k
3k– 6k
1.5k – 3k
cD1
cD2
x
cA3
0 – 1.5k
0 – 3k
cA2
cA1
0.75k– 1.5k
cD3](https://image.slidesharecdn.com/daefadbe-f156-44c3-aafa-8df69025a86b-160628184830/85/Conference-Full-Paper-template-2-320.jpg)
![Najad K K1
www.ijetst.in Page 390
IJETST- Vol.||03||Issue||05||Pages 388-395||May||ISSN 2348-9480 2016
4 STATISTICAL FEATURES
The useful features from decomposed signal
are extracted using statistical method which are
further described below. The statistical features
thus obtained are concatenated into a single
feature vector for classification of signals.
4.1. Wavelet Energy
For bearing signals with different failures,
the energy distributions at given frequency bands
are always varied [6]. Therefore, Wavelet Energy
(Eki) can be considered as an important feature for
classification.
Figure 3: Wavelet Packet Transform decomposition for level 3
Normalization should be taken to avoid the
inconvenience of 2numerical analysis due to large
value of Eki, Energy is computed for all wavelet
coefficients present in a wavelet tree as:
k
n
kiki
N
nnDE
2
,...,2,1,)(
2
(1)
The total energy (Etot) can be obtained by
k i
kitot EE (2)
100*
tot
ki
ki
E
E
P (3)
The normalized value kiP which represents
relative wavelet energy is calculated for all
wavelet coefficients using the equation(3). Clearly
the 100 kiP and the relative energy kiP can
be considered as time scale density. This give
suitable tool for detecting specificephenomenon in
time and frequency scales. The relative wavelet
energy provides information about the relative
energyzassociated with different frequency bands
present in the bearing and their icorresponding
degree of importance.
4.2. Wavelet Entropy
The Wavelet Entropy ( EW ) appears as a measure
of the degree of order/disorder of the signal. It
provides useful information about the underlying
dynamical process associated with the signal [7].
The wavelet entropy (WE) is defined as:
]ln[* kikiE DDW (4)
When the signal is flat, the entropy is
minimum and entropy increases with fluctuations.
4.3. Maximum magnitude of FFT
The Fast Fourier Transform feature used in
classifying bearing signal as the average of the
five highest absolute FFT values measured in each
wavelet coefficient. Averaging is done to reduce
the effect of noise. The equation to define the
feature is:
5
1
)(
5
1
n
mag nFFTff (6)
Where, magFFT is the absolute magnitude of
FFT coefficients sorted in descending order. This
feature is used to find out the dominant frequency
component in each level coefficient.
Once different coefficient of each level is
obtained, maximum magnitudes of FFT is
estimated. Magnitudes of FFT are minimum for
normal signals and its value increases for faulty
bearing signals.
5 ARTIFICIAL NEURAL NETWORK
Artificial neural network (ANN), is most
commonly used technique in the Diagnostics
literature. An ANN consists of a layer of input
nodes, one or more layers of hidden nodes, one
layer of output nodes and connecting weights.
Figure 4 shows the architecture of ANN. The
network learns the unknown function by adjusting
its weights with repetitive observations of inputs
0 – 0.75k 1.5k – 2.25k0.75 – 1.5k
4.5k– 6k
5.25k – 6k3k – 3.75k2.25k – 3k
D10 D11
D20 D21
x
D30 D31
D22 D23
D32 D33 D37D34
0 – 6k
0 – 3k 3k– 6k
1.5k– 3k
4.5k – 5.25k
3k– 4.5k0 – 1.5k
3.75k –4.5k
D35 D36](https://image.slidesharecdn.com/daefadbe-f156-44c3-aafa-8df69025a86b-160628184830/85/Conference-Full-Paper-template-3-320.jpg)
![Najad K K1
www.ijetst.in Page 391
IJETST- Vol.||03||Issue||05||Pages 388-395||May||ISSN 2348-9480 2016
and outputs. They are effectiven and efficient at
modelling complex non-linear systems and can
generalize and adapt solutions from a limited data
set.
Figure 4: Artificial neural network architecture
Network architecture is of two kinds: Feed
Forward (static) Network: input ofieach layer
depends on the outputs of previous layer and
Dynamic Network: input of each layer depends on
the output offprevious node.
Different types of ANN used for machine
learning are: 1). Feed-forward neural network
(FFNN): Commonly used neural network
structure in machine for fault diagnosis. Training
is performed by inputting set of examples with
targeted output. The network will learn the
patterns from the inputs and adjust the weights of
the internaloconnections to reduce the errors
between the network and target outputs. After that
training system will be ready to respond for the
new input data [8]. 2) Radial basis functions
network (RBFN): used to model complex
mapping due to its non-linear approximation
properties. RBFN trainsiquicker than FFNN and
can deal with non-linearpproblems with complex
mappings.
In this paper, the back propagation
algorithm is used for learning andttraining the
network. Back Propagation networks are ideal for
simple PatternsRecognition and Mapping Tasks.
Learning occurs in the perceptron by changing
connection weights after each piece of data
ispprocessed, based on the amount of error in the
output compared to the expected result. The
algorithm will stop when the value of the
errorsfunction has become sufficiently small.
6 RESULTS AND DISCUSSION
The wavelet packet decomposition is
performed on the experimental dataset obtained
from the bearing test rig of Case Western Reserve
University [9]. The time-domain vibration signals
of bearing were collected from the normal case,
the ball defect case, the inner race defect case,
and the case of the outer race defect. The shaft
rotating speeds of the motor are 1730, 1750,
1772, and 1796 rpm, and the sampling frequency
is 12000Hz. For all fault conditions, the defect
size of point fault is 7 millimetre in diameter. The
total number of bearing vibration signal is
divided into 5 segments with each of 12000
samples.
Bearing vibration signal is decomposed
into sub-band by using the wavelet packet
transformation with the Daubechies wavelet of
order 5 up to level 3. The wavelet coefficients
D30,D31,…,D37 were computed [10]. The total and
relative sub-band energies were computed from
the extracted wavelet coefficients for each
segment. The mean ± standard deviation values
of relative wavelet energy E30,E31,…,E37 were
calculated using Equation(3).
The eight frequency band coefficients of
the level 3 wavelet packet transform and the
mean ± standard deviation values of Wavelet
Energy for 1796 rpm of each coefficients in level
3 are shown in Table 1. In order to distinguish
the four types of bearings, the mean ± standard
deviation of energy of them are compared in each
corresponding frequency band, and the frequency
band in which the energy has changed largely is
used to analyze. The main reasons for selecting
the frequency band mentioned above is it may
contain more fault information, which distinguish
the four types of bearings more distinctly.
TABLE 1 : MEAN ± STD DEVIATION OF
WAVELET ENERGY FOR 1796 RPM
Normal Inner race
defect
Ball defect Outer race
defect
E30
31.4317
±
0.4576
4.4462
±
0.1784
6.0359
±
0.5662
0.6795
±
0.0695
E31
58.8689
±
0.3241
11.0917
±
0.1294
3.0691
±
0.1468
0.3666
±
0.0495
E32
0.9116
±
0.0364
30.2202
±
0.3852
33.0261
±
0.7527
32.9952
±
1.1988
E33
8.2691
±
0.0981
7.7059
±
0.1694
1.8045
±
0.0742
0.9686
±
0.0655
E34
0.0063
±
0.0006
0.1208
±
0.0315
0.0338
±
0.0046
0.3707
±
0.0962
E35
0.0902
±
0.0073
0.6447
±
0.0357
0.1748
±
0.0059
0.6145
±
0.0785
E36
0.1236
±
0.0027
39.1245
±
0.1893
54.6029
±
1.2799
59.6964
±
1.3678
E37
0.2986
±
0.0046
6.6460
±
0.4590
1.2527
±
0.0398
4.3085
±
0.0617
Input OutputHidden](https://image.slidesharecdn.com/daefadbe-f156-44c3-aafa-8df69025a86b-160628184830/85/Conference-Full-Paper-template-4-320.jpg)
![Najad K K1
www.ijetst.in Page 394
IJETST- Vol.||03||Issue||05||Pages 388-395||May||ISSN 2348-9480 2016
output layer. 10 samples randomly chosen from
the whole 16 samples (4 samples each from Inner
race, Outer race, Ball defect and normal) were
used for training the neural network. The
remaining 6 samples were kept aside for testing
and validation. This task was performed using
MATLAB and neural network toolbox. The neural
network pattern recognition tool will help to train
a network and evaluate its performance using
cross entropy and confusion matrices.
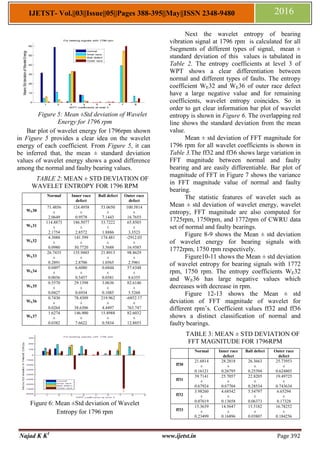
The performance of this model can be
determined by the computation of classification
accuracy. The plot of confusion matrix is given in
Figure 14, which gives detail idea about the
classification of bearing samples. The confusion
matrix is plotted across all samples. It shows the
percentages of correct and incorrect
classifications. Correct classifications are the
green squares on the matrices diagonal. Incorrect
classifications form the red squares.
Classification matrix shows a 100% classification
accuracy, so it seems that features derived from
relative wavelet energy, wavelet entropy and
magnitude of FFT in different frequency bands are
useful to classify normal and faulty bearing
signals.
Figure 14: Confusion matrices showing
classification accuracy of training, test and
validation data
7 CONCLUSION
Wavelet transform based bearing health
condition monitoring algorithm has been
developed and tested its performance using the
data obtained from Case Western Reserve
University. Wavelet packet transform (WPT) has
been used to decompose the signal into different
frequency bands. Features such as relative
wavelet energy (E), wavelet entropy (WE) and
magnitude of FFT are computed which provides
information associated with different frequency
bands of the bearing signals. These features are
fed as input to the artificial neural network to
classify the bearing signals into 4 outputs (inner
race defect, outer race defect, and ball defect,
normal). From the training and testing, it is
observed that ANN classifier gives a
classification accuracy of 100%. The results
reveal that vibration based monitoring method
using wavelet transform is successful in detecting
the faults and classifying the bearing.
REFERENCES
[1] Pratyusha LP, Shanmukhapriya V. and VPS
Naidu, „Bearing Health Condition
Monitoring: Time domain analysis‟, In-
ternational Journal of Advanced Research
in Electrical, Electronics, and
Instrumentation Engineering (IJAREEIE),
2014 Dec; 3(5): 64–71.
[2] Shanmukhapriya V, Ramesh MR and VPS
Naidu, „Bearing Health Condition
Monitoring: Frequency domain analysis‟,
International Journal of Advanced
Research in Electrical, Electronics, and
Instrumentation Engineering (IJAREEIE).
2014 Dec; 3(5): 260–68.
[3] V Shanmukhapriya, P Mahalakshmi and
VPS Naidu, „Bearing Health Condition
Monitoring: Wavelet Decomposition‟,
Indian Journal of Science and Technology,
Vol 8(26), IPL0569, October 2015.
[4] Peng Yang and Qiufeng Li, „Wavelet
transform-based feature extraction for
ultrasonic flaw signal classification‟,
Neural Comput & Applic (2014) 24:817–
826.
[5] Hongyu Yang, „Automatic Fault Diagnosis
of Rolling Element Bearings Using
Wavelet Based Pursuit Features‟, PhD
thesis paper Queensland University of
Technology, October 2004.
[6] G Ghodrati Amiri and A Asadi,
„Comparison of Different Methods of
Wavelet and Wavelet Packet Transform in
Processing Ground Motion Records‟,
International Journal of Civil Engineering.
Vol. 7, No. 4, December 2009.
[7] JR Panda, S Khobragade, D Jambhule, N
Jengthe, P R Pal, K Gandhi, „Classification
1 2 3 4
1
2
3
4
4
33.3%
0
0.0%
0
0.0%
0
0.0%
100%
0.0%
0
0.0%
2
16.7%
0
0.0%
0
0.0%
100%
0.0%
0
0.0%
0
0.0%
3
25.0%
0
0.0%
100%
0.0%
0
0.0%
0
0.0%
0
0.0%
3
25.0%
100%
0.0%
100%
0.0%
100%
0.0%
100%
0.0%
100%
0.0%
100%
0.0%
Target Class
OutputClass
Training Confusion Matrix
1 2 3 4
1
2
3
4
0
0.0%
0
0.0%
0
0.0%
0
0.0%
NaN%
NaN%
0
0.0%
1
50.0%
0
0.0%
0
0.0%
100%
0.0%
0
0.0%
0
0.0%
0
0.0%
0
0.0%
NaN%
NaN%
0
0.0%
0
0.0%
0
0.0%
1
50.0%
100%
0.0%
NaN%
NaN%
100%
0.0%
NaN%
NaN%
100%
0.0%
100%
0.0%
Target Class
OutputClass
Validation Confusion Matrix
1 2 3 4
1
2
3
4
0
0.0%
0
0.0%
0
0.0%
0
0.0%
NaN%
NaN%
0
0.0%
1
50.0%
0
0.0%
0
0.0%
100%
0.0%
0
0.0%
0
0.0%
1
50.0%
0
0.0%
100%
0.0%
0
0.0%
0
0.0%
0
0.0%
0
0.0%
NaN%
NaN%
NaN%
NaN%
100%
0.0%
100%
0.0%
NaN%
NaN%
100%
0.0%
Target Class
OutputClass
Test Confusion Matrix
1 2 3 4
1
2
3
4
4
25.0%
0
0.0%
0
0.0%
0
0.0%
100%
0.0%
0
0.0%
4
25.0%
0
0.0%
0
0.0%
100%
0.0%
0
0.0%
0
0.0%
4
25.0%
0
0.0%
100%
0.0%
0
0.0%
0
0.0%
0
0.0%
4
25.0%
100%
0.0%
100%
0.0%
100%
0.0%
100%
0.0%
100%
0.0%
100%
0.0%
Target Class
OutputClass
All Confusion Matrix](https://image.slidesharecdn.com/daefadbe-f156-44c3-aafa-8df69025a86b-160628184830/85/Conference-Full-Paper-template-7-320.jpg)
![Najad K K1
www.ijetst.in Page 395
IJETST- Vol.||03||Issue||05||Pages 388-395||May||ISSN 2348-9480 2016
of EEG Signal Using Wavelet Transform
and Support Vector Machine for Epileptic
Seizure Diction‟, Proceedings of 2010
Intnl. Conf on Sys in Medicine and
Biology16-18 December 2010.
[8] Hafeez, Aamir Saeed, Rana, Nasreen,
Nidal, Muhammad and Weng-Tink
Chooi,„Feature extraction and classification
for EEG signals using wavelet transform
and machine learning techniques‟,
Australas Phys Eng Sci Med (2015)
38:139–149.
[9] http://csegroups.case.edu/bearingdatacenter/
pages/download-data-file accessed on 22nd
march 2016.
[10]Osvaldo A Rosso, Susana Blanco, Juliana
Yordanova, Vasil Kolev, Alejandra
Figliola, Martin Schurmann and Erol Basar,
„Wavelet entropy: a new tool for analysis of
short duration brain electrical signals‟,
Journal of Neuroscience Methods 105
(2001) 65–75.](https://image.slidesharecdn.com/daefadbe-f156-44c3-aafa-8df69025a86b-160628184830/85/Conference-Full-Paper-template-8-320.jpg)


![[IJET V2I5P7] Authors: Mr. Vaibhav A. Kalhapure, Dr.R.R.Navthar](https://cdn.slidesharecdn.com/ss_thumbnails/ijet-v2i5p7-161107140453-thumbnail.jpg?width=640&height=640&fit=bounds)