SlideShare a Scribd company logo
Pickering Emulsion: Nanoparticle Surface Concentrations
Erin Blauvelt,∗
O.N.e O’Neill, and Daniel H. Ou-Yang
Lehigh Department of Physics
(Dated: July 31, 2015)
We are developing an outline for a new method of determining the concentration of nanoparticles
(Fe3O4) on the surface of an oil droplet (hexyl-decanol) in a water and oil Pickering emulsion. We
use fluorescently tagged nanoparticles in our experiments. By observing our nanoparticles suspended
in water using fluorescence confocal microscopy, we are able to determine a relation between the
observed nanoparticle intensity and the nanoparticle concentration. We obtain intensities across
the full vertical sweep of a sample on a microscope slide and observe a gradient distribution. Using
a method of sampling the observed gradient, we can make estimates in determining the intensity
for a known concentration of nanoparticles in water. If we can obtain reliable intensities for droplet
images, through this intensity to concentration mapping, we can determine the surface concentration
of nanoparticles on droplets in our emulsion. We provide a table of observed oil droplet surface
intensities and oil water interface intensities, discuss the results, and offer ways to move forward
with the project.
1. PICKERING EMULSIONS
Emulsions are the stable mixture of two liquids which
are not generally able to mix with one another, such as
oil and water. Classically surfactants are used to stablize
emulsions of immiscible liquids. However solid particles
can be used, this is called a Pickering emulsion. Fig. 1
below shows the basic structure of emulsifiers around an
oil droplet in both a classical and Pickering emulsion. See
the review by Chevalier and Bolzinger Emulsions stabi-
lized with solid nanoparticles: Pickering emulsions Col-
loids and Surfaces A: Physicochem. Eng. Aspects 439
(2013) 2334, from which Fig. 1 was obtained, for a nice
introduction to the basics of Pickering emulsions.
FIG. 1: Oil droplets in water for a classical emulsion and for
a Pickering emulsion (Chevalier and Bolzinger 2013).
Classical emulsions using surfactants have shown some
undesirable characteristics in their use in cosmetics and
pharmaceuticals. In most applications Pickering parti-
cles can be substituted for surfactants in classical emul-
sions. Pickering emulsions using solid particles as an
emulsifier may provide a way to avoid some undesir-
able effects (such as irritation and chemical waste) that
can come along with using surfactants. (Chevalier and
Bolzinger 2013).
Another point of interest is the potential to easily re-
∗Electronic address: ekb215@lehigh.edu
cover an emulsifier, Pickering particles may be a can-
didate for this. Particles with magnetic properties can
be extracted from an emulsion using magnets. The iron
oxide nanoparticles used in our experiment have mag-
netic properties, allowing for a method for extracting and
reusing this emulsifier to be developed.
In our experiments we seek to determine the surface
concentrations of nanoparticles on oil droplets in our
emulsion. Understanding the surface concentration of
nanoparticles on the surface of oil droplets in our emul-
sion will help us to better understand the interaction of
nanoparticles at the interface between oil and water. This
determination will help to form a better picture of the
basic structure of our emulsion. We use fluorescence mi-
croscopy to examine the concentration of the nanopar-
ticles in water and on the surface of oil droplets in an
emulsion. This method of observation has many aspects
to explore for use in the study of Pickering emulsions.
2. MATERIALS AND EXPERIMENTAL SETUP
2.1. The Emulsion
FIG. 2: A sample of iron oxide nanoparticles in water and oil
shown as a stable Pickering emulsion.
In our experimentation we are studying a Pickering
emulsion. This emulsion uses ∼ 155 nm diameter iron
oxide (Fe3O4) nanoparticles from Professor Li as the
emulsifier in oil (hexyl-decanol 97% purity (Aldrich) un-
altered) and water. By combining a nanoparticle and
2
water solution with oil in a container and then shaking
the mixture by hand and with the vortex mixer we get
our Pickering emulsion. One sample of the emulsion is
shown in Fig. 2. The first image shows the kind of 1.5 µL
certifuge vial used to store and agitate the mixture. The
second image gets closer to show the oil (clear and at the
top of the mixture), the emulsion in the middle, and the
reddish nanoparticle water solution at the bottom. The
third image gets a little closer to focus on the droplet like
structure of the emulsion.
2.2. The Microscope
We used an Olympus FV1000 Confocal Micro-
scope to observe the fluorescently tagged iron oxide
nanoparticles in water and on the surface of an oil drop
in an emulsion of water and oil.
It was essential to keep the following settings constant
for all images in which we wish to compare observed in-
tensities. Any adjustment in these settings will either
increase or decrease the intensities observed thus affect-
ing the apparant concentration.
1. Microscope Settings Used:
HighVoltage=670, Gain=1,Offset=0
Laser Intensity=75%
100x lens, N.A. = 1.3
Image size = 320 x 320 pixels, 4 µs per pixel
AlexaFluor 488
3. DATA AND ANALYSIS
3.1. Determining the Nanoparticle Concentration
for Observed Intensities
FIG. 3: An entire intensity sweep across the vertical axis of
the slide, including just above and below the slide.
FIG. 4: Data between the peaks of the intensity observed at
the top and bottom of the slide were used for the fit (green
line).
Determining the concentration of nanoparticles from a
given intensity would seem like a straight forward mea-
surement. One simple way to measure this might be to
place a sample of known concentration under the micro-
scope and observe the intensity given off. However, when
our sample is placed on a microscope slide and under a
slide cover, the resulting intensity is very high at the bot-
tom of the slide. From there, it tapers off exponentially
at first followed by a linear decrease between the bottom
of the slide and the slide cover and then exponentially
grows again near the surface of the slide cover as shown
in Fig. 3.
We used python’s lmfit library to generate a fit to the
curve between the peaks. This fit is shown in Fig. 4.
The fit yielded the following equation that describes the
exponential decay, linear fall off, and exponential growth
of the samples distribution between the slide and the slide
cover:
1
A
C1e
−t
τ
+ C2 + C3t
+ C4e
t
τ2
−C5
.
(1)
Where C1 = 239.971010, τ = 8.41189475, C2 =
329.409672, C3 = -0.11541388, C4 = 1644.68890, C5 = -
38.0137081, and τ2 = 11.6611122 (the associated fit error
still needs to be evaluated here).
To address the parameter A we need to discuss the
benefits of normalizing this function. If we assume that
intensity observed in a sample of a given volume scales
directly with the number of nanoparticles present in the
given volume, we can relate the area under the curve de-
scribed by Equation (1) to the number of nanoparticles
3
present in the total volume of the sample observed or any
subunit of the volume within the gradient. To accomplish
this first, we integrate over the total function from slice
0 to 409 of Fig. 4 and set that equal to one (to represent
100 % of the nanoparticles in the total volume), which
gives us A = 128107.933222337. As the volume scales
directly with the number of nanoparticles in a mixture
where the nanoparticles are evenly spread, we can make
the argument that in a sample that has the nanoparti-
cles evenly distributed through the water we expect to
see the same ratio for one part of volume compared to
the whole volume as the subset of nanoparticle present
in that partial volume compared to the total number of
nanoparticles in the total volume. So for example - using
the aforementioned argument - for a 1.5 µm x 10 µm x 10
µm volume sampled from a total volume of 20.45 µm x
10 µm x 10 µm in which the nanoparticles are evenly dis-
tributed, we expect to see 7.3 % of the total nanoparticles
to be present in that 1.5 µm x 10 µm x 10 µm sample
of the evenly distributed nanoparticle solution. In the
gradient distribution of particles under the slide there is
only one place in which a sample volume of 1.5 µm x 10
µm x 10 µm will contain 7.3 % of the total nanoparticles.
That place is found where the area under the curve over
our fitted function over 1.5 µm (which corresponds to 30
slices) is equal to .073. This is found for slices 125-155
and the value of integrating over slice 125-155 over our
function is .073. Therefore, we take the intensity found
in this range of slices to be the intensity that corresponds
to the concentration of the sample, which for us was 50%
diluted from stock and from this general idea now any
intensity can be mapped to a concentration through the
curve of the gradient distribution (given that the settings
on the microscope listed in the experimental setup sec-
tion remain constant).
We found that most of the middle region is roughly the
same concentration of the original sample. So long as one
stays away from the peaks, a ballpark concentration value
for the intensity can be obtained. However, even in the
linear fall off section the concentration over 10 slides from
50-60 contains 2.52% of the total nanoparticles and the
same sample volume over 350-360 contains 2.26% of the
total nanoparticles. This is gives about a 10% difference
in the number of nanoparticles in the sample volume and
therefore about a 10% difference in the intensity observed
- not trivial!
3.2. Oil Droplet Surface Concentrations
We present summary Table I with a sampling of ob-
served surface concentrations on droplets in emulsions of
varying nanoparticle concentrations in water. The re-
sults appear to fluctuate for unknown reasons. To ob-
tain reliable and reproducible intensities for use with our
concentration to intensity mapping obtained earlier, we
need to understand some of the reasons we see fluctua-
tions across images in the same sample or how a sample
TABLE I: Oil drop surface concentrations observed over a
range of nanoparticle concentrations in water.
Solution Radius Intensity Ratio: Surface/Bulk
25 %a
∼ 70 µm ∼ 500/340 = 1.5
40 %a
∼ 15 µm ∼ 1050/250 = 4.2
50 %a
∼ 32 µm ∼ 350/240 = 1.5
50 %a
∼ 35 µm ∼ 700/275 = 2.5
60 %a
∼ 38 µm ∼ 1000/300 = 3.3
60 %a
∼ 72 µm ∼ 1250/800 = 1.6
70 %a
∼ 38 µm ∼ 425/275 = 1.5
80 %b
∼ 50 µm ∼ 700/350 = 2.0
aOil in Water Droplet
bWater in Oil Droplet
of lower concentration can give higher intensity values
in the bulk. The bulk is the water surrounding the oil
droplet, intensities are obtained for the bulk after the
sharp drop of the peaks corresponding to the surface of
the droplets as shown in Section 5.1.
3.3. Concentrations at the Oil and Water Interface
The concentrations seen in Table II at the interface
across various emulsions with different nanoparticle con-
centrations exhibit a peak although the error associated
with these observations needs to be addressed. This pos-
sible trend suggests that the nanoparticle concentration
may be highest at the interface when using 40-60% stock
nanoparticle concentrations in our emulsions. This might
be related to the stability of an emulsion as we observe
that our most stable emulsions are also in that range.
However, our error is unknown here, this is a small sam-
pling, and we need more data before this can really be
analyzed.
TABLE II: Oil and water interface concentrations observed
over a range of nanoparticle concentrations in water.
Solution Intensity Ratio: Interface/Bulk
10 % ∼ 625/240 = 2.6
20 % ∼ 1575/225 = 7
30 % ∼ 875/250 = 3.5
40 % ∼ 1550/300 = 5.2
50 % ∼ 2100/400 = 5.4
60 % ∼ 2100/400 = 5.4
70 % ∼ 1050/425 = 2.5
80 % ∼ 1100/350 = 3.1
90 % ∼ 1150/325 = 3.5
100 % ∼ 1000/300 = 3.3
4
3.4. Vertical Axis Drift
There is also an issue with maintaining our vertical
position while observing the sample on the slide at the
microscope. The vertical zero point (the brightest point
in the vertical sweep of the silde) seems to drift as we take
time averaged depth scans and moving in the horizontal
plane across the slide most noticeably. This may be due
to the oil on the objective touching the bottom of the
slide while observing. We should repeat our experiments
with the 60x objective lens as the working distance is
larger and we will be able to avoid having the oil between
the lens and the slide touch.
4. CONCLUSIONS
The gradient distribution of particles within the slide
seems promising as a method of determining an intensity
to concentration relationship for our observations. To ob-
tain intensities of surface concentrations that can be used
with this mapping is a little more difficult. The images
have variations that are not well understood to us at this
time. Potential sources of systematic error that come
along with taking images with the microscope (profile
drop off) as well as issues with fluctuations in the bulk
and at the surfaces of the droplet need to be explored
further. Sometimes when moving through a sample the
overall intensity of the bulk varies quite drastically and
we are not sure why. There are many small projects that
can be investigated within this broad sweep of explor-
ing the surface concentration of oil droplets (or water in
oil droplet) in our Pickering emulsion. The method for
mapping intensity to concentration could be improved by
addressing the peaks more closely - the thickness of the
peaks needs to be accounted for and the model adjusted
accordingly. Oil droplets across on sample should be an-
alyzed looking at different factors such as position in the
slide and radius of the bubble as compared to intensity.
The interface concentration experiment should be done
multiple times to establish a trend and see if the 40-60%
really is the highest interface concentration to bulk ratio
or if the error in our observations is really just that high.
5
5. RAW IMAGES AND INTENSITY PROFILES
5.1. Emulsion Droplets Intensities
6
6. INTERFACE INTENSITIES
7
8

More Related Content

What's hot

Surfactant used in cosmetics.
Surfactant used in cosmetics. Surfactant used in cosmetics.
Surfactant used in cosmetics.
SanketPawar47
 
Perfumes
PerfumesPerfumes
Perfumes
Alisha Bansal
 
Surfactants and their applications in pharmaceutical dosage form
Surfactants and their applications in pharmaceutical dosage formSurfactants and their applications in pharmaceutical dosage form
Surfactants and their applications in pharmaceutical dosage form
Muhammad Jamal
 
Cosmetics
CosmeticsCosmetics
Cosmetics
viveg22
 
Emulsions
EmulsionsEmulsions
Emulsions
AmeerHamza395
 
Cyclodextrine
CyclodextrineCyclodextrine
Cyclodextrine
Sagar Savale
 
Semi solid dosage forms
Semi solid dosage formsSemi solid dosage forms
Semi solid dosage forms
Iqra Zulfiqar Ali Rajput
 
Drug excipient compatibility studies
Drug excipient compatibility studiesDrug excipient compatibility studies
Drug excipient compatibility studies
Vaishnavi pandya
 
Instability of emulsion
Instability of emulsionInstability of emulsion
Instability of emulsion
Shaikh Alam
 
Spf
SpfSpf
Emulsions
EmulsionsEmulsions
Emulsion
EmulsionEmulsion
Emulsion
Amit M Gupta
 
Excipient interaction sb
Excipient interaction sbExcipient interaction sb
Excipient interaction sb
Mirza Salman Baig
 
Liposomes- The controlled drug delivery system
Liposomes- The controlled drug delivery systemLiposomes- The controlled drug delivery system
Liposomes- The controlled drug delivery system
Pranjali Mahajan
 
FORMULATION AND EVALUATION OF COSMETIC PRODUCTS
FORMULATION AND EVALUATION OF COSMETIC PRODUCTSFORMULATION AND EVALUATION OF COSMETIC PRODUCTS
FORMULATION AND EVALUATION OF COSMETIC PRODUCTS
KMCH COLLEGE OF PHARMACY
 
semisolid dosage form-2
semisolid dosage form-2semisolid dosage form-2
semisolid dosage form-2
Arshad Khan
 
Chemistry of some cosmetics
Chemistry of some cosmeticsChemistry of some cosmetics
Chemistry of some cosmetics
Dr. Tanuja Nautiyal
 
Semisolid ppt
Semisolid pptSemisolid ppt
Semisolid ppt
Pooja Sadgir
 
Skin cream
Skin creamSkin cream
Skin cream
PramodSarraf
 
Surfactant
SurfactantSurfactant
Surfactant
Sagar Savale
 

What's hot (20)

Surfactant used in cosmetics.
Surfactant used in cosmetics. Surfactant used in cosmetics.
Surfactant used in cosmetics.
 
Perfumes
PerfumesPerfumes
Perfumes
 
Surfactants and their applications in pharmaceutical dosage form
Surfactants and their applications in pharmaceutical dosage formSurfactants and their applications in pharmaceutical dosage form
Surfactants and their applications in pharmaceutical dosage form
 
Cosmetics
CosmeticsCosmetics
Cosmetics
 
Emulsions
EmulsionsEmulsions
Emulsions
 
Cyclodextrine
CyclodextrineCyclodextrine
Cyclodextrine
 
Semi solid dosage forms
Semi solid dosage formsSemi solid dosage forms
Semi solid dosage forms
 
Drug excipient compatibility studies
Drug excipient compatibility studiesDrug excipient compatibility studies
Drug excipient compatibility studies
 
Instability of emulsion
Instability of emulsionInstability of emulsion
Instability of emulsion
 
Spf
SpfSpf
Spf
 
Emulsions
EmulsionsEmulsions
Emulsions
 
Emulsion
EmulsionEmulsion
Emulsion
 
Excipient interaction sb
Excipient interaction sbExcipient interaction sb
Excipient interaction sb
 
Liposomes- The controlled drug delivery system
Liposomes- The controlled drug delivery systemLiposomes- The controlled drug delivery system
Liposomes- The controlled drug delivery system
 
FORMULATION AND EVALUATION OF COSMETIC PRODUCTS
FORMULATION AND EVALUATION OF COSMETIC PRODUCTSFORMULATION AND EVALUATION OF COSMETIC PRODUCTS
FORMULATION AND EVALUATION OF COSMETIC PRODUCTS
 
semisolid dosage form-2
semisolid dosage form-2semisolid dosage form-2
semisolid dosage form-2
 
Chemistry of some cosmetics
Chemistry of some cosmeticsChemistry of some cosmetics
Chemistry of some cosmetics
 
Semisolid ppt
Semisolid pptSemisolid ppt
Semisolid ppt
 
Skin cream
Skin creamSkin cream
Skin cream
 
Surfactant
SurfactantSurfactant
Surfactant
 

Viewers also liked

Smedds
SmeddsSmedds
2 the kinetic of emulsion polymerisation
2 the kinetic of emulsion polymerisation2 the kinetic of emulsion polymerisation
2 the kinetic of emulsion polymerisation
AdzagaAnton
 
SELF MICRO EMULSIFYING DRUG DELIVERY SYSTEM [SMEDDS]
     SELF MICRO EMULSIFYING DRUG DELIVERY   SYSTEM [SMEDDS]     SELF MICRO EMULSIFYING DRUG DELIVERY   SYSTEM [SMEDDS]
SELF MICRO EMULSIFYING DRUG DELIVERY SYSTEM [SMEDDS]
Sagar Savale
 
Smedds seminaaar final
Smedds seminaaar finalSmedds seminaaar final
Smedds seminaaar final
Shivaram
 
Self emulsifying drug delivery systems
Self emulsifying drug delivery systemsSelf emulsifying drug delivery systems
Self emulsifying drug delivery systems
Mayur Patil
 
Self Micro Emulsifying Drug Delivery System
Self Micro Emulsifying Drug Delivery SystemSelf Micro Emulsifying Drug Delivery System
Self Micro Emulsifying Drug Delivery System
Sagar Savale
 
Self Emulsifying Drug Delivery System (SEDDS)
Self Emulsifying Drug Delivery System (SEDDS)Self Emulsifying Drug Delivery System (SEDDS)
Self Emulsifying Drug Delivery System (SEDDS)
Ashutosh Panke
 
Polymeric nanoparticles A Novel Approach
Polymeric nanoparticles  A Novel ApproachPolymeric nanoparticles  A Novel Approach
Polymeric nanoparticles A Novel Approach
shivamthakore
 
PVAc
PVAcPVAc
Polymerization techniques
Polymerization techniquesPolymerization techniques
Polymerization techniques
Santosh Damkondwar
 
Aerosols
AerosolsAerosols
Aerosols
Revathi Reddy
 
Polymers
PolymersPolymers
Polymers
sportymaaz
 
Polymer Course
Polymer CoursePolymer Course
Polymer Course
guest32ca93
 

Viewers also liked (13)

Smedds
SmeddsSmedds
Smedds
 
2 the kinetic of emulsion polymerisation
2 the kinetic of emulsion polymerisation2 the kinetic of emulsion polymerisation
2 the kinetic of emulsion polymerisation
 
SELF MICRO EMULSIFYING DRUG DELIVERY SYSTEM [SMEDDS]
     SELF MICRO EMULSIFYING DRUG DELIVERY   SYSTEM [SMEDDS]     SELF MICRO EMULSIFYING DRUG DELIVERY   SYSTEM [SMEDDS]
SELF MICRO EMULSIFYING DRUG DELIVERY SYSTEM [SMEDDS]
 
Smedds seminaaar final
Smedds seminaaar finalSmedds seminaaar final
Smedds seminaaar final
 
Self emulsifying drug delivery systems
Self emulsifying drug delivery systemsSelf emulsifying drug delivery systems
Self emulsifying drug delivery systems
 
Self Micro Emulsifying Drug Delivery System
Self Micro Emulsifying Drug Delivery SystemSelf Micro Emulsifying Drug Delivery System
Self Micro Emulsifying Drug Delivery System
 
Self Emulsifying Drug Delivery System (SEDDS)
Self Emulsifying Drug Delivery System (SEDDS)Self Emulsifying Drug Delivery System (SEDDS)
Self Emulsifying Drug Delivery System (SEDDS)
 
Polymeric nanoparticles A Novel Approach
Polymeric nanoparticles  A Novel ApproachPolymeric nanoparticles  A Novel Approach
Polymeric nanoparticles A Novel Approach
 
PVAc
PVAcPVAc
PVAc
 
Polymerization techniques
Polymerization techniquesPolymerization techniques
Polymerization techniques
 
Aerosols
AerosolsAerosols
Aerosols
 
Polymers
PolymersPolymers
Polymers
 
Polymer Course
Polymer CoursePolymer Course
Polymer Course
 

Similar to PickeringEmulsionWriteUp

Uv vis spectroscopy practical.
Uv vis spectroscopy practical.Uv vis spectroscopy practical.
Uv vis spectroscopy practical.
Salum Mkata
 
Introduction Part Precision Measurements using Spectroscopy Aim.pdf
Introduction Part Precision Measurements using Spectroscopy Aim.pdfIntroduction Part Precision Measurements using Spectroscopy Aim.pdf
Introduction Part Precision Measurements using Spectroscopy Aim.pdf
bkbk37
 
Infrared spectroscopy
Infrared spectroscopyInfrared spectroscopy
Infrared spectroscopy
RupaliRaval
 
Honors SPECTROPHOTOMETRY
Honors SPECTROPHOTOMETRYHonors SPECTROPHOTOMETRY
Honors SPECTROPHOTOMETRY
David Teuscher
 
REU Poster_Meaghan,Mitch
REU Poster_Meaghan,MitchREU Poster_Meaghan,Mitch
REU Poster_Meaghan,Mitch
Meaghan Crowley
 
401 expt2 revamp this
401 expt2  revamp this401 expt2  revamp this
401 expt2 revamp this
Dr Robert Craig PhD
 
CHEM250 Analytical Chemistry.docx
CHEM250 Analytical Chemistry.docxCHEM250 Analytical Chemistry.docx
CHEM250 Analytical Chemistry.docx
write31
 
Ai ch e j1, 264-wilke-chang
Ai ch e j1, 264-wilke-changAi ch e j1, 264-wilke-chang
Ai ch e j1, 264-wilke-chang
Jonathan Molina
 
DESIGNING A LOW COST PORTABLE VIS SPECTROMETER
DESIGNING A LOW COST PORTABLE VIS SPECTROMETERDESIGNING A LOW COST PORTABLE VIS SPECTROMETER
DESIGNING A LOW COST PORTABLE VIS SPECTROMETER
Rajat Nag
 
Rigaku journal xrf
Rigaku journal xrfRigaku journal xrf
Rigaku journal xrf
hashimually1
 
Modelling deposition and resuspension of aerosols in an Euler/Euler approach
Modelling deposition and resuspension of aerosols in an Euler/Euler approachModelling deposition and resuspension of aerosols in an Euler/Euler approach
Modelling deposition and resuspension of aerosols in an Euler/Euler approach
FLUIDIAN
 
Micellar aggregation number
Micellar aggregation numberMicellar aggregation number
Micellar aggregation number
UNIVERSIDAD AUTONOMA DE CHIHUAHUA
 
Spectrophotometry Lecture
Spectrophotometry LectureSpectrophotometry Lecture
Spectrophotometry Lecture
ouopened
 
Uv visible-spectroscopy-6500 (3)
Uv visible-spectroscopy-6500 (3)Uv visible-spectroscopy-6500 (3)
Uv visible-spectroscopy-6500 (3)
PromilaThakur4
 
LaSiGMA_Poster-Ethan , Divya
LaSiGMA_Poster-Ethan , DivyaLaSiGMA_Poster-Ethan , Divya
LaSiGMA_Poster-Ethan , Divya
Ethan Sullivan
 
Spectrophotometry lecture
Spectrophotometry lectureSpectrophotometry lecture
Spectrophotometry lecture
Cody Taylor
 
Microwave emission and scattering of foam
Microwave emission and scattering of foamMicrowave emission and scattering of foam
Microwave emission and scattering of foam
Roopam Poddar
 
Analical chemistry ok1294986152
Analical chemistry  ok1294986152Analical chemistry  ok1294986152
Analical chemistry ok1294986152
Navin Joshi
 
ChE4050_FinalReport_Diffusion
ChE4050_FinalReport_DiffusionChE4050_FinalReport_Diffusion
ChE4050_FinalReport_Diffusion
Tess Gerber
 
Final presentation2
Final presentation2Final presentation2
Final presentation2
Kumar Avinash
 

Similar to PickeringEmulsionWriteUp (20)

Uv vis spectroscopy practical.
Uv vis spectroscopy practical.Uv vis spectroscopy practical.
Uv vis spectroscopy practical.
 
Introduction Part Precision Measurements using Spectroscopy Aim.pdf
Introduction Part Precision Measurements using Spectroscopy Aim.pdfIntroduction Part Precision Measurements using Spectroscopy Aim.pdf
Introduction Part Precision Measurements using Spectroscopy Aim.pdf
 
Infrared spectroscopy
Infrared spectroscopyInfrared spectroscopy
Infrared spectroscopy
 
Honors SPECTROPHOTOMETRY
Honors SPECTROPHOTOMETRYHonors SPECTROPHOTOMETRY
Honors SPECTROPHOTOMETRY
 
REU Poster_Meaghan,Mitch
REU Poster_Meaghan,MitchREU Poster_Meaghan,Mitch
REU Poster_Meaghan,Mitch
 
401 expt2 revamp this
401 expt2  revamp this401 expt2  revamp this
401 expt2 revamp this
 
CHEM250 Analytical Chemistry.docx
CHEM250 Analytical Chemistry.docxCHEM250 Analytical Chemistry.docx
CHEM250 Analytical Chemistry.docx
 
Ai ch e j1, 264-wilke-chang
Ai ch e j1, 264-wilke-changAi ch e j1, 264-wilke-chang
Ai ch e j1, 264-wilke-chang
 
DESIGNING A LOW COST PORTABLE VIS SPECTROMETER
DESIGNING A LOW COST PORTABLE VIS SPECTROMETERDESIGNING A LOW COST PORTABLE VIS SPECTROMETER
DESIGNING A LOW COST PORTABLE VIS SPECTROMETER
 
Rigaku journal xrf
Rigaku journal xrfRigaku journal xrf
Rigaku journal xrf
 
Modelling deposition and resuspension of aerosols in an Euler/Euler approach
Modelling deposition and resuspension of aerosols in an Euler/Euler approachModelling deposition and resuspension of aerosols in an Euler/Euler approach
Modelling deposition and resuspension of aerosols in an Euler/Euler approach
 
Micellar aggregation number
Micellar aggregation numberMicellar aggregation number
Micellar aggregation number
 
Spectrophotometry Lecture
Spectrophotometry LectureSpectrophotometry Lecture
Spectrophotometry Lecture
 
Uv visible-spectroscopy-6500 (3)
Uv visible-spectroscopy-6500 (3)Uv visible-spectroscopy-6500 (3)
Uv visible-spectroscopy-6500 (3)
 
LaSiGMA_Poster-Ethan , Divya
LaSiGMA_Poster-Ethan , DivyaLaSiGMA_Poster-Ethan , Divya
LaSiGMA_Poster-Ethan , Divya
 
Spectrophotometry lecture
Spectrophotometry lectureSpectrophotometry lecture
Spectrophotometry lecture
 
Microwave emission and scattering of foam
Microwave emission and scattering of foamMicrowave emission and scattering of foam
Microwave emission and scattering of foam
 
Analical chemistry ok1294986152
Analical chemistry  ok1294986152Analical chemistry  ok1294986152
Analical chemistry ok1294986152
 
ChE4050_FinalReport_Diffusion
ChE4050_FinalReport_DiffusionChE4050_FinalReport_Diffusion
ChE4050_FinalReport_Diffusion
 
Final presentation2
Final presentation2Final presentation2
Final presentation2
 

PickeringEmulsionWriteUp

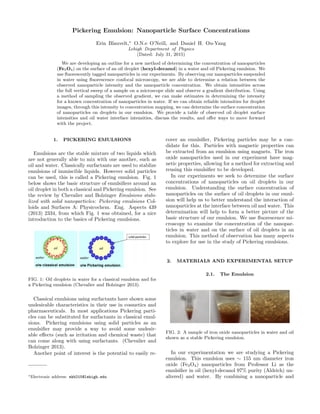
  • 1. Pickering Emulsion: Nanoparticle Surface Concentrations Erin Blauvelt,∗ O.N.e O’Neill, and Daniel H. Ou-Yang Lehigh Department of Physics (Dated: July 31, 2015) We are developing an outline for a new method of determining the concentration of nanoparticles (Fe3O4) on the surface of an oil droplet (hexyl-decanol) in a water and oil Pickering emulsion. We use fluorescently tagged nanoparticles in our experiments. By observing our nanoparticles suspended in water using fluorescence confocal microscopy, we are able to determine a relation between the observed nanoparticle intensity and the nanoparticle concentration. We obtain intensities across the full vertical sweep of a sample on a microscope slide and observe a gradient distribution. Using a method of sampling the observed gradient, we can make estimates in determining the intensity for a known concentration of nanoparticles in water. If we can obtain reliable intensities for droplet images, through this intensity to concentration mapping, we can determine the surface concentration of nanoparticles on droplets in our emulsion. We provide a table of observed oil droplet surface intensities and oil water interface intensities, discuss the results, and offer ways to move forward with the project. 1. PICKERING EMULSIONS Emulsions are the stable mixture of two liquids which are not generally able to mix with one another, such as oil and water. Classically surfactants are used to stablize emulsions of immiscible liquids. However solid particles can be used, this is called a Pickering emulsion. Fig. 1 below shows the basic structure of emulsifiers around an oil droplet in both a classical and Pickering emulsion. See the review by Chevalier and Bolzinger Emulsions stabi- lized with solid nanoparticles: Pickering emulsions Col- loids and Surfaces A: Physicochem. Eng. Aspects 439 (2013) 2334, from which Fig. 1 was obtained, for a nice introduction to the basics of Pickering emulsions. FIG. 1: Oil droplets in water for a classical emulsion and for a Pickering emulsion (Chevalier and Bolzinger 2013). Classical emulsions using surfactants have shown some undesirable characteristics in their use in cosmetics and pharmaceuticals. In most applications Pickering parti- cles can be substituted for surfactants in classical emul- sions. Pickering emulsions using solid particles as an emulsifier may provide a way to avoid some undesir- able effects (such as irritation and chemical waste) that can come along with using surfactants. (Chevalier and Bolzinger 2013). Another point of interest is the potential to easily re- ∗Electronic address: ekb215@lehigh.edu cover an emulsifier, Pickering particles may be a can- didate for this. Particles with magnetic properties can be extracted from an emulsion using magnets. The iron oxide nanoparticles used in our experiment have mag- netic properties, allowing for a method for extracting and reusing this emulsifier to be developed. In our experiments we seek to determine the surface concentrations of nanoparticles on oil droplets in our emulsion. Understanding the surface concentration of nanoparticles on the surface of oil droplets in our emul- sion will help us to better understand the interaction of nanoparticles at the interface between oil and water. This determination will help to form a better picture of the basic structure of our emulsion. We use fluorescence mi- croscopy to examine the concentration of the nanopar- ticles in water and on the surface of oil droplets in an emulsion. This method of observation has many aspects to explore for use in the study of Pickering emulsions. 2. MATERIALS AND EXPERIMENTAL SETUP 2.1. The Emulsion FIG. 2: A sample of iron oxide nanoparticles in water and oil shown as a stable Pickering emulsion. In our experimentation we are studying a Pickering emulsion. This emulsion uses ∼ 155 nm diameter iron oxide (Fe3O4) nanoparticles from Professor Li as the emulsifier in oil (hexyl-decanol 97% purity (Aldrich) un- altered) and water. By combining a nanoparticle and
  • 2. 2 water solution with oil in a container and then shaking the mixture by hand and with the vortex mixer we get our Pickering emulsion. One sample of the emulsion is shown in Fig. 2. The first image shows the kind of 1.5 µL certifuge vial used to store and agitate the mixture. The second image gets closer to show the oil (clear and at the top of the mixture), the emulsion in the middle, and the reddish nanoparticle water solution at the bottom. The third image gets a little closer to focus on the droplet like structure of the emulsion. 2.2. The Microscope We used an Olympus FV1000 Confocal Micro- scope to observe the fluorescently tagged iron oxide nanoparticles in water and on the surface of an oil drop in an emulsion of water and oil. It was essential to keep the following settings constant for all images in which we wish to compare observed in- tensities. Any adjustment in these settings will either increase or decrease the intensities observed thus affect- ing the apparant concentration. 1. Microscope Settings Used: HighVoltage=670, Gain=1,Offset=0 Laser Intensity=75% 100x lens, N.A. = 1.3 Image size = 320 x 320 pixels, 4 µs per pixel AlexaFluor 488 3. DATA AND ANALYSIS 3.1. Determining the Nanoparticle Concentration for Observed Intensities FIG. 3: An entire intensity sweep across the vertical axis of the slide, including just above and below the slide. FIG. 4: Data between the peaks of the intensity observed at the top and bottom of the slide were used for the fit (green line). Determining the concentration of nanoparticles from a given intensity would seem like a straight forward mea- surement. One simple way to measure this might be to place a sample of known concentration under the micro- scope and observe the intensity given off. However, when our sample is placed on a microscope slide and under a slide cover, the resulting intensity is very high at the bot- tom of the slide. From there, it tapers off exponentially at first followed by a linear decrease between the bottom of the slide and the slide cover and then exponentially grows again near the surface of the slide cover as shown in Fig. 3. We used python’s lmfit library to generate a fit to the curve between the peaks. This fit is shown in Fig. 4. The fit yielded the following equation that describes the exponential decay, linear fall off, and exponential growth of the samples distribution between the slide and the slide cover: 1 A C1e −t τ + C2 + C3t + C4e t τ2 −C5 . (1) Where C1 = 239.971010, τ = 8.41189475, C2 = 329.409672, C3 = -0.11541388, C4 = 1644.68890, C5 = - 38.0137081, and τ2 = 11.6611122 (the associated fit error still needs to be evaluated here). To address the parameter A we need to discuss the benefits of normalizing this function. If we assume that intensity observed in a sample of a given volume scales directly with the number of nanoparticles present in the given volume, we can relate the area under the curve de- scribed by Equation (1) to the number of nanoparticles
  • 3. 3 present in the total volume of the sample observed or any subunit of the volume within the gradient. To accomplish this first, we integrate over the total function from slice 0 to 409 of Fig. 4 and set that equal to one (to represent 100 % of the nanoparticles in the total volume), which gives us A = 128107.933222337. As the volume scales directly with the number of nanoparticles in a mixture where the nanoparticles are evenly spread, we can make the argument that in a sample that has the nanoparti- cles evenly distributed through the water we expect to see the same ratio for one part of volume compared to the whole volume as the subset of nanoparticle present in that partial volume compared to the total number of nanoparticles in the total volume. So for example - using the aforementioned argument - for a 1.5 µm x 10 µm x 10 µm volume sampled from a total volume of 20.45 µm x 10 µm x 10 µm in which the nanoparticles are evenly dis- tributed, we expect to see 7.3 % of the total nanoparticles to be present in that 1.5 µm x 10 µm x 10 µm sample of the evenly distributed nanoparticle solution. In the gradient distribution of particles under the slide there is only one place in which a sample volume of 1.5 µm x 10 µm x 10 µm will contain 7.3 % of the total nanoparticles. That place is found where the area under the curve over our fitted function over 1.5 µm (which corresponds to 30 slices) is equal to .073. This is found for slices 125-155 and the value of integrating over slice 125-155 over our function is .073. Therefore, we take the intensity found in this range of slices to be the intensity that corresponds to the concentration of the sample, which for us was 50% diluted from stock and from this general idea now any intensity can be mapped to a concentration through the curve of the gradient distribution (given that the settings on the microscope listed in the experimental setup sec- tion remain constant). We found that most of the middle region is roughly the same concentration of the original sample. So long as one stays away from the peaks, a ballpark concentration value for the intensity can be obtained. However, even in the linear fall off section the concentration over 10 slides from 50-60 contains 2.52% of the total nanoparticles and the same sample volume over 350-360 contains 2.26% of the total nanoparticles. This is gives about a 10% difference in the number of nanoparticles in the sample volume and therefore about a 10% difference in the intensity observed - not trivial! 3.2. Oil Droplet Surface Concentrations We present summary Table I with a sampling of ob- served surface concentrations on droplets in emulsions of varying nanoparticle concentrations in water. The re- sults appear to fluctuate for unknown reasons. To ob- tain reliable and reproducible intensities for use with our concentration to intensity mapping obtained earlier, we need to understand some of the reasons we see fluctua- tions across images in the same sample or how a sample TABLE I: Oil drop surface concentrations observed over a range of nanoparticle concentrations in water. Solution Radius Intensity Ratio: Surface/Bulk 25 %a ∼ 70 µm ∼ 500/340 = 1.5 40 %a ∼ 15 µm ∼ 1050/250 = 4.2 50 %a ∼ 32 µm ∼ 350/240 = 1.5 50 %a ∼ 35 µm ∼ 700/275 = 2.5 60 %a ∼ 38 µm ∼ 1000/300 = 3.3 60 %a ∼ 72 µm ∼ 1250/800 = 1.6 70 %a ∼ 38 µm ∼ 425/275 = 1.5 80 %b ∼ 50 µm ∼ 700/350 = 2.0 aOil in Water Droplet bWater in Oil Droplet of lower concentration can give higher intensity values in the bulk. The bulk is the water surrounding the oil droplet, intensities are obtained for the bulk after the sharp drop of the peaks corresponding to the surface of the droplets as shown in Section 5.1. 3.3. Concentrations at the Oil and Water Interface The concentrations seen in Table II at the interface across various emulsions with different nanoparticle con- centrations exhibit a peak although the error associated with these observations needs to be addressed. This pos- sible trend suggests that the nanoparticle concentration may be highest at the interface when using 40-60% stock nanoparticle concentrations in our emulsions. This might be related to the stability of an emulsion as we observe that our most stable emulsions are also in that range. However, our error is unknown here, this is a small sam- pling, and we need more data before this can really be analyzed. TABLE II: Oil and water interface concentrations observed over a range of nanoparticle concentrations in water. Solution Intensity Ratio: Interface/Bulk 10 % ∼ 625/240 = 2.6 20 % ∼ 1575/225 = 7 30 % ∼ 875/250 = 3.5 40 % ∼ 1550/300 = 5.2 50 % ∼ 2100/400 = 5.4 60 % ∼ 2100/400 = 5.4 70 % ∼ 1050/425 = 2.5 80 % ∼ 1100/350 = 3.1 90 % ∼ 1150/325 = 3.5 100 % ∼ 1000/300 = 3.3
  • 4. 4 3.4. Vertical Axis Drift There is also an issue with maintaining our vertical position while observing the sample on the slide at the microscope. The vertical zero point (the brightest point in the vertical sweep of the silde) seems to drift as we take time averaged depth scans and moving in the horizontal plane across the slide most noticeably. This may be due to the oil on the objective touching the bottom of the slide while observing. We should repeat our experiments with the 60x objective lens as the working distance is larger and we will be able to avoid having the oil between the lens and the slide touch. 4. CONCLUSIONS The gradient distribution of particles within the slide seems promising as a method of determining an intensity to concentration relationship for our observations. To ob- tain intensities of surface concentrations that can be used with this mapping is a little more difficult. The images have variations that are not well understood to us at this time. Potential sources of systematic error that come along with taking images with the microscope (profile drop off) as well as issues with fluctuations in the bulk and at the surfaces of the droplet need to be explored further. Sometimes when moving through a sample the overall intensity of the bulk varies quite drastically and we are not sure why. There are many small projects that can be investigated within this broad sweep of explor- ing the surface concentration of oil droplets (or water in oil droplet) in our Pickering emulsion. The method for mapping intensity to concentration could be improved by addressing the peaks more closely - the thickness of the peaks needs to be accounted for and the model adjusted accordingly. Oil droplets across on sample should be an- alyzed looking at different factors such as position in the slide and radius of the bubble as compared to intensity. The interface concentration experiment should be done multiple times to establish a trend and see if the 40-60% really is the highest interface concentration to bulk ratio or if the error in our observations is really just that high.
  • 5. 5 5. RAW IMAGES AND INTENSITY PROFILES 5.1. Emulsion Droplets Intensities
  • 7. 7
  • 8. 8