Downloaded 12 times
![In the Laboratory
94 Journal of Chemical Education • Vol. 75 No. 1 January 1998 • JChemEd.chem.wisc.edu
The aggregation numbers calculated for nC equal to 12, 14,
and 16 by eqs 1–5—that is, 55, 75, and 95, respectively—
are in very good agreement with experimental findings for
the corresponding alkylsulfate surfactants. For alkyltri-
methylammonium surfactants, however, this model predicts
an aggregation number too low for the longest surfactant.
This is due to a combination of the bulkier head-group of
this surfactant as well as a change in shape of the aggre-
gate from a spherical to a more prolate micelle. However,
the main point is that within a series of surfactants differ-
ing in hydrocarbon chain length only, the aggregation num-
ber should increase with increasing tail length.
The micellar aggregation numbers can be determined
by the method proposed by Turro and Yekta (7). According
to this model, the aggregation numbers can be calculated
by use of eqs 7 and 8:
ln
I0
IQ
=
Qmic
mic
(7)
where I0 is the emission intensity at a certain wavelength
in the absence of an added fluorescence quencher, IQ the in-
tensity at the same wavelength at quencher concentration
[Qmic], and [mic] the concentration of micelles in solution.
The average aggregation number, <a>, is related to the con-
centration of micelles, the total surfactant concentration
[Stot], and the cmc through
<a > =
Stot – cmc
mic
(8)
Equation 7 relies on certain assumptions. First, the
probes and the quenchers must be stationary in their host
micelles during a time longer than the excited state lifetime,
which means that migration of probe and quencher must
not occur. Second, the quenching must be very effective; that
is, the detected emission emanates from micelles without
quenchers only. Third, the probes and quenchers have to
have a Poissonian distribution among the micelles. The last
condition is theoretically shown to be a plausible assump-
tion for systems with small organic molecules dissolved in
micelles (8), whereas the first two conditions are not imme-
diately valid for micellar systems (9–11). Nevertheless, we
will use eqs 7 and 8 as they stand, keeping the assumptions
in mind when evaluating the experimental data.
The use of eq 7 relies also on the knowledge of the
quencher concentration in the micelles, which might be dif-
ferent from the total quencher concentration. In the case of
1,3-dicyano-benzene (DCB), [Qmic] can be set equal to the to-
tal quencher concentration, whereas this does not hold for
the alkylpyridinium quenchers.These are surfactants as well
as quenchers, which means that they also have a cmc and
thus a certain concentration in the aqueous phase.To circum-
vent this problem, we assume perfect mixing between the
quencher and the surfactant (12). In practice, this means that
we assume that an equal relative amount of the quencher is
present in the aqueous phase as for the surfactant used. The
latter can be calculated as the ratio of the cmc and the total
surfactant concentration, and this ratio was used as a cor-
rection factor, α, for the calculation of [Qmic]:
α =
cmcsurf
Stot
(9)
[Qmic] = (1 – α) [Qtot] (10)
The micelles formed by surfactants with a tail of mod-
erate length (approximately C10–C16) are thought to be
spherical or nearly spherical—at least close to the cmc. Of-
ten their structure is presented as being raspberry-like,
with the hydrophilic charged head-groups closely packed to
each other and the hydrocarbon chains stretched toward the
center of the micelle. This picture is wrong for two reasons.
First, owing to the electrostatic repulsion it is not possible to
spontaneously pack up to a hundred charged entities close
to each other, even if the counter-ion binding is taken into
account. Second, the conformation of all tails being
stretched straight toward the center would lead to an enor-
mous local pressure. As an example, Cabane showed in an
NMR study that the micelles formed by the well-known sur-
factant sodium dodecylsulfate (SDS) have about 1/3 of their
surface covered by the hydrophilic head-groups, and the re-
maining 2/3 of the surface covered by hydrocarbon tails (13).
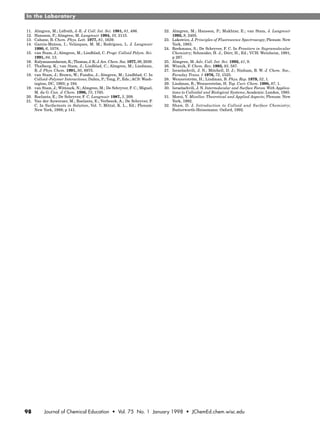
A more realistic picture of a micelle is given in Figure 1,
where it can be seen that the surface is composed of ionic
head-groups, hydrophobic hydrocarbon tails, and counter-
ions.
As a consequence of the preceding discussion, we can
conclude the following: (i) surfactants with longer tails will
have a lower cmc and a larger aggregation number than
analogues with shorter tails; (ii) adding salt to an ionic mi-
cellar solution will decrease the cmc and increase the ag-
gregation number owing to the screened electrostatic repul-
sion; (iii) counterions that are more strongly bound to the
surfactant will induce a lower cmc and a higher aggrega-
tion number; and (iv) owing to the amphiphilic character of
the micellar surface, it can interact with both hydrophilic
and hydrophobic species dissolved in the aqueous bulk.
In this laboratory experiment, only points (i) and (ii)
above will be explored. The determination of the cmc’s, how-
ever, can be regarded as an optional extension if time and
interest permit. There are several suitable ways to deter-
mine the cmc of a surfactant—for example, using absor-
bance measurements (1), fluorescence intensity of a dis-
solved probe (2), conductometry (14, 15), and pyrene emis-
sion vibronic fine structure (16–19).
If one wants to determine the different cmc’s, we sug-
gest that a method where either no probe molecule is used
(conductometry) or the same fluorescent probe as in the de-
termination of the aggregation numbers (pyrene vibronic
fine structure method) is utilized.
Materials
The following surfactants were examined: SDS (from
BDH, specially pure), DoTAB (dodecyltrimethylammonium
bromide, from Aldrich), TTAC (tetradecyltrimethyl-
ammonium chloride, from TCI), and CTAB (cetyltrimethyl-
ammonium bromide, from ACROS Janssen). CAUTION:
These products are harmful if inhaled. Pyrene was used as
fluorescent probe (from ACROS Janssen, twice recrystal-
lized from absolute ethanol). CAUTION: Pyrene is a poten-
tial carcinogen. The following fluorescence quenchers were
used: DCB (1,3-dicyanobenzene, from ACROS Janssen),
DoPyrCl (dodecylpyridinium chloride, from Aldrich), TPyrCl
(tetradecylpyridinium chloride, from Henkel), and CPyrCl
(cetylpyridinium chloride, from Merck). NaCl (sodium chlo-
ride, from Aldrich, ultra pure) was used as the added salt.
Experimental Procedure
The solutions for the determinations of the micellar
aggregation numbers were prepared as follows. From a](https://image.slidesharecdn.com/micellaraggregationnumber-160304060934/85/Micellar-aggregation-number-2-320.jpg)
![In the Laboratory
JChemEd.chem.wisc.edu • Vol. 75 No. 1 January 1998 • Journal of Chemical Education 95
stock solution of 0.1 mM pyrene in absolute ethanol, a
known volume was pipetted into a volumetric flask. The
ethanol was evaporated and distilled water added, and the
solution was stirred overnight. The final pyrene concentra-
tion was 1–2 µM. From the aqueous pyrene solution, the
surfactant stock solutions were prepared with surfactant
concentrations well above the respective cmc’s.
The quenchers were similarly dissolved in absolute
ethanol. From these solutions, quencher stock solutions
were prepared by pipetting a known volume of the ethanolic
quencher solution into a volumetric flask, evaporating the
ethanol, and dissolving the quencher in the surfactant/
pyrene stock solution. The quencher concentrations in these
solutions were equal to the maximum quencher concentra-
tions measured, which were calculated to give approxi-
mately one quencher molecule per micelle for each surfac-
tant system. By mixing the surfactant/pyrene stock with-
out quencher and the surfactant/pyrene stock with quencher
in known proportions, five or six solutions varying in
quencher concentration from zero to the maximum concen-
tration were prepared.
The emission spectra of these solutions were recorded
and the logarithm of the intensity ratio I0/IQ at a specific
wavelength within the spectral emission range was plotted
against the quencher concentration, according to eq 7. This
plot should yield a straight line through the origin with a
slope equal to 1/[mic]. Multiplying the slope by the concen-
tration of surfactant molecules participating in micelle for-
mation (i.e., [Stot] – cmc) gives the aggregation number ac-
cording to eq 8. We have chosen to use the intensity of band
III in the pyrene emission spectrum—the emission peak at
approximately 383 nm—to avoid scattering problems, which
could occur if the intensity of band I (at 372 nm) was used.
The emission spectra were recorded in the right-angle
signal-to-reference mode on a SPEX Fluorolog 1680 instru-
ment combined with a SPEX Spectroscopy Laboratory Co-
ordinator DM1B. The slits used gave a bandwidth of ap-
proximately 2 nm and the excitation wavelength was 320
nm. This excitation wavelength was chosen instead of the
absorption maximum of pyrene, around 337 nm, because the
latter might lead to disturbing Raman scattering superim-
posed on the emission spectra. All measurements were per-
formed at room temperature. All graphics and calculations
were performed on a Macintosh Performa 5200 PowerPC
within the framework of KaleidaGraph 3.0 (©
Abelbeck Soft-
ware).
Results and Discussion
Critical Micelle Concentration
The cmc’s of the different systems investigated were
determined with the pyrene emission vibronic fine struc-
ture method (16-19). The results are summarized in Table
1 together with literature values. If one chooses not to per-
form this part of the laboratory experiment, the literature
values can be given as a priori information to the students.
The results show that adding a salt to the SDS system
lowers the cmc substantially. Furthermore, the cmc deter-
minations of the different alkyltrimethylammonium surfac-
tants show that an increasing hydrocarbon tail length in-
deed lowers the cmc for surfactants of the same kind.
Micellar Aggregation Numbers
SDS with and without Added NaCl
Two quenchers were used in the salt-free system, DCB
and DoPyrCl, whereas only DoPyrCl was employed for the
system with added NaCl. Spectra were recorded at several
quencher concentrations (Fig. 2). Good fits of eq 7 and con-
sistent aggregation numbers were obtained in all cases (Fig.
3 and Table 2). Adding NaCl caused an increase in micelle
volume, as expected. This is due to the higher ionic strength
of the system, screening the electrostatic interactions. With
a decreased electrostatic repulsion between the charged
head-groups of SDS, it is possible to pack the surfactant
head-groups closer to each other, with a subsequent in-
crease in aggregation number. The same could be obtained
by simply increasing the SDS concentration. The latter,
however, is much less pronounced and will only be observed
at rather high SDS concentrations.
detagitsevnIsmetsySrofCMCfoseulaV.1elbaT
metsyS
)Mm(noitartnecnoCCMC
tropeRsihT a erutaretiL feR
SDS 6.7 8 2
lCaNMm022+SDS 9.0 Ϸ 1 81
BAToD 6.61 5.51 22
CATT 0.4 3.4 02
BATC 7.0 8.0 22
a Values in this column are cmc’s determined by students using the
pyrene emission vibronic fine structure method (16–19 ).
Figure 2. Steady-state emission spectra of pyrene in SDS micelles
at different DoPyrCl concentrations (see inserted legend), in the ab-
sence of added NaCl (top) and with 220 mM NaCl added (bottom).](https://image.slidesharecdn.com/micellaraggregationnumber-160304060934/85/Micellar-aggregation-number-3-320.jpg)
![In the Laboratory
96 Journal of Chemical Education • Vol. 75 No. 1 January 1998 • JChemEd.chem.wisc.edu
Alkyltrimethylammonium Halides with Different
Hydrocarbon Tail Lengths
The part treating the CnTA+
halides (n = 12, 14, 16) is
a good example of the need to take both photochemical fea-
tures and model requirements into account when employ-
ing a given model.
To begin with, the same quenchers used for the SDS
systems were employed to determine the aggregation num-
ber of DoTAB. From the quality of the fits of eq 7 to data
(Fig. 4), one would conclude that both quenchers result in a
fluorescence quenching according to the Turro–Yekta model
(7). Comparing the calculated aggregation numbers, how-
ever, shows that DCB yields a much lower <a> than
DoPyrCl. Evidently, there is a discrepancy between the ag-
gregation number obtained from the measurements with
DCB and the literature values (Table 3), whereas DoPyrCl
yields aggregation numbers in excellent agreement with the
literature. Even without knowing the literature values, one
can use eqs 1–5 to judge the results. For DCB, the discrep-
ancy between experimental data (34) and model (55) is al-
most 40%. If we conclude that something is wrong with the
former value, we also have to answer the following ques-
tion: why does DCB not work well in the DoTAB system,
whereas it could be used in the SDS system?
The explanation is that DCB acts as an electron accep-
tor, causing a subsequent attraction between the DCB an-
ionic radical and the cationic surfactant head-groups. When
performing time-resolved fluorescence quenching measure-
ments, this is not a problem, and DCB can be used as
quencher (20, 21), as the electron captured by the DCB mol-
ecule will return to the donor (pyrene) before the next excita-
tion event. Under continuous excitation, however, the
charge transfer has a disastrous impact, as it creates a con-
stant amount of negatively charged DCB
radicals. First, the effective quencher
concentration will be lowered, because
part of the quenchers will be “bound” to
the surfactant head-groups instead of
being able to freely diffuse in the micelle.
Second, even those DCB molecules that
are not so strongly attracted by the cat-
ionic ammonium groups will diffuse more
slowly owing to electrostatic attraction.
This violates one of the assumptions nec-
essary for the use of eq 7, namely, that
the quenching must be very fast and ef-
ficient. None of this would be a problem
if the plots according to eq 7 clearly
showed that the model is invalid in
these systems, but this is not the case.
The plot according to eq 7 when using
DCB as a quencher in the DoTAB-sys-
tem yields a straight line through the
origin, but with a slope giving a much
too low aggregation number when used
in eq 8.
Using alkylpyridinium salts as
quenchers offers an alternative, but with
some difficulties. First, the effective
quencher concentration in the micelles,
[Qmic], has to be calculated from the to-
tal quencher concentration, [Qtot], by eqs
9 and 10. As can be seen from Figure 4
tnatcafruSsaSDShtiwsmetsySfosrebmuNnoitagerggA.2elbaT
metsyS <rebmuNnoitagerggA a >
feR]SDS[
)Mm(
]lCaN[
)Mm(
rehcneuQ tropeRsihT erutaretiL yroehT a
36 0 BCD 85 56–06 55 7
16 0 lCryPoD 56 56–06 55 7
06 022 lCryPoD 301 Ϸ 001 – 81
a Values in this column were calculated by the semi-empirical model leading
to eqs 1–6.
Figure 4. Plot according to eq 7 for the DoTAB system. : DoTAB
with DCB as quencher; ᭜: DoTAB with DoPyrCl as quencher.
CQ (mM)
ln(I0/IQ)
Figure 3. Plot according to eq 7 for the SDS system. : SDS with
DCB as quencher; ᭡: SDS with DoPyrCl as quencher; ᭜: SDS +
220 mM NaCl with DoPyrCl as quencher.
CQ (mM)
ln(I0/IQ)
stlaSmuinommalyhtemirtlyklAhtiwsmetsySfosrebmuNnoitagerggA.3elbaT
stnatcafruSsa
metsyS <rebmuNnoitagerggA a >
feRtnatcafruS
rehcneuQ tropeRsihT erutaretiL yroehT a
dnuopmoC )Mm(.cnoC
BAToD 57 BCD 43 56–55 55 22
BAToD 27 lCryPoD 46 56–55 55 22
CATT 101 lCryPoD 15 07 57 02
CATT 73 lCryPT 85 56–06 57 02
BATC 101 lCryPoD 16 041 59 22
BATC 53 lCryPC 14 001 59 02
a Values in this column were calculated by the semi-empirical model leading to eqs 1–6.](https://image.slidesharecdn.com/micellaraggregationnumber-160304060934/85/Micellar-aggregation-number-4-320.jpg)
![In the Laboratory
JChemEd.chem.wisc.edu • Vol. 75 No. 1 January 1998 • Journal of Chemical Education 97
Figure 5. Plot according to eq 7 for the TTAC system. : TTAC
with DoPyrCl as quencher; ᭜: TTAC with TPyrCl as quencher.
CQ (mM)
ln(I0/IQ)
Figure 6. Plot according to eq 7 for the CTAB system. : CTAB
with DoPyrCl as quencher; ᭜: CTAB with CPyrCl as quencher.
CQ (mM)
ln(I0/IQ)
and Table 3, DoPyrCl works out very well as a quencher in
the DoTAB system. The results are in good accord with the
literature values, and students can judge the obtained re-
sults as satisfactory by eqs 1–5.
When DoPyrCl is applied as quencher in the TTAC sys-
tem, however, it yields too low an aggregation number. In
this case, the conflict is due to our assumption that the mix-
ing of the surfactant and the quencher is ideal. Such an as-
sumption will hold only if the values of the cmc’s of the
quencher and the surfactant are similar and, consequently,
it does not hold if the lengths of the quencher and surfac-
tant hydrophobic tails differ. In the present case, the real
[Qmic] is much lower than the one calculated from eqs 9 and
10. Again, the plot of eq 7 does not reveal this anomaly be-
cause a straight line through the origin is obtained (Fig. 5),
but the obtained aggregation number again is much lower
than what could be predicted from eqs 1–5, and the students
should be able to disregard this result. The use of the
quencher TPyrCl should solve this problem, because it can
be assumed that TPyrCl mixes ideally with TTAC. Indeed,
TPyrCl yields a good aggregation number for TTAC (Table 3),
illustrating the necessity of knowing the real [Qmic].
Finally, applying DoPyrCl in the CTAB systems results
in too low an aggregation number for the same reason that
it failed in the TTAC system. Trying to circumvent the prob-
lem with nonideal mixing by using the quencher CPyrCl,
however, does not work (see Table 3), even though the fit of
eq 7 is good (Fig. 6). This is because CTAB micelles do not
conform to one of the assumptions for eq 7: that the quench-
ing process is very effective. For such a bulky quencher in
large CTAB micelles, the diffusion toward an excited probe
molecule is too slow to assure complete quenching in all mi-
celles containing both an excited probe and a quencher mol-
ecule. The plots of eq 7 yield straight lines through the ori-
gin both for DoPyrCl and CPyrCl (Fig. 6), but with aggre-
gation numbers much lower than would be expected from
eqs 1–5.
Conclusions
The use of fluorescence techniques to determine critical
micelle concentrations and aggregation numbers for surfac-
tant micelles offers the possibility to introduce photophysics,
spectroscopy, and microheterogeneous supramolecular sys-
tems to chemistry students. The methodology works well in
the systems investigated, but must be applied with care.
Using fluorescence quenching uncritically to determine ag-
gregation numbers will result in a severe underestimation
of these numbers in several cases—for example, when the
underlying assumptions for the equations used are violated.
Such an unfavorable situation can, however, be used peda-
gogically in discussing the results and helps to explain to
the students that they have to be aware of both chemical
and physical aspects of a system under investigation. It is
possible for students to use a semi-empirical model to judge
their results and the discrepancies between experimental
data and model can be rationalized if taking the underlying
physical assumptions of the model into account.
Acknowledgments
We thank the fourth-year students who performed
most of the measurements presented here: Joris Baele,
Davy Briers, Joke Creuwels, and Jan De Rudder.
Notes
1. We would stress the need of a thorough introduction to
photophysics before students start the practical work. It is, however,
beyond the scope of this contribution to treat that part. Interested
readers will find sufficient information in the literature (9, 23–26).
2. Surfactants and micelles have been extensively discussed
in the literature. Only the major concepts related to the micellar
aggregation number are discussed in this paper. Readers inter-
ested in a more thorough discussion and presentation of the mi-
cellar aggregation phenomenon can consult some excellent ar-
ticles and books (5, 27–32).
Literature Cited
1. Furton, K. G.; Norelus, A. J. Chem. Educ. 1993, 70, 254.
2. Goodling, K.; Johnson, K.; Lefkowitz, L.; Williams, B. W. J. Chem.
Educ. 1994, 71, A8.
3. Rodríguez Prieto, M. F.; Ríos Rodríguez, M. C.; Mosquera González,
M.; Ríos Rodríguez, A. M.; Mejuto Fernández, J. C. J. Chem. Educ.
1995, 72, 662.
4. Nagarajan, R.; Ruckenstein, E. Langmuir 1991, 7, 2934.
5. Tanford, C. The Hydrophobic Effect; Wiley: New York, 1980.
6. Borbèly, S.; Cser, L.; Ostanevich, Yu. M.; Vass, Sz. J. Phys. Chem.
1989, 93, 7967.
7. Turro, N. J.; Yekta, A. J. Am. Chem. Soc. 1978, 100, 5951.
8. Almgren, M.; Grieser, F.; Thomas, J. K. J. Am. Chem. Soc. 1979,
101, 279.
9. De Schryver, F. C.; Croonen, Y.; Geladé, E.; Van der Auweraer, M.;
Dederen, J. C.; Roelants, E.; Boens, N. In Surfactants in Solution, Vol.
1; Mittal, K. L.; Lindman, B., Eds.; Plenum: New York, 1984; p 663.
10. Infelta, P. P. Chem. Phys. Lett. 1979, 61, 88.](https://image.slidesharecdn.com/micellaraggregationnumber-160304060934/85/Micellar-aggregation-number-5-320.jpg)

This document summarizes an experiment performed with students to determine micellar aggregation numbers of various ionic surfactants. The experiment introduces key concepts about micelle formation such as how increasing surfactant concentration or adding salt can decrease the critical micelle concentration and increase the aggregation number. Students determine aggregation numbers using a fluorescence quenching method and analyze how numbers change with hydrocarbon chain length and added salt. The results provide insight into the factors that influence micelle formation.


![[Charlie papazian] the_new_complete_joy_of_home_br(book_zz.org)](https://cdn.slidesharecdn.com/ss_thumbnails/charliepapazianthenewcompletejoyofhomebrbookzz-170328000045-thumbnail.jpg?width=640&height=640&fit=bounds)


