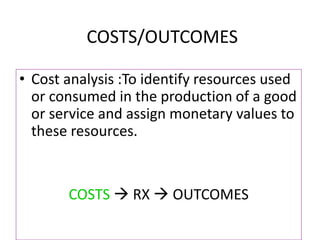
3. • Pharmacoeconomics is the description and analysis of the costs of drug
therapy to healthcare systems and society.
• Pharmacoeconomic studies weigh the cost of alternative drugs and drug
regimens against the outcomes they achieve to guide decisions and
policies about which drugs should be used in general, which drugs should
be paid for by the government or other third party payers, etc.
• The importance of pharmacoeconomic information to healthcare decision
makers will depend upon the viewpoint from which the analysis is
conducted.
• Pharmacoeconomics is needful in pharmaceutical industry, government,
and in the private sector for comparing various cost consequences.
5. Why is Pharmacoeconomics important?
• Pharmacoeconomics helps assess if scarce
health care resources are being spent wisely
on pharmacy products and services.
6. The two fundamental components of
pharmacoeconomic studies are measures of
costs and measures of outcomes that are
combined into a quantitative measure or
ratio.
It can be done using various methods like Cost-
minimization analysis (CMA), Cost-
effectiveness analysis (CEA), Cost-utility
analysis (CUA), and Cost-benefit analysis
(CBA).
7. Types of Pharmacoeconomic Studies
• Cost-minimization analysis (CMA)
• Cost-benefit analysis (CBA)
• Cost-effectiveness analysis (CEA)
• Cost-utility analysis (CUA)
COSTS RX OUTCOMES
• More than one type may be included in a study (e.g.
CEA and CUA)
8. Other ‘Cost’ Studies
• Cost-consequence analysis (CCA)
– Lists costs and various outcomes presented but no
calculations or comparisons made
• Cost-of-illness (COI)
– Estimate of total economic burden (prevention,
treatment, losses in productivity) of a particular
condition or disease on society
9. COSTS/OUTCOMES
• Cost analysis :To identify resources used
or consumed in the production of a good
or service and assign monetary values to
these resources.
COSTS RX OUTCOMES
11. Types of Costs
• Direct Medical Costs
• Direct Non-Medical Costs
• Indirect Costs
• Intangible Costs
12. Direct Medical Costs
• What is paid for specific health care services,
such as physician services, hospitalization, and
pharmaceuticals
• EX: Physical therapy,costs of clinic visits
13. Direct Non-Medical Costs
• Costs necessary to enable patients to receive
medical care
• EX: Transportation to and from visits, lodging,
baby-sitters (special diet)
14. Indirect Costs
• Measure of the patient’s lost productivity plus
the lost productivity of all unpaid caregivers
• EX: Time off from work, less productive days,
spouses time off from work.
15. Intangible Costs
• Reflect the patient’s level of pain and
suffering. These are the hardest to measure.
• Anxiety, chronic pain, loss of functioning
15
16. Examples
• A daughter takes a week off from work to attend to her ill father
• Inpatient charge of R$268 per day for acute care
• Fatigue from chemotherapy
• Taxi fare to emergency department
• Ambulance service to emergency department
17. Examples
• A daughter takes a week off from work to attend to her ill father
– INDIRECT COSTS (productivity)
• Inpatient charge of R$268 per day for acute care
– DIRECT MEDICAL COSTS
• Fatigue from chemotherapy
– INTANGIBLE COSTS
• Taxi fare to emergency department
– DIRECT NON-MEDICAL COSTS
• Ambulance service to emergency department
– DIRECT MEDICAL COSTS
18. Example – Types of Costs for
Schizophrenia
• Direct Medical
– Medications
– Outpatient/professional
services
– Inpatient services
– Long-term care
• Direct Non-Medical
– Law enforcement
– Shelters
• Indirect
– Unemployment
– Reduced productivity at
work
– Premature mortality
(suicide)
– Caregiver
19. Incremental Costs
• Average costs = total cost / total units
• Incremental = Change in total cost / change in
units
20. Adjusting for Time Differences
Two different concepts
• Inflation
– If data collected over more than one year
– Prices may be adjusted to uniform price
• Time Preference
– If program or therapy extends more than one year,
“discounting” is appropriate
21. Discounting
• A time preference is associated with money
• Current and future costs are not valued the
same
• If the treatment costs (and outcomes*)
extend for more than one year, discounting
should be conducted to account for this
difference.
23. Cost-Minimization Analysis (CMA)
• Costs are measured in monetary units
• Outcomes are assumed to be equivalent
• Examples: compare generics or home vs.
outpatient services.
24. CMA Research Example
• Cost-minimization analysis of erlotinib in the
second-line treatment of non-cell lung cancer:
A Brazilian perspective
• Doral Stephani S; Giorgio Saggia M; Vicino dos
Santos EA.
• Journal of Medical Economics 2008; Vol. (3), p.
383-96.
26. Cost-Effectiveness Analysis (CEA)
• Advantage: Do not have to place a dollar
value on clinical outcomes
• Disadvantage: Can only compare options
with the same type of outcome, and only
one outcome at a time can be measured.
30. Cost-Utility Analysis
(Some consider this a type of CEA)
• Costs measured in dollars
Consequences measured in preference-
based measures, such as QALYs/DALYs
(quality-adjusted life years (QALY) and the
cost of disability-adjusted life years (DALY).
• Incorporates mortality and morbidity (quality
and quantity of life)
31. Steps in Utility Analysis
• Describe the health state
• Choose the instrument
• Administer the instrument
• Calculate utility
• Calculate QALYs
33. • The World Health Organization defines disability-adjusted life
years (DALY) as:a health gap measure that extends the
concept of potential years of life lost due to premature death to
include equivalent years of healthy life lost by virtue of being
in states of poor health or disability.
• Two mathematical equations are used to calculate DALY,
years of life lost (YLL) and years lived with disability (YLD).
• YLL is the number of years of life lost due to premature death.
• YLD is the number of healthy years lost due to disability
from the condition until remission or death.
33
34. • The DALY scale range is the reverse of the QALY scale, with 1
indicating death and 0 indicating the best possible state of health.
• DALY example. Assume that 150 eighteen-year-olds die as a result
of motorcycle accidents in a state with no helmet law.
• The life expectancy for the birth cohort of 1990 is 71.8 years
(National Center for Health Statistics, 2006). Therefore, YLL (for
the total sample) was 8070 (150 X 53.8 years).
• For YLD, lets assume these teenagers did not die, but sustained
severe brain trauma with disabilities similar to someone with severe
cerebral palsy. As a result, their life expectancy, due to this injury, is
decreased to 31 years (Hutton & Pharoah, 2005).
34
35. • YLD is the computation of number of
incidence X disability weight X average
duration of disease or infirmary until death or
remission.
• Suppose the disability is weighted 0.8
(remember 0 is perfect health and 1 is death).
The YLD is then 150 X 0.8 X 13 = 1560.
• Thus DALY (9630) = YLL (8070) + YLD
(1560)
35
37. • The "weight" values between 0 and 1 are usually determined by
methods such as:
• Time-trade-off (TTO): Respondents are asked to choose between
remaining in a state of ill health for a period of time, or being
restored to perfect health but having a shorter life expectancy.
• Standard gamble (SG): Respondents are asked to choose between
remaining in a state of ill health for a period of time, or choosing a
medical intervention which has a chance of either restoring them to
perfect health, or killing them.
• Visual analogue scale (VAS): Respondents are asked to rate a state
of ill health on a scale from 0 to 100, with 0 representing being dead
and 100 representing perfect health.
37
39. Administer the Instrument - to
whom?
• The general public
– societal perspective
– hard to describe to general public
• People with the disease
– if comparing people with the same disease
– may be biased
• Health Professionals / Disease Experts
– do not have to explain or describe
– may be biased
41. Advantages of CUA
• Includes patients’ preferences
• Provides a single measure to incorporate
morbidity and mortality
• Allows comparisons across different options
42. Disadvantages of CUA
• Time consuming
• Results vary depending on who assesses the
conditions and by what instrument is used
• Should you discount utilities?
• Unanswered questions - Is a 20 QALY gain for one
person = a 1 QALY gain for 20 people?
• How much is a QALY/DALY worth?
44. Cost-Benefit Analysis (CBA)
• Costs measured in monetary units
• Outcomes measured in monetary units
• Calculate Benefit-to-Cost (B:C) ratio
45. Cost-Benefit Analysis (CBA)
• Advantage = can summarize benefits from
many sources into one number (money) and
compare vastly different options
• Disadvantage = difficult to place monetary
value on health outcomes
46. Costs ($)
Benefits ($)
Direct Benefits $ Indirect Benefits $ Intangible Benefits $
Productivity Patient Preferences
Pain
Suffering
Human Capital (HC)
Medical Non-medical
Medical Non-medical
47. Human Capital
• Value of health benefits=the economic
productivity they permit
– Cost of disease=lost productivity
• Cost of a sick day=how much you earn that day
48. Human Capital
• Problems
– Biased against specific groups
• Age, gender, education
– Earnings may not equal the value of outputs
• Professional athlete versus teacher
– Does not include values for pain and suffering if the
disease state or condition does not impact productivity
• E.g., Menopause, Impotence vs. Diabetes, Cancer
49.
50. For More Information
• Methods for the Economic Evaluation of Health Care
Programmes, 3rd ed. Drummond, Sculpher, Torrance,
O’Brien and Stoddart, 2005
• Health Care Cost, Quality, and Outcomes: ISPOR Book
of Terms, Berger et al, 2003 –.
• International Society for Pharmacoeconomics and
Outcomes Research http://www.ispor.org