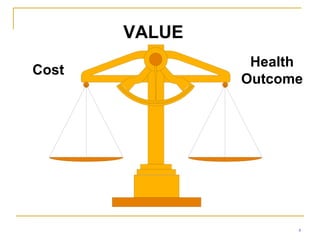
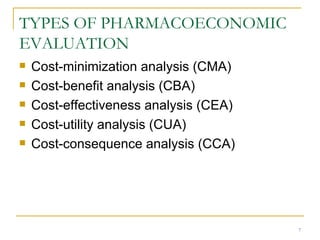
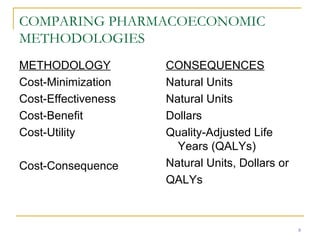
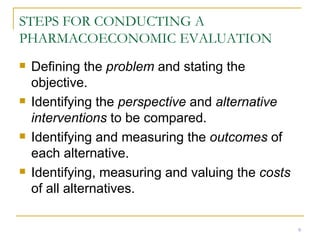
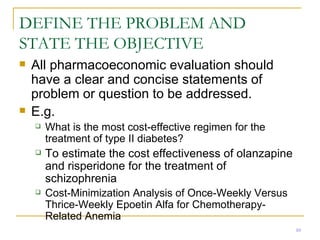
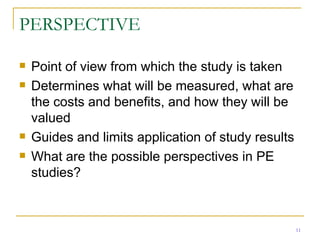
RESEARCH PROCESS IN PHCA -PHARMACOECONOMICS Jinender Kumar MS Candidate, 2 nd  Year (PHCA)
Pharmacoeconomics Research Uses of Pharmacoeconomics Research Need for Pharmacoeconomics Research Types of Pharmacoeconomics Research Sensitivity Analysis Discounting Journals  References Preview
PHARMACOECONOMICS RESEARCH Sub-discipline of health economics compares the costs (i.e resources consumed) and consequences (i.e economic, clinical and humanistic) of the drug therapies and medical interventions PE analysis efficient allocation of limited resources among competing alternative medications and services biggest bang for your buck
VALUE Health Outcome Cost
USE OF PHARMACOECONOMIC RESEARCH Pharmaceutical reimbursement Selecting formulary products Price Negotiations Clinical Practice Development guidelines Communication to prescribing physicians
NEEDS TO MONITOR VALUE OF PHARMACEUTICALS Increased cost. Increased number of alternatives available to treat illness and disease. Growing demand for pharmaceuticals. Introduction of high cost biotechnology products.
TYPES OF PHARMACOECONOMIC EVALUATION Cost-minimization analysis (CMA) Cost-benefit analysis (CBA) Cost-effectiveness analysis (CEA) Cost-utility analysis (CUA) Cost-consequence analysis (CCA)
COMPARING PHARMACOECONOMIC METHODOLOGIES METHODOLOGY Cost-Minimization  Cost-Effectiveness Cost-Benefit Cost-Utility Cost-Consequence CONSEQUENCES Natural Units Natural Units Dollars Quality-Adjusted Life Years (QALYs) Natural Units, Dollars or  QALYs
STEPS FOR CONDUCTING A PHARMACOECONOMIC EVALUATION Defining the  problem  and stating the objective. Identifying the  perspective  and  alternative interventions  to be compared. Identifying and measuring the  outcomes  of each alternative. Identifying, measuring and valuing the  costs  of all alternatives.
DEFINE THE PROBLEM AND STATE THE OBJECTIVE All pharmacoeconomic evaluation should have a clear and concise statements of problem or question to be addressed. E.g.  What is the most cost-effective regimen for the treatment of type II diabetes? To estimate the cost effectiveness of olanzapine and risperidone for the treatment of schizophrenia  Cost-Minimization Analysis of Once-Weekly Versus Thrice-Weekly Epoetin Alfa for Chemotherapy-Related Anemia
PERSPECTIVE Point of view from which the study is taken Determines what will be measured, what are the costs and benefits, and how they will be valued Guides and limits application of study results What are the possible perspectives in PE studies?
PERSPECTIVE Pharmacoeconomic evaluation can be conducted from several different perspectives including the employer, the patient, the health insurance plan, society, or the government.
IDENTIFYING ALTERNATIVE INTERVENTIONS Which alternative should be compared in pharmacoeconomic evaluation?
IDENTIFYING ALTERNATIVE INTERVENTIONS Alternatives should be compared only when one of the alternatives is either more costly or more effective.
IDENTIFY AND MEASURE OUTCOMES OF EACH ALTERNATIVE INTERVENTION Some of the outcomes of the treatment are: A cure (health is restored) Improved quality of life Decreased incidence of morbidity Extended life Relief or reduction in symptoms No effect Increased morbidity Mortality
OUTCOMES Both positive and negative outcomes should be addressed Positive outcomes: drug’s efficacy measure Negative outcomes: ADR and treatment failure
IDENTIFYING,MEASUREMENT AND VALUATION OF COSTS From the measurement aspect, two components are costs and consequences Three important concepts related to costs are identifying, measuring, and placing a value on resources or costs.
IDENTIFYING RELEVANT COSTS What is cost? How is cost different from price?
COSTS Direct costs : costs to deliver services to patient; both medical and non-medical Indirect costs : cost of treatment to patient or society Intangible costs : quality of life
Costs can be described in many ways Cost / unit  (cost/tab, cost/vial) Cost / treatment Cost / person Cost / person / year Cost / case prevented Cost / life saved Cost / DALY (disability-adjusted life year)
MEASURING COSTS After cost identification the next step involves measuring the costs. Measurement involves counts of resources consumed in units depending on the type of costs.
VALUING COSTS After cost measurement, the next step involves placing a dollar value on the resources.
SENSITIVITY ANALYSIS Test key outcome or cost assumption of an analysis to determine how sensitive the results are to variation or to uncertainty. In pharmacoeconomic evaluations, the accuracy with which costs can be identified, measured, or valued will vary.
DISCOUNTING The purpose of discounting is to present all costs in their present value and to incorporate the society’s time preference for money. Alternatives that have costs or benefits realized at different times should be discounted to a present value to make valid comparisons.
COST-MINIMIZATION ANALYSIS (CMA) CMA compares the cost and consequences of two or more therapeutic interventions that are equivalent in their outcomes or consequences.  E.g.  Comparison between brand and generic drugs Comparison of different routes of administration of the same drug Comparison of different setting for the administration of the same drug therapy. Comparison of different dosages of the same drug at different time points (OW vs. TIW)
COST-MINIMIZATION ANALYSIS (CMA) The cost differences can be presented as average cost per patient or average cost of care if number of patients are same under each alternative
Cost-Minimization Analysis of Once-Weekly Versus Thrice-Weekly Epoetin Alfa for Chemotherapy-Related Anemia This study was published in JMCP in 2004. The investigators main objective was to conduct a cost-minimization analysis comparing OW and TIW EPO dosing from a societal perspective. Various Clinical studies have established the clinical equivalency between OW (40000 units) and TIW (10000 units) EPO dosing.
Cost-Minimization Analysis of Once-Weekly Versus Thrice-Weekly Epoetin Alfa for Chemotherapy-Related Anemia OW dosing requires additional 10000 units per week The investigators compared the direct and indirect cost associated with OW and TIW EPO dosing by using the data from 2 large community based trials. Resource utilization data was available in both studies for- EPO, transfusion, laboratory tests, office visits, and opportunity cost of patient time resources over the period during which the patient remained in the study. Costs were calculated by applying cost estimates of specific procedures from the published literature.
Cost-Minimization Analysis of Once-Weekly Versus Thrice-Weekly Epoetin Alfa for Chemotherapy-Related Anemia Cost assumptions are provided in Table 5 All cost are measure in 2002 US Dollars Total costs, sensitivity analysis and the break points for statistically significant differences are shown in Table 6 For OW dosing, transfusion, laboratory cost and time costs were lower than TIW dosing The investigators did not consider the cost associated with the caregiver time and intangible cost of avoiding two painful injections each week.
COST-EFFECTIVENESS ANALYSIS (CEA) Most frequently used method CEA is restricted to situations in which the outcomes of the alternative are measured on the same scale, such as mm Hg or serum cholesterol level. CEA determines which alternative can achieve the best outcome at the lowest cost.
COST-EFFECTIVENESS ANALYSIS (CEA) The results of CEA are presented as the incremental ratio of costs to outcomes $43/ADDITIONAL SUCCESSFUL CASE TREATED $122/SUCCESFUL CASE 0.78 $95 C $260/ADDITIONAL SUCCESSFUL CASE TREATED $187/SUCCESFUL CASE 0.80 $150 B $155/SUCCESFUL CASE 0.55 $85 A ICER Average cost effectiveness ratio Outcome (Success rate) Average cost per patient Alternative
COST-BENEFIT ANALYSIS (CBA) CBA measures outcomes in dollars value CBA include studies which are conducted to make decisions with a broad societal impact E.g. Whether to fund immunization programs or implement child safety seat legislation (will help government decide which program to implement with limited budget)
COST-BENEFIT ANALYSIS (CBA) Two most commonly used methods to determine cost benefits are Net benefit and Cost-to-benefit or benefit-to-cost ratio. Net Benefit=Benefits-cost (for programs less than a year) Benefit-to cost-ratio=Benefits/costs
COST-UTILITY ANALYSIS (CUA) CUA measures outcomes as lives saved CUA measure both the quantity and quality aspects of gain in life years (adjusts the gain in life years for quality – measured as QALYs) In CUA, life years are converted to QALY by applying a utility value (0-1) 0-death, 1-perfect health Most health states fall between these extremes
COST-UTILITY ANALYSIS (CUA) CUA is often considered an extension of CEA CEA measures Incremental cost effectiveness ratio (ICER) CUA measures Incremental cost utility ratio (ICUR) ICER=Additional cost of therapy/additional life years ICUR= Additional cost of therapy/additional QALY
COST-CONSEQUENCE ANALYSIS (CCA) CCA presents all costs and effects in a disaggregated format - - - - Cases successfully treated - - - - Clinical - - -- - Quality of life (QALY) - - - - Consequences - - - - Productivity (lost days/episode) - - - - Caregiver time - - - - Indirect - - - - Transportation - - - - Direct Non Medical - - - - Hospitalizations - - - - Physician costs - - - - Drug therapy Costs Units  Costs Units  Direct Medical Drug B Drug A Cost (per Patient)
COST-CONSEQUENCE ANALYSIS (CCA) Decision makers  can chose among the costs and outcomes that best fit their perspective The advantages of CCA are its comprehensiveness and transparency for the decision makers The disadvantages for the researchers are that they must identify, collect, and value cost and outcomes salient to a variety of perspectives.
JOURNALS Value in Health Pharmacoeconomics Health Economics Pharmacoeconomics and Outcomes News Clinical Therapeutics - Pharmaceutical Economics & Health Policy  Health Affairs (The Policy journal)
REFERENCES http://ispor.org/Terminology/Default.asp Bootman JL, Townsend RJ, Mcghan WF. Principles of Pharmacoeconomics. 3 rd edition. Harvey Books Company. 2005. McCArthy Rl, Schafermeyer KW. Introduction to Health Care Delivery. 3 rd  edition. Jones and Barlett Publisher. 2004. Bonk RJ. Pharmacoeconomics in Perspective:a primer on reseach, techniques and perspective. Pharmaceutical product  press. 1999. Rychlik R.Strategies and  Pharmacoeconomics and Outcomes Research. Pharmaceutical Heritage Edition. 2003. Vogenberg FR. Introduction to Applied Pharmacoeconomics. Mcgraw-Hill Publications. 2001.

Pharmacoeconomics1

  • 1.
    RESEARCH PROCESS INPHCA -PHARMACOECONOMICS Jinender Kumar MS Candidate, 2 nd Year (PHCA)
  • 2.
    Pharmacoeconomics Research Usesof Pharmacoeconomics Research Need for Pharmacoeconomics Research Types of Pharmacoeconomics Research Sensitivity Analysis Discounting Journals References Preview
  • 3.
    PHARMACOECONOMICS RESEARCH Sub-disciplineof health economics compares the costs (i.e resources consumed) and consequences (i.e economic, clinical and humanistic) of the drug therapies and medical interventions PE analysis efficient allocation of limited resources among competing alternative medications and services biggest bang for your buck
  • 4.
  • 5.
    USE OF PHARMACOECONOMICRESEARCH Pharmaceutical reimbursement Selecting formulary products Price Negotiations Clinical Practice Development guidelines Communication to prescribing physicians
  • 6.
    NEEDS TO MONITORVALUE OF PHARMACEUTICALS Increased cost. Increased number of alternatives available to treat illness and disease. Growing demand for pharmaceuticals. Introduction of high cost biotechnology products.
  • 7.
    TYPES OF PHARMACOECONOMICEVALUATION Cost-minimization analysis (CMA) Cost-benefit analysis (CBA) Cost-effectiveness analysis (CEA) Cost-utility analysis (CUA) Cost-consequence analysis (CCA)
  • 8.
    COMPARING PHARMACOECONOMIC METHODOLOGIESMETHODOLOGY Cost-Minimization Cost-Effectiveness Cost-Benefit Cost-Utility Cost-Consequence CONSEQUENCES Natural Units Natural Units Dollars Quality-Adjusted Life Years (QALYs) Natural Units, Dollars or QALYs
  • 9.
    STEPS FOR CONDUCTINGA PHARMACOECONOMIC EVALUATION Defining the problem and stating the objective. Identifying the perspective and alternative interventions to be compared. Identifying and measuring the outcomes of each alternative. Identifying, measuring and valuing the costs of all alternatives.
  • 10.
    DEFINE THE PROBLEMAND STATE THE OBJECTIVE All pharmacoeconomic evaluation should have a clear and concise statements of problem or question to be addressed. E.g. What is the most cost-effective regimen for the treatment of type II diabetes? To estimate the cost effectiveness of olanzapine and risperidone for the treatment of schizophrenia Cost-Minimization Analysis of Once-Weekly Versus Thrice-Weekly Epoetin Alfa for Chemotherapy-Related Anemia
  • 11.
    PERSPECTIVE Point ofview from which the study is taken Determines what will be measured, what are the costs and benefits, and how they will be valued Guides and limits application of study results What are the possible perspectives in PE studies?
  • 12.
    PERSPECTIVE Pharmacoeconomic evaluationcan be conducted from several different perspectives including the employer, the patient, the health insurance plan, society, or the government.
  • 13.
    IDENTIFYING ALTERNATIVE INTERVENTIONSWhich alternative should be compared in pharmacoeconomic evaluation?
  • 14.
    IDENTIFYING ALTERNATIVE INTERVENTIONSAlternatives should be compared only when one of the alternatives is either more costly or more effective.
  • 15.
    IDENTIFY AND MEASUREOUTCOMES OF EACH ALTERNATIVE INTERVENTION Some of the outcomes of the treatment are: A cure (health is restored) Improved quality of life Decreased incidence of morbidity Extended life Relief or reduction in symptoms No effect Increased morbidity Mortality
  • 16.
    OUTCOMES Both positiveand negative outcomes should be addressed Positive outcomes: drug’s efficacy measure Negative outcomes: ADR and treatment failure
  • 17.
    IDENTIFYING,MEASUREMENT AND VALUATIONOF COSTS From the measurement aspect, two components are costs and consequences Three important concepts related to costs are identifying, measuring, and placing a value on resources or costs.
  • 18.
    IDENTIFYING RELEVANT COSTSWhat is cost? How is cost different from price?
  • 19.
    COSTS Direct costs: costs to deliver services to patient; both medical and non-medical Indirect costs : cost of treatment to patient or society Intangible costs : quality of life
  • 20.
    Costs can bedescribed in many ways Cost / unit (cost/tab, cost/vial) Cost / treatment Cost / person Cost / person / year Cost / case prevented Cost / life saved Cost / DALY (disability-adjusted life year)
  • 21.
    MEASURING COSTS Aftercost identification the next step involves measuring the costs. Measurement involves counts of resources consumed in units depending on the type of costs.
  • 22.
    VALUING COSTS Aftercost measurement, the next step involves placing a dollar value on the resources.
  • 23.
    SENSITIVITY ANALYSIS Testkey outcome or cost assumption of an analysis to determine how sensitive the results are to variation or to uncertainty. In pharmacoeconomic evaluations, the accuracy with which costs can be identified, measured, or valued will vary.
  • 24.
    DISCOUNTING The purposeof discounting is to present all costs in their present value and to incorporate the society’s time preference for money. Alternatives that have costs or benefits realized at different times should be discounted to a present value to make valid comparisons.
  • 25.
    COST-MINIMIZATION ANALYSIS (CMA)CMA compares the cost and consequences of two or more therapeutic interventions that are equivalent in their outcomes or consequences. E.g. Comparison between brand and generic drugs Comparison of different routes of administration of the same drug Comparison of different setting for the administration of the same drug therapy. Comparison of different dosages of the same drug at different time points (OW vs. TIW)
  • 26.
    COST-MINIMIZATION ANALYSIS (CMA)The cost differences can be presented as average cost per patient or average cost of care if number of patients are same under each alternative
  • 27.
    Cost-Minimization Analysis ofOnce-Weekly Versus Thrice-Weekly Epoetin Alfa for Chemotherapy-Related Anemia This study was published in JMCP in 2004. The investigators main objective was to conduct a cost-minimization analysis comparing OW and TIW EPO dosing from a societal perspective. Various Clinical studies have established the clinical equivalency between OW (40000 units) and TIW (10000 units) EPO dosing.
  • 28.
    Cost-Minimization Analysis ofOnce-Weekly Versus Thrice-Weekly Epoetin Alfa for Chemotherapy-Related Anemia OW dosing requires additional 10000 units per week The investigators compared the direct and indirect cost associated with OW and TIW EPO dosing by using the data from 2 large community based trials. Resource utilization data was available in both studies for- EPO, transfusion, laboratory tests, office visits, and opportunity cost of patient time resources over the period during which the patient remained in the study. Costs were calculated by applying cost estimates of specific procedures from the published literature.
  • 29.
    Cost-Minimization Analysis ofOnce-Weekly Versus Thrice-Weekly Epoetin Alfa for Chemotherapy-Related Anemia Cost assumptions are provided in Table 5 All cost are measure in 2002 US Dollars Total costs, sensitivity analysis and the break points for statistically significant differences are shown in Table 6 For OW dosing, transfusion, laboratory cost and time costs were lower than TIW dosing The investigators did not consider the cost associated with the caregiver time and intangible cost of avoiding two painful injections each week.
  • 30.
    COST-EFFECTIVENESS ANALYSIS (CEA)Most frequently used method CEA is restricted to situations in which the outcomes of the alternative are measured on the same scale, such as mm Hg or serum cholesterol level. CEA determines which alternative can achieve the best outcome at the lowest cost.
  • 31.
    COST-EFFECTIVENESS ANALYSIS (CEA)The results of CEA are presented as the incremental ratio of costs to outcomes $43/ADDITIONAL SUCCESSFUL CASE TREATED $122/SUCCESFUL CASE 0.78 $95 C $260/ADDITIONAL SUCCESSFUL CASE TREATED $187/SUCCESFUL CASE 0.80 $150 B $155/SUCCESFUL CASE 0.55 $85 A ICER Average cost effectiveness ratio Outcome (Success rate) Average cost per patient Alternative
  • 32.
    COST-BENEFIT ANALYSIS (CBA)CBA measures outcomes in dollars value CBA include studies which are conducted to make decisions with a broad societal impact E.g. Whether to fund immunization programs or implement child safety seat legislation (will help government decide which program to implement with limited budget)
  • 33.
    COST-BENEFIT ANALYSIS (CBA)Two most commonly used methods to determine cost benefits are Net benefit and Cost-to-benefit or benefit-to-cost ratio. Net Benefit=Benefits-cost (for programs less than a year) Benefit-to cost-ratio=Benefits/costs
  • 34.
    COST-UTILITY ANALYSIS (CUA)CUA measures outcomes as lives saved CUA measure both the quantity and quality aspects of gain in life years (adjusts the gain in life years for quality – measured as QALYs) In CUA, life years are converted to QALY by applying a utility value (0-1) 0-death, 1-perfect health Most health states fall between these extremes
  • 35.
    COST-UTILITY ANALYSIS (CUA)CUA is often considered an extension of CEA CEA measures Incremental cost effectiveness ratio (ICER) CUA measures Incremental cost utility ratio (ICUR) ICER=Additional cost of therapy/additional life years ICUR= Additional cost of therapy/additional QALY
  • 36.
    COST-CONSEQUENCE ANALYSIS (CCA)CCA presents all costs and effects in a disaggregated format - - - - Cases successfully treated - - - - Clinical - - -- - Quality of life (QALY) - - - - Consequences - - - - Productivity (lost days/episode) - - - - Caregiver time - - - - Indirect - - - - Transportation - - - - Direct Non Medical - - - - Hospitalizations - - - - Physician costs - - - - Drug therapy Costs Units Costs Units Direct Medical Drug B Drug A Cost (per Patient)
  • 37.
    COST-CONSEQUENCE ANALYSIS (CCA)Decision makers can chose among the costs and outcomes that best fit their perspective The advantages of CCA are its comprehensiveness and transparency for the decision makers The disadvantages for the researchers are that they must identify, collect, and value cost and outcomes salient to a variety of perspectives.
  • 38.
    JOURNALS Value inHealth Pharmacoeconomics Health Economics Pharmacoeconomics and Outcomes News Clinical Therapeutics - Pharmaceutical Economics & Health Policy Health Affairs (The Policy journal)
  • 39.
    REFERENCES http://ispor.org/Terminology/Default.asp BootmanJL, Townsend RJ, Mcghan WF. Principles of Pharmacoeconomics. 3 rd edition. Harvey Books Company. 2005. McCArthy Rl, Schafermeyer KW. Introduction to Health Care Delivery. 3 rd edition. Jones and Barlett Publisher. 2004. Bonk RJ. Pharmacoeconomics in Perspective:a primer on reseach, techniques and perspective. Pharmaceutical product press. 1999. Rychlik R.Strategies and Pharmacoeconomics and Outcomes Research. Pharmaceutical Heritage Edition. 2003. Vogenberg FR. Introduction to Applied Pharmacoeconomics. Mcgraw-Hill Publications. 2001.