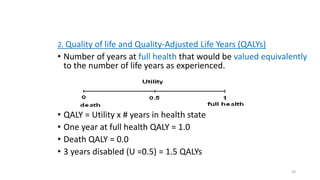
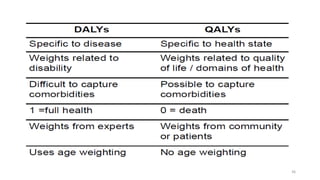
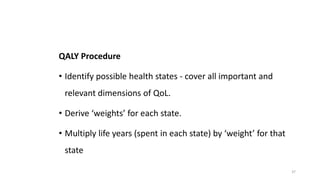
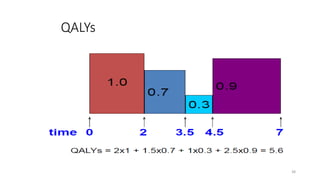
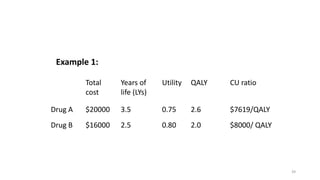
Chapter VII
Cost Utility Analysis
1
May you have a 11111 day
2
CUA
• Pharmacoeconomists sometimes want to include a measure of
patient preference or quality of life when comparing competing
treatment alternatives.
• Cost-utility analysis (CUA) is a method for comparing treatment
alternatives that integrates patient preferences and HRQOL.
3
CUA….
For pharmacotherapy decisions:
• various factors like patient preferences, patient satisfaction, impact
of disease and Rx of disease on a patient's health related QOL are
applied in PE.
QOL: the assessment of functional effects of illness and its consequent
therapy as perceived by the patient.
 Expressed as emotional, physical or social impacts on patients
 QOL can be measured with the help of structured questionnaires
filled by patients.
4
CUA….
• Often the utility measurement used is a quality-adjusted life year
(QALY) gained.
• QALY is a common measure of health status used in CUA, combining
morbidity and mortality data.
• Results of CUA are also expressed in a ratio, a cost-utility ratio (C:U
ratio).
• The preferred treatment alternative is that with the lowest cost per
QALY (or other health-status utility).
5
Taxonomy
6
CUA….
When to use CUA
Health-Related Quality of Life is the important outcome
Programmes affect both mortality and morbidity and you want to
combine both effects
Programmes affect wide range of outcomes and you want common unit
for comparison
when comparing programs and treatment alternatives:
that are life extending with serious side effects (e.g., cancer
chemotherapy),
those which produce reductions in morbidity rather than mortality
(e.g., medical treatment of arthritis)
7
CUA….
When not to use
Only have intermediate outcome data
Effectiveness data show outcomes are equivalent
Effectiveness data show dominance
Extra cost of obtaining utility values is itself not CE
8
CUA….
• Cost-utility analysis is a special form of CEA.
• CUA tried to combine the quality and quantity of life in its outcome
measures.
What is the U in CUA?
Utility - It refers to level of satisfaction or usefulness that consumers
derive from the consumption of goods and services.
• Utility weights are necessarily subjective - they elicit an individual’s
preferences for, or value of, one or more health states.
9
METHODS USED TO MEASURE AND ESTIMATE UTILITY
• The precise meaning of a given utility estimate is dependent on
the approach,
scaling method and
source of values used in its derivation
• There is little consensus as to which approach is preferred
10
Components of utility measurement
I. Scaling method/ Measuring “Utility”
 Rating scale
 Standard gamble
 Time trade-off
 Person trade-off
II. Approach
• Direct
• Holistic or composite
• Generic multi-attribute utility (MAU)
instrument
iii. Source of values
• Patients
• Health care providers
• General public
11
Y..
12
Time Trade-Off (TTO)
• Choice between two certain outcomes
• Years of life traded for quality of life
• Years of healthy life you would give up to avoid living in a state of
poor health
13
Example
• You have arthritis (unable to do household and personal care tasks,
difficulty walking)
• Choose between living with arthritis for the next 10 years (followed by
immediate death) or living in full health for a shorter length of time
(followed by immediate death)
• Would you choose 1 year of full health (followed by death) or 10 years with
arthritis (followed by death)?
• Would you choose 9 years of full health (followed by death) or 10 years
with arthritis (followed by death)?
• ‘Flip-flop’ until “preference value” is found
14
• Utility of Health State A is T/10
T is the number of years in full health
10 is the number of years in Health State A
If years in full health selected was 6
Utility (HSA)= 6/10 = 0.60
The better Health State A is, the less the years of healthy life you
would give up
15
Standard Gamble (SG)
• Classical method of assessing preferences
• Choose between certain outcome and a gamble
• Conforms to axioms of expected utility theory
• Incorporates uncertainty, therefore better reflects real
treatment decisions
• If respondent is risk neutral then utilities from SG should be
the same as from TTO
16
17
• You have end-stage renal disease and face the prospect of
being on dialysis for the remaining 40 years of your life
• You are offered a hypothetical intervention (e.g. a xenograft)
that will involve the gamble:
Immediate return to full health (probability = p)
Immediate death (probability = 1- p)
18
• Preference value of ‘Being On Dialysis’ = p
19
Two means of obtaining “utility” weights:
1. Evaluation specific/’holistic’ measures – develop evaluation
specific (‘holistic’) description of health state and then derive
weight for that specific state directly by population survey.
2. Use ‘generic’ or ‘multi-attribute’ instruments – use
predetermined weights, based on combination of dimensions of
health yielding a finite number of health states/values
20
• CUA:
‘cost per quality adjusted life year’,
‘cost per healthy year equivalent’ or
‘cost per disability adjusted life year’.
• Natural units cannot capture both outcomes
• We need other measures like DALY and QALY
21
Limitations of CUA
• Measurement of utility is very time and resource intensive.
• Lack of consensus on measurement methods
In general, researchers agree that “choice-based” approaches
(e.g., standard gamble, time trade-off) are more appropriate.
22
Life Years
• Simplest and widely used measure of health
• Used when the dominant gain from a change is extra life rather
than relief of pain or disability
23
Concepts of Utility Measurement
A. Disability Adjusted Life Years (DALY)
Includes
• potential years of life lost due to premature death (YLL) and
• equivalent years of health life lost by virtue of being in state other
than good health (equivalent healthy years lost due to non fatal
condition)
DALY = YLL + YLD
The non fatal health outcomes
• are difficult to define
• contain various domain like mobility, anxiety, pain etc.
24
DALYs measure the loss of life years in full health starting from a
standardized life expectancy (E.g. of 80 years for men and 82.5 years for
women).
Different weights apply to years lived in different ages.
• The top weight is assigned a year spent at the age of 25 years.
• The utility of an intervention is measured by the number of DALYs
prevented.
• DALYs are used, e.g., by the WHO to compare population health in
different countries.
25
DALY calculation
• Calculate years of life lost due to each disease
• Calculate loss of quality of life of those living with each disease
• Apply weights to reflect social value of people at different ages
• Apply discount rate
26
WHO age weights
27
2. Quality of life and Quality-Adjusted Life Years (QALYs)
• Number of years at full health that would be valued equivalently
to the number of life years as experienced.
• QALY = Utility x # years in health state
• One year at full health QALY = 1.0
• Death QALY = 0.0
• 3 years disabled (U =0.5) = 1.5 QALYs
28
Two basic outcomes of health care QALY
1. Mortality
• Mortality benefit expressed as life-years gained
2. HRQL
• described in terms of the ‘health state’
• single value
• 0 (death) - 1 (good health) scale
29
• The utility of an intervention is given by the number of QALYs gained.
• Respondent characteristics such as disease experience and
adaptation, age, nationality and even income have all been shown to
influence the valuation of a given health state.
30
3. Healthy-Years Equivalents (HYEs)
• Is based on ‘health profiles’.
• Individuals are asked how they evaluate the likely sequence of
health states caused by an intervention.
• In particular, they are asked how many years in perfect health
they would find equally attractive as the profile in question.
31
How to measure QALY
Nottingham health profile
• Measures health status – yes / No – 36 statements on energy, pain
, emotion, social isolation and physical morbidity
• Seven areas of performance : employment , looking home, social
home and sex life, hobbies and holidays
Rossers Index
Others: SF-36, Quality of well being (eg. Asthma Quality of Life
Questionnaire), Euro Qol (EQ-5D), Health Utilities Index (HUI)
33
EQ-5D
MOBILITY
1. I have no problems in walking about
2. I have some problems in walking about
3. am confined to bed
SELF-CARE
1. have no problems with self-care
2. have some problems washing or dressing myself
3. I am unable to wash or dress myself
USUAL ACTIVITIES (e.g. work, study, housework family or leisure activities)
1. I have no problems with performing my usual activities
2. I have some problems with performing my usual activities
3. I am unable to perform my usual activities
34
PAIN / DISCOMFORT
1. I have no pain or discomfort
2. I have moderate pain or discomfort
3. I have extreme pain or discomfort
ANXIETY / DEPRESSION
1. I am not anxious or depressed
2. I am moderately anxious or depressed
3. I am extremely anxious or depressed
35
36
QALY Procedure
• Identify possible health states - cover all important and
relevant dimensions of QoL.
• Derive ‘weights’ for each state.
• Multiply life years (spent in each state) by ‘weight’ for that
state
37
QALYs
38
Example 1:
39
Total
cost
Years of
life (LYs)
Utility QALY CU ratio
Drug A $20000 3.5 0.75 2.6 $7619/QALY
Drug B $16000 2.5 0.80 2.0 $8000/ QALY
Example: Incremental CU ratio
= Cost drug A - Cost drug B
QALY drug A - QALY drug B
= $20,000 - $16,000
2.6 QALYs - 2.0 QALYs
= $6,400 / QALY
40
+
Advantage over CEA:
 it can combine more than one measure of effectiveness or
 both measures of mortality and morbidity into a single measure
Disadvantage:
 absence of agreement in measuring utilities,
 lack of standards for comparing QALY and
 problems with the quantification of patient problems.
• Reserved for comparing programs and treatment alternatives whose
basic goal is improving QOL.
41
42
43
• QALYs-example:
For example, a patient with a rare cancer will live for only 2 years
without treatment. A new treatment increases life expectancy by 2
years however; it is associated with adverse effects which decrease the
quality of life by 25%.
QALY??
44
The QALYs is calculated thus;
• Life expectancy = 2 (survival without treatment) + 2 (gain in life
years due to treatment) = 4 years.
• Adverse drug reactions due to treatment = 0.25%
• Hence decrease in quality of life = 2 x 0.25 = 0.5 years.
• Thus net gain is 2 - 0.5 = 1.5 or 1.5 QALYS.
• Thus the net gain with the new treatment is 1.5 QALYs rather than 2
years.
45
Another example…….
• Assume Life Expectancy=50
• Utility with mumps disease=0.8
• What’s the outcome measure ?
– QALY??=40!
• That is, U=0.8--->> 10 years with mumps infection = 8 years in
good health
46
Issues Measuring Utilities
• Different methods Different results
• Cognitive burden
• Emotional / religious objections
• Biases in measurement
47

7.CUA.pptx

  • 1.
  • 2.
    May you havea 11111 day 2
  • 3.
    CUA • Pharmacoeconomists sometimeswant to include a measure of patient preference or quality of life when comparing competing treatment alternatives. • Cost-utility analysis (CUA) is a method for comparing treatment alternatives that integrates patient preferences and HRQOL. 3
  • 4.
    CUA…. For pharmacotherapy decisions: •various factors like patient preferences, patient satisfaction, impact of disease and Rx of disease on a patient's health related QOL are applied in PE. QOL: the assessment of functional effects of illness and its consequent therapy as perceived by the patient.  Expressed as emotional, physical or social impacts on patients  QOL can be measured with the help of structured questionnaires filled by patients. 4
  • 5.
    CUA…. • Often theutility measurement used is a quality-adjusted life year (QALY) gained. • QALY is a common measure of health status used in CUA, combining morbidity and mortality data. • Results of CUA are also expressed in a ratio, a cost-utility ratio (C:U ratio). • The preferred treatment alternative is that with the lowest cost per QALY (or other health-status utility). 5
  • 6.
  • 7.
    CUA…. When to useCUA Health-Related Quality of Life is the important outcome Programmes affect both mortality and morbidity and you want to combine both effects Programmes affect wide range of outcomes and you want common unit for comparison when comparing programs and treatment alternatives: that are life extending with serious side effects (e.g., cancer chemotherapy), those which produce reductions in morbidity rather than mortality (e.g., medical treatment of arthritis) 7
  • 8.
    CUA…. When not touse Only have intermediate outcome data Effectiveness data show outcomes are equivalent Effectiveness data show dominance Extra cost of obtaining utility values is itself not CE 8
  • 9.
    CUA…. • Cost-utility analysisis a special form of CEA. • CUA tried to combine the quality and quantity of life in its outcome measures. What is the U in CUA? Utility - It refers to level of satisfaction or usefulness that consumers derive from the consumption of goods and services. • Utility weights are necessarily subjective - they elicit an individual’s preferences for, or value of, one or more health states. 9
  • 10.
    METHODS USED TOMEASURE AND ESTIMATE UTILITY • The precise meaning of a given utility estimate is dependent on the approach, scaling method and source of values used in its derivation • There is little consensus as to which approach is preferred 10
  • 11.
    Components of utilitymeasurement I. Scaling method/ Measuring “Utility”  Rating scale  Standard gamble  Time trade-off  Person trade-off II. Approach • Direct • Holistic or composite • Generic multi-attribute utility (MAU) instrument iii. Source of values • Patients • Health care providers • General public 11
  • 12.
  • 13.
    Time Trade-Off (TTO) •Choice between two certain outcomes • Years of life traded for quality of life • Years of healthy life you would give up to avoid living in a state of poor health 13
  • 14.
    Example • You havearthritis (unable to do household and personal care tasks, difficulty walking) • Choose between living with arthritis for the next 10 years (followed by immediate death) or living in full health for a shorter length of time (followed by immediate death) • Would you choose 1 year of full health (followed by death) or 10 years with arthritis (followed by death)? • Would you choose 9 years of full health (followed by death) or 10 years with arthritis (followed by death)? • ‘Flip-flop’ until “preference value” is found 14
  • 15.
    • Utility ofHealth State A is T/10 T is the number of years in full health 10 is the number of years in Health State A If years in full health selected was 6 Utility (HSA)= 6/10 = 0.60 The better Health State A is, the less the years of healthy life you would give up 15
  • 16.
    Standard Gamble (SG) •Classical method of assessing preferences • Choose between certain outcome and a gamble • Conforms to axioms of expected utility theory • Incorporates uncertainty, therefore better reflects real treatment decisions • If respondent is risk neutral then utilities from SG should be the same as from TTO 16
  • 17.
  • 18.
    • You haveend-stage renal disease and face the prospect of being on dialysis for the remaining 40 years of your life • You are offered a hypothetical intervention (e.g. a xenograft) that will involve the gamble: Immediate return to full health (probability = p) Immediate death (probability = 1- p) 18
  • 19.
    • Preference valueof ‘Being On Dialysis’ = p 19
  • 20.
    Two means ofobtaining “utility” weights: 1. Evaluation specific/’holistic’ measures – develop evaluation specific (‘holistic’) description of health state and then derive weight for that specific state directly by population survey. 2. Use ‘generic’ or ‘multi-attribute’ instruments – use predetermined weights, based on combination of dimensions of health yielding a finite number of health states/values 20
  • 21.
    • CUA: ‘cost perquality adjusted life year’, ‘cost per healthy year equivalent’ or ‘cost per disability adjusted life year’. • Natural units cannot capture both outcomes • We need other measures like DALY and QALY 21
  • 22.
    Limitations of CUA •Measurement of utility is very time and resource intensive. • Lack of consensus on measurement methods In general, researchers agree that “choice-based” approaches (e.g., standard gamble, time trade-off) are more appropriate. 22
  • 23.
    Life Years • Simplestand widely used measure of health • Used when the dominant gain from a change is extra life rather than relief of pain or disability 23
  • 24.
    Concepts of UtilityMeasurement A. Disability Adjusted Life Years (DALY) Includes • potential years of life lost due to premature death (YLL) and • equivalent years of health life lost by virtue of being in state other than good health (equivalent healthy years lost due to non fatal condition) DALY = YLL + YLD The non fatal health outcomes • are difficult to define • contain various domain like mobility, anxiety, pain etc. 24
  • 25.
    DALYs measure theloss of life years in full health starting from a standardized life expectancy (E.g. of 80 years for men and 82.5 years for women). Different weights apply to years lived in different ages. • The top weight is assigned a year spent at the age of 25 years. • The utility of an intervention is measured by the number of DALYs prevented. • DALYs are used, e.g., by the WHO to compare population health in different countries. 25
  • 26.
    DALY calculation • Calculateyears of life lost due to each disease • Calculate loss of quality of life of those living with each disease • Apply weights to reflect social value of people at different ages • Apply discount rate 26
  • 27.
  • 28.
    2. Quality oflife and Quality-Adjusted Life Years (QALYs) • Number of years at full health that would be valued equivalently to the number of life years as experienced. • QALY = Utility x # years in health state • One year at full health QALY = 1.0 • Death QALY = 0.0 • 3 years disabled (U =0.5) = 1.5 QALYs 28
  • 29.
    Two basic outcomesof health care QALY 1. Mortality • Mortality benefit expressed as life-years gained 2. HRQL • described in terms of the ‘health state’ • single value • 0 (death) - 1 (good health) scale 29
  • 30.
    • The utilityof an intervention is given by the number of QALYs gained. • Respondent characteristics such as disease experience and adaptation, age, nationality and even income have all been shown to influence the valuation of a given health state. 30
  • 31.
    3. Healthy-Years Equivalents(HYEs) • Is based on ‘health profiles’. • Individuals are asked how they evaluate the likely sequence of health states caused by an intervention. • In particular, they are asked how many years in perfect health they would find equally attractive as the profile in question. 31
  • 32.
    How to measureQALY Nottingham health profile • Measures health status – yes / No – 36 statements on energy, pain , emotion, social isolation and physical morbidity • Seven areas of performance : employment , looking home, social home and sex life, hobbies and holidays Rossers Index Others: SF-36, Quality of well being (eg. Asthma Quality of Life Questionnaire), Euro Qol (EQ-5D), Health Utilities Index (HUI) 33
  • 33.
    EQ-5D MOBILITY 1. I haveno problems in walking about 2. I have some problems in walking about 3. am confined to bed SELF-CARE 1. have no problems with self-care 2. have some problems washing or dressing myself 3. I am unable to wash or dress myself USUAL ACTIVITIES (e.g. work, study, housework family or leisure activities) 1. I have no problems with performing my usual activities 2. I have some problems with performing my usual activities 3. I am unable to perform my usual activities 34
  • 34.
    PAIN / DISCOMFORT 1.I have no pain or discomfort 2. I have moderate pain or discomfort 3. I have extreme pain or discomfort ANXIETY / DEPRESSION 1. I am not anxious or depressed 2. I am moderately anxious or depressed 3. I am extremely anxious or depressed 35
  • 35.
  • 36.
    QALY Procedure • Identifypossible health states - cover all important and relevant dimensions of QoL. • Derive ‘weights’ for each state. • Multiply life years (spent in each state) by ‘weight’ for that state 37
  • 37.
  • 38.
    Example 1: 39 Total cost Years of life(LYs) Utility QALY CU ratio Drug A $20000 3.5 0.75 2.6 $7619/QALY Drug B $16000 2.5 0.80 2.0 $8000/ QALY
  • 39.
    Example: Incremental CUratio = Cost drug A - Cost drug B QALY drug A - QALY drug B = $20,000 - $16,000 2.6 QALYs - 2.0 QALYs = $6,400 / QALY 40
  • 40.
    + Advantage over CEA: it can combine more than one measure of effectiveness or  both measures of mortality and morbidity into a single measure Disadvantage:  absence of agreement in measuring utilities,  lack of standards for comparing QALY and  problems with the quantification of patient problems. • Reserved for comparing programs and treatment alternatives whose basic goal is improving QOL. 41
  • 41.
  • 42.
  • 43.
    • QALYs-example: For example,a patient with a rare cancer will live for only 2 years without treatment. A new treatment increases life expectancy by 2 years however; it is associated with adverse effects which decrease the quality of life by 25%. QALY?? 44
  • 44.
    The QALYs iscalculated thus; • Life expectancy = 2 (survival without treatment) + 2 (gain in life years due to treatment) = 4 years. • Adverse drug reactions due to treatment = 0.25% • Hence decrease in quality of life = 2 x 0.25 = 0.5 years. • Thus net gain is 2 - 0.5 = 1.5 or 1.5 QALYS. • Thus the net gain with the new treatment is 1.5 QALYs rather than 2 years. 45
  • 45.
    Another example……. • AssumeLife Expectancy=50 • Utility with mumps disease=0.8 • What’s the outcome measure ? – QALY??=40! • That is, U=0.8--->> 10 years with mumps infection = 8 years in good health 46
  • 46.
    Issues Measuring Utilities •Different methods Different results • Cognitive burden • Emotional / religious objections • Biases in measurement 47

Editor's Notes

  • #6 combines both the quality and quantity of life. QALYs is the most commonly used in CUA
  • #10 Utility weights Must: 1. Have interval properties 2. Be ‘anchored’ at death and ‘good health’ A given ‘utility’ is simply a number representing intensity of preference, relative to full health or full health for age (given a utility of 1) and death (with a utility of 0).
  • #17 Risk attitude –choices involving gambles, person can be •risk averse •risk seeking •risk neutral –risk attitude affects the utility value obtained from the gamble
  • #29 is the product of the length of life (e.g., the additional years of life gained by taking a drug) and the patient’s assessment of the quality of health during that period of time, or the utility of the health status, to which people in this field refer.
  • #30 Quality of life is a state of well-being which is a composite of two components: 1) the ability to perform everyday activities which reflects physical psychological, and social well-being and 2) patient satisfaction with levels of functioning and the control of disease and/or treatment related symptoms (Gotay et al., 1992).
  • #33 In the DALY concept, the QOL is assessed by experts, whereas in the case of QALYs and HYEs concepts, evaluation is by potential or actual patients.