The document discusses quality-adjusted life years (QALYs) as a method for measuring health outcomes by combining survival periods and health status valuations. It explores various economic evaluation techniques, including cost-minimisation analysis, cost-effectiveness analysis, and cost-utility analysis, to compare healthcare interventions based on their costs and benefits. Additionally, it emphasizes the importance of incremental cost-effectiveness ratios (ICERs) in decision-making when evaluating the trade-offs between different treatment options.
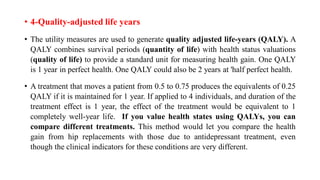


![WORKED EXAMPLE 5.1 incremental economic analysis.
An economic evaluation could examine the first-line management of community-acquired
pneumonia using antibiotics A or C. The effectiveness for both treatment methods can be
measured using 'infections successfully treated first line'.
The incremental economic analysis is carried out in the following way:
What are the costs associated with treatment with
Antibiotic A [CostA]
Antibiotic C [Costc]
What are the outcomes associated with
a) Antibiotic A [Outcome A]
b) Antibiotic C [Outcome C]
What is the difference in cost between using antibiotic A and antibiotic C?
[Cost A – Cost C]
What is the difference in outcome between using antibiotic A and antibiotic C?
[Outcome A – Outcome C]
ICER for treating community-acquired pneumonia with antibiotic A instead of antibiotic C](https://image.slidesharecdn.com/pharmaeconomiclec5-190804012814/85/Pharmaeconomic-18-320.jpg)


