Downloaded 1,048 times

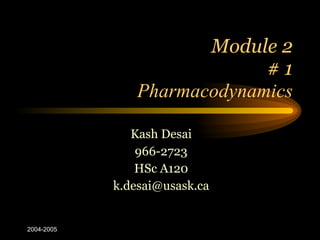

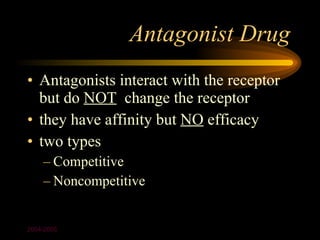
![5
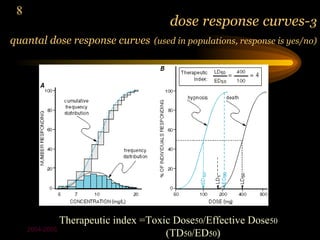
dose response curves
k1 α
[D] + [R] [DR] effect
k -1
at equilibrium: k1/k-1 = affinity const.
[D] x [R] x k1 = [DR] x k-1 k-1/k1 = dissociation
const.(kd)
so that: [DR] = k1
[D] [R] k-1 the lower the kd the
more potent the drug
2004-2005](https://image.slidesharecdn.com/301-lect-1-090704140733-phpapp02/85/Pharmacodynamics-8-320.jpg)
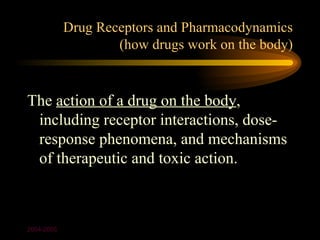
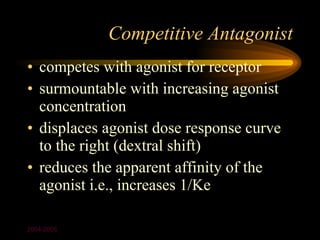
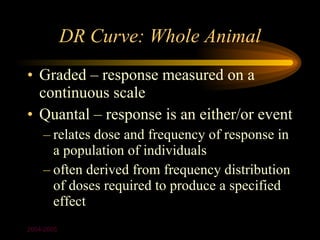
![Drug-receptor interaction
• At equilibrium:
[D] x [R] x k1 = [DR] x k-1
so that: [DR] = k1
[D] [R] k-1
k-1/k1 = dissociation constant (kd)
2004-2005](https://image.slidesharecdn.com/301-lect-1-090704140733-phpapp02/85/Pharmacodynamics-12-320.jpg)
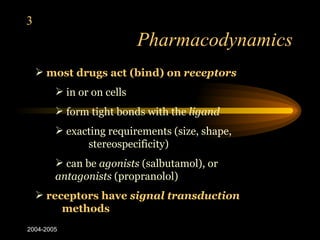
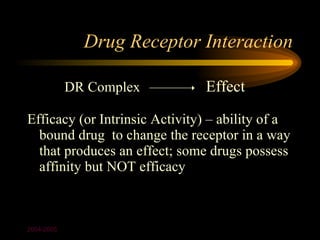
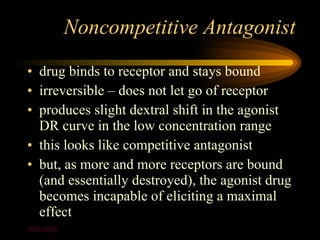
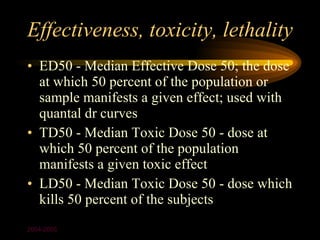
![• At equilibrium:
[D] x [R] x k1 = [DR] x k-1
so that: [DR] = k1
[D] [R] k-1
What can we learn?
k-1/k1 = dissociation constant (kd)
• Ke (k1/k-1) is called the affinity constant
• DR is the response; D is concentration of drug
• when DR = 50 percent (effect is half
maximal), D (or EC50) is equal to kd or the
reciprocal of the affinity constant
• response is a measure of efficacy
• drugs that have parallel dose-response curves
often have the same mechanism of action
2004-2005](https://image.slidesharecdn.com/301-lect-1-090704140733-phpapp02/85/Pharmacodynamics-13-320.jpg)
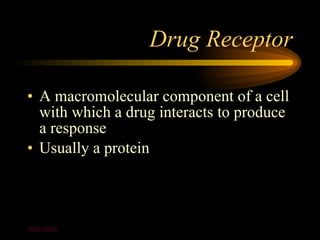
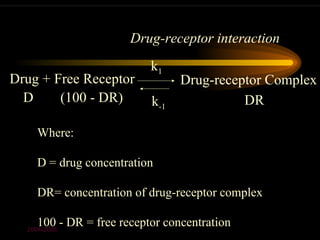
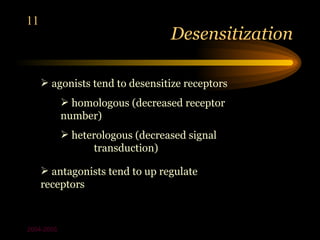
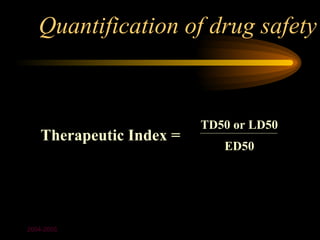
![6
dose response curves-2
effect = α [DR] = Emax * [D]/([D]+EC50) % occupancy
α
Concept: spare
2004-2005
receptors](https://image.slidesharecdn.com/301-lect-1-090704140733-phpapp02/85/Pharmacodynamics-14-320.jpg)


The document discusses pharmacodynamics and how drugs act on the body. It describes how most drugs bind to receptors and the different types of receptors that exist. It explains drug-receptor binding kinetics using equations and graphs of dose-response curves. Different types of drugs are described like agonists that activate receptors, and antagonists that block receptor activation. The key signaling pathways of receptor activation are also summarized.


