Introduction
The performance evaluationof a portfolio is nothing
but checking out whether a target level of activity has been
achieved or not or how well the portfolio has performed in
comparison to other portfolios or market index.
It is an assessment of the functioning of the portfolio,
its risk and return. In fact, the performance evaluation of
portfolio is nothing but evaluating and examining the overall
performance of the portfolio managers/ asset management
companies
3.
Introduction
following reasons:
i. Ithelps the investor to examine how well the manager has
achieved the targeted rate of return.
ii. It enables the investor to examine how well the manager
has achieved the desired targets in comparison to other
portfolios.
iii. It helps to evaluate the performance of investment
decisions in relative terms i.e. per unit of risk.
4.
Introduction
Portfolio performance evaluationcan be viewed as a
feedback and control mechanism that can make the
investment management process more effective. Portfolio
performance is evaluated by measuring and comparing
portfolio return and associated risk.
There are three major methods of assessing performance
1. Return per unit of risk
2. Differential return.
3. Components of performance
5.
Introduction
Key Aspects ofPortfolio Evaluation
1. Performance Measurement
Return Assessment: Calculate the actual returns of the portfolio over
a specific period. This includes both absolute returns and relative
returns compared to a benchmark or index.
Benchmark Comparison: Compare the portfolio's performance
against a relevant benchmark to determine how well it is doing in the
context of the broader market or specific asset class.
6.
Introduction
Key Aspects ofPortfolio Evaluation
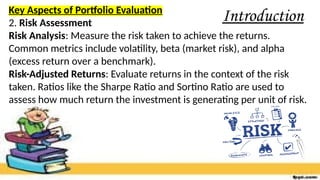
2. Risk Assessment
Risk Analysis: Measure the risk taken to achieve the returns.
Common metrics include volatility, beta (market risk), and alpha
(excess return over a benchmark).
Risk-Adjusted Returns: Evaluate returns in the context of the risk
taken. Ratios like the Sharpe Ratio and Sortino Ratio are used to
assess how much return the investment is generating per unit of risk.
7.
Introduction
Key Aspects ofPortfolio Evaluationa
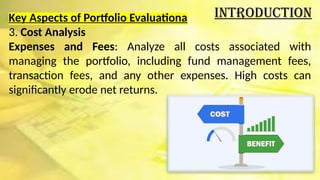
3. Cost Analysis
Expenses and Fees: Analyze all costs associated with
managing the portfolio, including fund management fees,
transaction fees, and any other expenses. High costs can
significantly erode net returns.
8.
Introduction
4. Portfolio Alignment
StrategicAlignment: Check if the
portfolio still aligns with the
initial investment strategy and
objectives.
Life events, economic changes, or shifts in financial goals
may require adjustments to the portfolio strategy.
9.
Measuring Portfolio Return
Therate of return of a portfolio is measured as the sum of
cash received (dividend) and the change in the portfolio
market value (capital gain/loss) divided by the market value
of the portfolio at the beginning of the period.
10.
Risk-adjusted Returns
Theperformance of a fund should be assessed in terms
of return per unit of risk. The funds that provide the
highest return per unit of risk would be considered the
best performer.
For well-diversified portfolios in all asset categories, the
standard deviation is the relevant measure of risk.
When evaluating individual stocks and not so well
diversified portfolios, the relevant measure of risk is the
systematic or market risk, which can be assessed using
the beta co-efficient (b). Beta signifies the relationship
between covariance (stock, market) and variance of
11.
Sharpe’s Ratio
Sharpe’smeasure is called the “Reward-to-Variability”
Ratio. The returns from a portfolio are initially adjusted
for risk-free returns.
These excess returns attributable as reward for investing
A ratio developed by Nobel laureate
William F. Sharpe to measure risk-adjusted
performance.
It is calculated by subtracting the risk-free
rate – such as that of the 10 year US
Treasury bond – from the rate of return for
a portfolio and dividing the result by the
standard deviation of the portfolio returns.
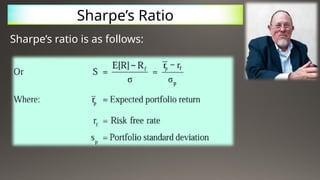
Sharpe’s Ratio
Sharpe’s ratiois as follows:
The Sharpe ratio tells us whether the returns of a portfolio are due to
smart investment decisions or a result of excess risk.
This measurement is very useful because although one portfolio or fund
can reap higher returns than its peers, it is only a good investment if
those higher returns do not come with too much additional risk.
The greater a portfolio’s Sharpe ratio, the better its risk-adjusted
performance will be.
A variation of the Sharpe ratio is the Sortino ratio, which removes the
effects of upward price movements on standard deviation to instead
measure only the return against downward price volatility.
14.
Treynor Portfolio PerformanceMeasure
This measure was developed by Jack Treynor in
1965. Treynor (helped developed CAPM) argues
that, using the characteristic line, one can
determine the relationship between a security and
the market. Deviations from the characteristic line
(unique returns) should cancel out if you have a
fully diversified portfolio.
Treynor’s Composite Performance Measure: He was interested in a
performance measure that would apply to all investors regardless of
their risk preferences. He argued that investors would prefer a CML
with a higher slope (as it would place them on a higher utility curve).
15.
Differential Return
Differentialreturn is a risk-adjusted measure of a
portfolio's performance compared to a benchmark,
representing the difference between the portfolio's risk-
adjusted return and the benchmark's return.
It goes beyond a simple return difference by factoring in
risk, providing a more accurate assessment of whether a
manager's performance was due to skill or simply taking on
more or less risk
16.
Differential Return
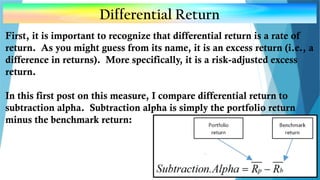
First, itis important to recognize that differential return is a rate of
return. As you might guess from its name, it is an excess return (i.e., a
difference in returns). More specifically, it is a risk-adjusted excess
return.
In this first post on this measure, I compare differential return to
subtraction alpha. Subtraction alpha is simply the portfolio return
minus the benchmark return:
17.
Differential Return
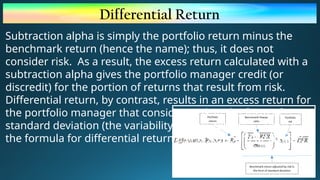
Subtraction alphais simply the portfolio return minus the
benchmark return (hence the name); thus, it does not
consider risk. As a result, the excess return calculated with a
subtraction alpha gives the portfolio manager credit (or
discredit) for the portion of returns that result from risk.
Differential return, by contrast, results in an excess return for
the portfolio manager that considers risk in the form of
standard deviation (the variability of past returns). Here is
the formula for differential return using standard deviation: