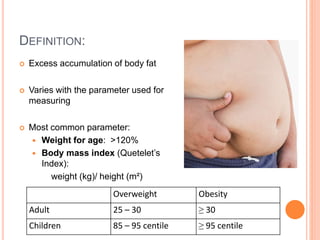
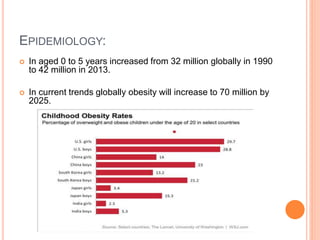
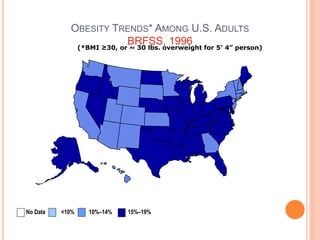
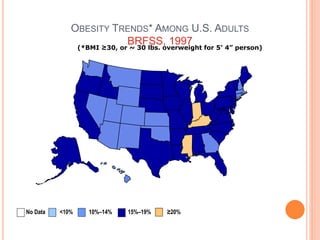
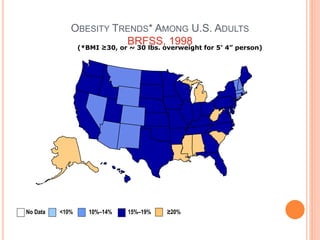
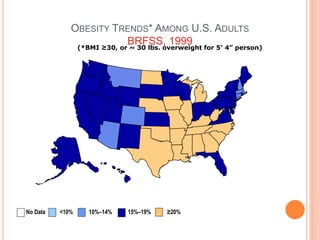
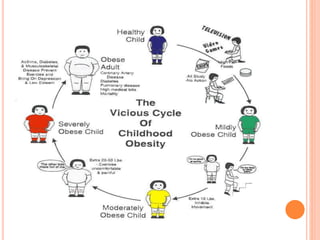
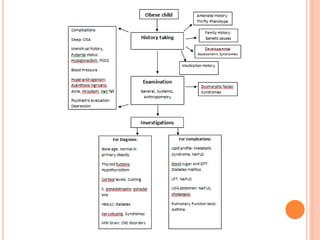
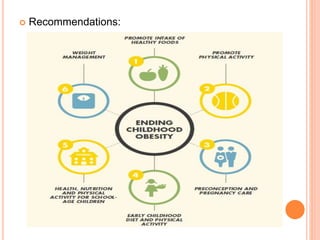
obesity in children , causes of obesity, approach to children obesity, complication of obesity, obesity definition, how to manage obesity, guidelines in pediatric obesity
This is an undergraduate presentation on failure to thrive in Pediatrics. In this presentation I mentioned about Diagnosis, Etiology, Etiology, Diagnostic Evaluation and Management.
https://orcid.org/0000-0001-9306-2267
https://1drv.ms/p/s!Am9GQ5GMX-WyjmOfgcNpov4RewVL
Pamudith Karunaratne
Growth charts in Neonates- Preterm and termSujit Shrestha
Growth charts in Newborn, Preterm and term neonates. All historically used charts in NICU are discussed here.
Presented by Dr Sujit, in Sir Ganga Ram Hospital
Professor Julio Licinio opens the First National Symposium on Translational Psychiatry, 4 -5 April 2011, at The John Curtin School of Medical Research, The Australian National University.
Putting the Health in Healthcare: Partnerships with Hospitals
Hospitals and active transportation advocates are working together to make their communities healthier. Hear from health professionals in Ohio, Pennsylvania and Washington, DC who are linking the healthy lifestyle expertise of hospitals with active transportation facilities.
Presenters:
Presenter: David Pauer Cleveland Clinic
Co-Presenter: Bonnie Coyle St. Luke's University Health Network
Co-Presenter: Elissa Garofalo Delaware & Lehigh National Heritage Corridor
Co-Presenter: Elissa Southward Rails-to-Trails Conservancy
basics about chronic liver disease for a pediatrician. fast and easy guide to common causes of chronic liver diseases in children
Please leave a comment if you like it..
Struggling with intense fears that disrupt your life? At Renew Life Hypnosis, we offer specialized hypnosis to overcome fear. Phobias are exaggerated fears, often stemming from past traumas or learned behaviors. Hypnotherapy addresses these deep-seated fears by accessing the subconscious mind, helping you change your reactions to phobic triggers. Our expert therapists guide you into a state of deep relaxation, allowing you to transform your responses and reduce anxiety. Experience increased confidence and freedom from phobias with our personalized approach. Ready to live a fear-free life? Visit us at Renew Life Hypnosis..
The dimensions of healthcare quality refer to various attributes or aspects that define the standard of healthcare services. These dimensions are used to evaluate, measure, and improve the quality of care provided to patients. A comprehensive understanding of these dimensions ensures that healthcare systems can address various aspects of patient care effectively and holistically. Dimensions of Healthcare Quality and Performance of care include the following; Appropriateness, Availability, Competence, Continuity, Effectiveness, Efficiency, Efficacy, Prevention, Respect and Care, Safety as well as Timeliness.
We understand the unique challenges pickleball players face and are committed to helping you stay healthy and active. In this presentation, we’ll explore the three most common pickleball injuries and provide strategies for prevention and treatment.
QA Paediatric dentistry department, Hospital Melaka 2020Azreen Aj
QA study - To improve the 6th monthly recall rate post-comprehensive dental treatment under general anaesthesia in paediatric dentistry department, Hospital Melaka
Antibiotic Stewardship by Anushri Srivastava.pptxAnushriSrivastav
Stewardship is the act of taking good care of something.
Antimicrobial stewardship is a coordinated program that promotes the appropriate use of antimicrobials (including antibiotics), improves patient outcomes, reduces microbial resistance, and decreases the spread of infections caused by multidrug-resistant organisms.
WHO launched the Global Antimicrobial Resistance and Use Surveillance System (GLASS) in 2015 to fill knowledge gaps and inform strategies at all levels.
ACCORDING TO apic.org,
Antimicrobial stewardship is a coordinated program that promotes the appropriate use of antimicrobials (including antibiotics), improves patient outcomes, reduces microbial resistance, and decreases the spread of infections caused by multidrug-resistant organisms.
ACCORDING TO pewtrusts.org,
Antibiotic stewardship refers to efforts in doctors’ offices, hospitals, long term care facilities, and other health care settings to ensure that antibiotics are used only when necessary and appropriate
According to WHO,
Antimicrobial stewardship is a systematic approach to educate and support health care professionals to follow evidence-based guidelines for prescribing and administering antimicrobials
In 1996, John McGowan and Dale Gerding first applied the term antimicrobial stewardship, where they suggested a causal association between antimicrobial agent use and resistance. They also focused on the urgency of large-scale controlled trials of antimicrobial-use regulation employing sophisticated epidemiologic methods, molecular typing, and precise resistance mechanism analysis.
Antimicrobial Stewardship(AMS) refers to the optimal selection, dosing, and duration of antimicrobial treatment resulting in the best clinical outcome with minimal side effects to the patients and minimal impact on subsequent resistance.
According to the 2019 report, in the US, more than 2.8 million antibiotic-resistant infections occur each year, and more than 35000 people die. In addition to this, it also mentioned that 223,900 cases of Clostridoides difficile occurred in 2017, of which 12800 people died. The report did not include viruses or parasites
VISION
Being proactive
Supporting optimal animal and human health
Exploring ways to reduce overall use of antimicrobials
Using the drugs that prevent and treat disease by killing microscopic organisms in a responsible way
GOAL
to prevent the generation and spread of antimicrobial resistance (AMR). Doing so will preserve the effectiveness of these drugs in animals and humans for years to come.
being to preserve human and animal health and the effectiveness of antimicrobial medications.
to implement a multidisciplinary approach in assembling a stewardship team to include an infectious disease physician, a clinical pharmacist with infectious diseases training, infection preventionist, and a close collaboration with the staff in the clinical microbiology laboratory
to prevent antimicrobial overuse, misuse and abuse.
to minimize the developme
Defecation
Normal defecation begins with movement in the left colon, moving stool toward the anus. When stool reaches the rectum, the distention causes relaxation of the internal sphincter and an awareness of the need to defecate. At the time of defecation, the external sphincter relaxes, and abdominal muscles contract, increasing intrarectal pressure and forcing the stool out
The Valsalva maneuver exerts pressure to expel faeces through a voluntary contraction of the abdominal muscles while maintaining forced expiration against a closed airway. Patients with cardiovascular disease, glaucoma, increased intracranial pressure, or a new surgical wound are at greater risk for cardiac dysrhythmias and elevated blood pressure with the Valsalva maneuver and need to avoid straining to pass the stool.
Normal defecation is painless, resulting in passage of soft, formed stool
CONSTIPATION
Constipation is a symptom, not a disease. Improper diet, reduced fluid intake, lack of exercise, and certain medications can cause constipation. For example, patients receiving opiates for pain after surgery often require a stool softener or laxative to prevent constipation. The signs of constipation include infrequent bowel movements (less than every 3 days), difficulty passing stools, excessive straining, inability to defecate at will, and hard feaces
IMPACTION
Fecal impaction results from unrelieved constipation. It is a collection of hardened feces wedged in the rectum that a person cannot expel. In cases of severe impaction the mass extends up into the sigmoid colon.
DIARRHEA
Diarrhea is an increase in the number of stools and the passage of liquid, unformed feces. It is associated with disorders affecting digestion, absorption, and secretion in the GI tract. Intestinal contents pass through the small and large intestine too quickly to allow for the usual absorption of fluid and nutrients. Irritation within the colon results in increased mucus secretion. As a result, feces become watery, and the patient is unable to control the urge to defecate. Normally an anal bag is safe and effective in long-term treatment of patients with fecal incontinence at home, in hospice, or in the hospital. Fecal incontinence is expensive and a potentially dangerous condition in terms of contamination and risk of skin ulceration
HEMORRHOIDS
Hemorrhoids are dilated, engorged veins in the lining of the rectum. They are either external or internal.
FLATULENCE
As gas accumulates in the lumen of the intestines, the bowel wall stretches and distends (flatulence). It is a common cause of abdominal fullness, pain, and cramping. Normally intestinal gas escapes through the mouth (belching) or the anus (passing of flatus)
FECAL INCONTINENCE
Fecal incontinence is the inability to control passage of feces and gas from the anus. Incontinence harms a patient’s body image
PREPARATION AND GIVING OF LAXATIVESACCORDING TO POTTER AND PERRY,
An enema is the instillation of a solution into the rectum and sig
2. DEFINITION:
Excess accumulation of body fat
Varies with the parameter used for
measuring
Most common parameter:
Weight for age: >120%
Body mass index (Quetelet’s
Index):
weight (kg)/ height (m²)
Overweight Obesity
Adult 25 – 30 ≥ 30
Children 85 – 95 centile ≥ 95 centile
3. Waist circumference
Men > 40inch Women >35 inches
Waist:hip ratio
Indicator for coronary artery diseases in adults
Men >0.9 Women >0.8
6. EPIDEMIOLOGY:
In aged 0 to 5 years increased from 32 million globally in 1990
to 42 million in 2013.
In current trends globally obesity will increase to 70 million by
2025.
7. The vast majority of overweight or obese children
live in developing countries.
India have shown prevalence of overweight 10 – 14
% and obesity in 3 – 6% of pediatric population.
In Chennai > 22% HSE group, 15% from MSE
groups and only 4.5% from LSE group, children
were obese.
Diabetes Res Clin Pract 2002; 57: 185 -190.
8. In affluent schools:
Delhi
31% overweight;
7.5% obese.
Pune
24% overweight.
Chennai
22% overweight.
(Indian Pediatr 2002; 39: 449-452)
(Indian Pediatr 2004; 41: 559-575)
(Diabetes Res Clin Pract 2002; 57: 185-190)
9. OBESITY TRENDS* AMONG U.S. ADULTS
BRFSS, 1991(*BMI ≥30, or ~ 30 lbs. overweight for 5’ 4” person)
No Data <10% 10%–14% 15%–19%
10. OBESITY TRENDS* AMONG U.S. ADULTS
BRFSS, 1992(*BMI ≥30, or ~ 30 lbs. overweight for 5’ 4” person)
No Data <10% 10%–14% 15%–19%
11. OBESITY TRENDS* AMONG U.S. ADULTS
BRFSS, 1993(*BMI ≥30, or ~ 30 lbs. overweight for 5’ 4” person)
No Data <10% 10%–14% 15%–19%
12. OBESITY TRENDS* AMONG U.S. ADULTS
BRFSS, 1994(*BMI ≥30, or ~ 30 lbs. overweight for 5’ 4” person)
No Data <10% 10%–14% 15%–19%
13. OBESITY TRENDS* AMONG U.S. ADULTS
BRFSS, 1995(*BMI ≥30, or ~ 30 lbs. overweight for 5’ 4” person)
No Data <10% 10%–14% 15%–19%
14. OBESITY TRENDS* AMONG U.S. ADULTS
BRFSS, 1996(*BMI ≥30, or ~ 30 lbs. overweight for 5’ 4” person)
No Data <10% 10%–14% 15%–19%
15. OBESITY TRENDS* AMONG U.S. ADULTS
BRFSS, 1997(*BMI ≥30, or ~ 30 lbs. overweight for 5’ 4” person)
No Data <10% 10%–14% 15%–19% ≥20%
16. OBESITY TRENDS* AMONG U.S. ADULTS
BRFSS, 1998(*BMI ≥30, or ~ 30 lbs. overweight for 5’ 4” person)
No Data <10% 10%–14% 15%–19% ≥20%
17. OBESITY TRENDS* AMONG U.S. ADULTS
BRFSS, 1999(*BMI ≥30, or ~ 30 lbs. overweight for 5’ 4” person)
No Data <10% 10%–14% 15%–19% ≥20%
18. OBESITY TRENDS* AMONG U.S. ADULTS
BRFSS, 2000(*BMI ≥30, or ~ 30 lbs. overweight for 5’ 4” person)
No Data <10% 10%–14% 15%–19% ≥20%
19. OBESITY TRENDS* AMONG U.S. ADULTS
BRFSS, 2001(*BMI ≥30, or ~ 30 lbs. overweight for 5’ 4” person)
No Data <10% 10%–14% 15%–19% 20%–24% ≥25%
20. (*BMI ≥30, or ~ 30 lbs. overweight for 5’ 4” person)
OBESITY TRENDS* AMONG U.S. ADULTS
BRFSS, 2002
No Data <10% 10%–14% 15%–19% 20%–24% ≥25%
21. OBESITY TRENDS* AMONG U.S. ADULTS
BRFSS, 2003(*BMI ≥30, or ~ 30 lbs. overweight for 5’ 4” person)
No Data <10% 10%–14% 15%–19% 20%–24% ≥25%
22. OBESITY TRENDS* AMONG U.S. ADULTS
BRFSS, 2004(*BMI ≥30, or ~ 30 lbs. overweight for 5’ 4” person)
No Data <10% 10%–14% 15%–19% 20%–24% 25%–29% ≥30%
23. OBESITY TRENDS* AMONG U.S. ADULTS
BRFSS, 2005(*BMI ≥30, or ~ 30 lbs. overweight for 5’ 4” person)
No Data <10% 10%–14% 15%–19% 20%–24% 25%–29% ≥30%
24. OBESITY TRENDS* AMONG U.S. ADULTS
BRFSS, 2006(*BMI ≥30, or ~ 30 lbs. overweight for 5’ 4” person)
No Data <10% 10%–14% 15%–19% 20%–24% 25%–29% ≥30%
25. OBESITY TRENDS* AMONG U.S. ADULTS
BRFSS, 2007(*BMI ≥30, or ~ 30 lbs. overweight for 5’ 4” person)
No Data <10% 10%–14% 15%–19% 20%–24% 25%–29% ≥30%
26. OBESITY TRENDS* AMONG U.S. ADULTS
BRFSS, 2008(*BMI ≥30, or ~ 30 lbs. overweight for 5’ 4” person)
No Data <10% 10%–14% 15%–19% 20%–24% 25%–29% ≥30%
27. OBESITY TRENDS* AMONG U.S. ADULTS
BRFSS, 2009(*BMI ≥30, or ~ 30 lbs. overweight for 5’ 4” person)
No Data <10% 10%–14% 15%–19% 20%–24% 25%–29% ≥30%
28. OBESITY TRENDS* AMONG U.S. ADULTS
BRFSS, 2010(*BMI ≥30, or ~ 30 lbs. overweight for 5’ 4” person)
No Data <10% 10%–14% 15%–19% 20%–24% 25%–29% ≥30%
30. RISK FACTORS:
Crucial periods
prenatal period
age 5 – 7 years
adolescence.
The point of lowest level of BMI around 6 years
after which it starts increasing is known as adiposity
rebound.
41. COMPLICATIONS:
System In Childhood In adulthood
Metabolic Insulin Resistance,
dyslipidemia, metabolic
syndrome
Type 2 diabetes, metabolic
syndrome
Cardiovascular Hypertension Atherosclerosis, LVH,
hypertension
Respiratory Sleep abnormalities, asthma
Musculoskeletal Tibia vara, slipped capital
femoral epiphysis, flat feet
Osteopenia
Gastrointestinal GERD, NAFLD NAFLD, hernia,
cholelithiasis
Endocrine Early puberty, PCOS Type 2 Diabetes
Psychosocial Low self esteem, depression, anxiety, worsening school
performance, social isolation
Dermatological Cellulitis, acanthosis nigricans, carbuncles, intertrigo
Miscellaneous Raised CRP, pseudotumor cerebri, meralgia paresthetica
42. EVALUATION:
Main aim is to ascertain whether primary or
secondary obesity.
History:
Antenatal history
Birth weight
Weight gain
Sleep pattern
Family history
Medications
Developmental assessment
Menstrual history.
43. Examination:
General and systemic examination
Anthropometry
Blood Pressure
Acanthosis nigricans
Acne
Hirsutism
Hair fall
Dysmorphic facies
Pubertal status
Psychiatric evaluation.
44. Investigations: Routine +
Lipid profile
Glucose tolerance test
Thyroid function
Gonadal axis – serum LH, FSH, testosterone
Bone age assessment
Growth hormone
Serum Parathyroid/ Vitamin D
Serum insulin, Glycosylated Hemoglobin
(HbA1C)
45. MANAGAMENT:
Multidisciplinary approach
Non – pharmacological:
Dietary:
of total calories:
Carbohydrate 45 – 65 %
Protein 10 – 20%
Fat 30 – 40%
Weight monitoring:
≤ 11years= 0.5kg/month
>11 years 1 kg/week
47. Pharmacological:
Antiobesity drugs still being evaluated in children.
Advised only in children >16 years with obesity related
complications.
Only drug approved is Orlistat.
Can be used in ≥12 years
120 mg TDS with each meal or within 1 hour
Same as adult
52. PREVENTION:
Diet:
Exclusive breast feeding
Timely complementary feeding
Healthy feeding practices
No fat restriction to be done in infants < 2 years
For > 2yr, fat contributes 20 – 30 % of calories
Fiber in diet = age + 5g
53. Traffic light diet approach:
Green (go) - fruits and vegetables
Yellow (caution) - grains and processed meat
Red (stop) - sweetened and dried fruits, fried foods
Proper guidance for age appropriate foods
Skipping breakfast, frequent snacking and eating
out to be avoided
54.
55. Lifestyle
and
physical activity:
No TV for < 2 years
> 2 years not >2hr/day
Young child and toddler daily ½ to 1 hr of outdoor
activity
Older child vigorous exercise for 60min/day
56. Behaviour:
Parental motivation
and commitment
No stacking of unhealthy food in house
Setting realistic goals for exercise
Positive reinforcement
Timely monitoring.
57.
58.
59. ENDING CHILDHOOD OBESITY (ECHO)-
WHO COMMISSION:
Goals:
Provide policy recommendations to governments to
prevent infants, children and adolescents from
developing obesity and to identify and treat pre existing
obesity in children and adolescents.
To reduce the risk of morbidity and mortality due to non-
communicable diseases, lessen the negative
psychosocial effects of obesity both in childhood and
adulthood and reduce the risk of the next generation
developing obesity.
61. THE LOSER ?
90 kg
BMI: 33.05
Obese
60 kg
BMI: 22.03
Ideal
62. THE BIGGEST LOSER ?
230 kg
BMI: 75.1
Super Obese
75 kg
BMI: 24.48
Ideal
Thank You
63. REFERENCES:
Gahagan S. Overweight and obesity. In: Nelson textbook of pediatrics. Eds. Kliegman RM,
Stanton BF, Schor NF, Geme JWS, Behrman RE. 20th Edn. Elsevier, Philadelphia, USA. 2015: pp.
307-16.
Ravikumar KG. Acute and chronic complications of Diabetes Mellitus. In: PG Textbook of
Pediatrics. Eds. Gupta P, Menon PSN, Ramji S, Lodha R. 1st Edn. Jaypee, New Delhi, India 2015:
pp. 2384-8
Agarwal KN. Obesity and thinness. In: The Growth: infancy to adolescence. Eds. Agarwal KN. 3rd
Edn. CBS, New Delhi, India 2015: pp 53–72.
Ramachandran A, Snehalatha C, Vinitha R, Thayyil M, Kumar CK, Sheeba L, Joseph S, Vijay V.
Prevalence of overweight in urban Indian adolescent school children. Diabetes Res Clin Pract.
2002; 57(3):185-90.
Bhave S, Bavdekar A, Otiv M. IAP National Task Force for Childhood Prevention of Adult
Diseases: Childhood Obesity. Indian Pediatr. 2004; 41(6):559-75.
Kapil U, Singh P, Pathak P, Dwivedi SN, Bhasin S. Prevalence of obesity amongst affluent
adolescent school children in delhi. Indian Pediatr. 2002;39(5):449-52.
The Behavioral Risk Factor Surveillance System (BRFSS) 1991 to 2010
Fall CH. The fetal and early life origins of adult disease. Indian Pediatr. 2003; 40(5):480-502.
Lustig RH. Hypothalamic obesity after craniopharyngioma: mechanisms, diagnosis, and
treatment. Front Endocrinol 2011;2:60.
Report of the WHO commission on Ending Childhood Obesity (ECHO) published January 2016.<
http://apps.who.int/iris/bitstream/10665/204176/1/9789241510066_eng.pdf?ua=1>