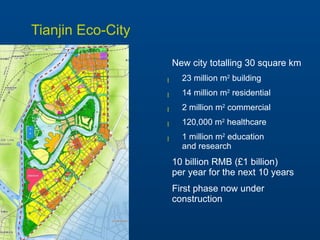
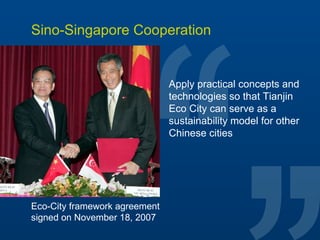
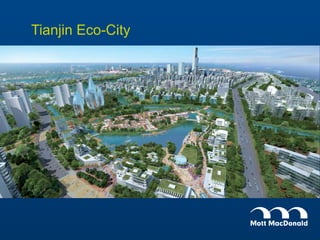
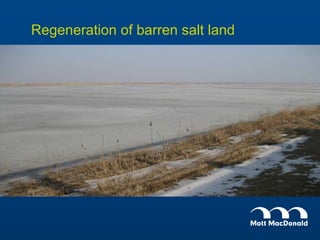
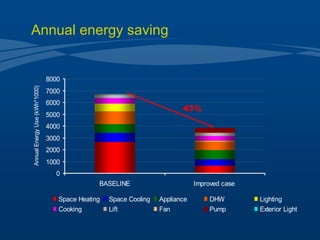
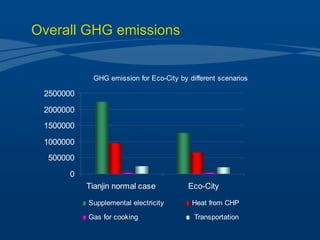
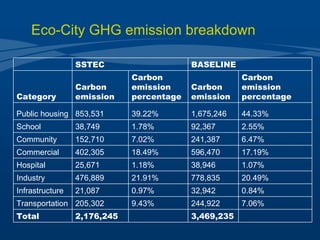
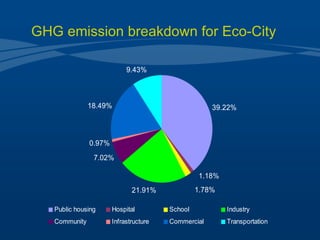
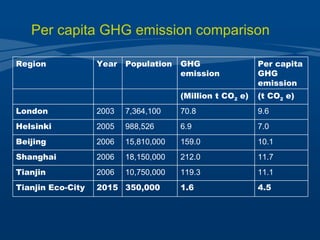
Tianjin Eco-City  A blueprint for China’s cities
Bohai Rim China – cities and population Beijing, 17.5M Tianjin, 11.7M Qingdao, 7.6M Shenyang, 7.7M Tangshan, 7.1M Dalian, 6.2M Jinan, 5.9M Weihai, 2.6M Beijing Tianjin
Tianjin city
Tianjin municipality – Bohai Rim One of China’s four municipalities China’s 3rd largest city Economy based on heavy manufacturing and the seaport A region of high average disposable income Special development zone with excellent transportation infrastructure Bohai Rim
Tianjin municipality Bohai Rim Industrial Ports Leisure CBD Tianjin Eco City
Tianjin Eco-City New city totalling 30 square km 23 million m 2  building 14 million m 2  residential 2 million m 2  commercial 120,000 m 2  healthcare 1 million m 2  education  and research 10 billion RMB (£1 billion)  per year for the next 10 years First phase now under construction
Sino-Singapore Cooperation Apply practical concepts and technologies so that Tianjin Eco City can serve as a sustainability model for other Chinese cities Eco-City framework agreement  signed on November 18, 2007
Tianjin Eco-City
Regeneration of barren salt land
Mott MacDonald’s role Implementation and institutional planning Financial Planning Green buildings Green transportation
A robust set of KPIs Proportion of green trips Overall recycling rate Usage of renewable energy Carbon emission per unit GDP Proportion of green buildings Per capita daily water consumption Per capita daily domestic waste generation
Green transport 90% green transport Creation of internal jobs Integration of road, public transport, walk, cycle networks and neighbourhood design High quality rapid transit services connecting  Eco-City to Tianjin, Binhai and other external employment centres
Green transport Developing a public transport system Providing the first step in the phased development  of the overall public transport system for Eco-City Focusing on bus transport including Bus Rapid Transit  Using Bus Rapid Transit on the metro alignment  until metro arrives
Bespoke Green Building Evaluation Standard, published in 2006 and now being enhanced Recognising the power of demonstration projects Green buildings
569 units  Low cost housing for sale  An energy efficiency exemplar Sold out ‘off-plan’ Low energy public housing
Improved envelope High efficiency lighting and control Elevator regeneration  Water saving fittings Water heating by solar thermal Solar power on façade or roof (PV) Outside air automatic control Intelligent metering system and indication of energy use Specific measures
Annual energy saving 43%
Overall GHG emissions
Eco-City GHG emission breakdown   SSTEC BASELINE  Category Carbon emission Carbon emission percentage Carbon emission Carbon emission percentage Public housing 853,531 39.22% 1,675,246 44.33% School 38,749 1.78% 92,367 2.55% Community 152,710 7.02% 241,387 6.47% Commercial 402,305 18.49% 596,470 17.19% Hospital 25,671 1.18% 38,946 1.07% Industry 476,889 21.91% 778,835 20.49% Infrastructure 21,087 0.97% 32,942 0.84% Transportation 205,302 9.43% 244,922 7.06% Total 2,176,245   3,469,235  
GHG emission breakdown for Eco-City
Per capita GHG emission comparison Region  Year Population  GHG  emission  Per capita GHG emission (Million t CO 2  e) (t CO 2  e)   London 2003   7,364,100   70.8   9.6 Helsinki 2005   988,526   6.9   7.0   Beijing 2006   15,810,000   159.0   10.1   Shanghai 2006   18,150,000   212.0   11.7   Tianjin 2006   10,750,000   119.3   11.1   Tianjin Eco-City 2015  350,000   1.6 4.5
The future in China Increasing Application of…  National Green Building Standard for Shanghai EIA law Water Pollution Prevention and Control Law  Environment Water Quality Standard (GB  3838-2002)  National Hazardous Waste Inventory Law of Renewable Energies
www.mottmac.com

Paul lengthorn presentation gif

  • 1.
    Tianjin Eco-City A blueprint for China’s cities
  • 2.
    Bohai Rim China– cities and population Beijing, 17.5M Tianjin, 11.7M Qingdao, 7.6M Shenyang, 7.7M Tangshan, 7.1M Dalian, 6.2M Jinan, 5.9M Weihai, 2.6M Beijing Tianjin
  • 3.
  • 4.
    Tianjin municipality –Bohai Rim One of China’s four municipalities China’s 3rd largest city Economy based on heavy manufacturing and the seaport A region of high average disposable income Special development zone with excellent transportation infrastructure Bohai Rim
  • 5.
    Tianjin municipality BohaiRim Industrial Ports Leisure CBD Tianjin Eco City
  • 6.
    Tianjin Eco-City Newcity totalling 30 square km 23 million m 2 building 14 million m 2 residential 2 million m 2 commercial 120,000 m 2 healthcare 1 million m 2 education and research 10 billion RMB (£1 billion) per year for the next 10 years First phase now under construction
  • 7.
    Sino-Singapore Cooperation Applypractical concepts and technologies so that Tianjin Eco City can serve as a sustainability model for other Chinese cities Eco-City framework agreement signed on November 18, 2007
  • 8.
  • 9.
  • 10.
    Mott MacDonald’s roleImplementation and institutional planning Financial Planning Green buildings Green transportation
  • 11.
    A robust setof KPIs Proportion of green trips Overall recycling rate Usage of renewable energy Carbon emission per unit GDP Proportion of green buildings Per capita daily water consumption Per capita daily domestic waste generation
  • 12.
    Green transport 90%green transport Creation of internal jobs Integration of road, public transport, walk, cycle networks and neighbourhood design High quality rapid transit services connecting Eco-City to Tianjin, Binhai and other external employment centres
  • 13.
    Green transport Developinga public transport system Providing the first step in the phased development of the overall public transport system for Eco-City Focusing on bus transport including Bus Rapid Transit Using Bus Rapid Transit on the metro alignment until metro arrives
  • 14.
    Bespoke Green BuildingEvaluation Standard, published in 2006 and now being enhanced Recognising the power of demonstration projects Green buildings
  • 15.
    569 units Low cost housing for sale An energy efficiency exemplar Sold out ‘off-plan’ Low energy public housing
  • 16.
    Improved envelope Highefficiency lighting and control Elevator regeneration Water saving fittings Water heating by solar thermal Solar power on façade or roof (PV) Outside air automatic control Intelligent metering system and indication of energy use Specific measures
  • 17.
  • 18.
  • 19.
    Eco-City GHG emissionbreakdown   SSTEC BASELINE Category Carbon emission Carbon emission percentage Carbon emission Carbon emission percentage Public housing 853,531 39.22% 1,675,246 44.33% School 38,749 1.78% 92,367 2.55% Community 152,710 7.02% 241,387 6.47% Commercial 402,305 18.49% 596,470 17.19% Hospital 25,671 1.18% 38,946 1.07% Industry 476,889 21.91% 778,835 20.49% Infrastructure 21,087 0.97% 32,942 0.84% Transportation 205,302 9.43% 244,922 7.06% Total 2,176,245   3,469,235  
  • 20.
  • 21.
    Per capita GHGemission comparison Region Year Population GHG emission Per capita GHG emission (Million t CO 2 e) (t CO 2 e) London 2003 7,364,100 70.8 9.6 Helsinki 2005 988,526 6.9 7.0 Beijing 2006 15,810,000 159.0 10.1 Shanghai 2006 18,150,000 212.0 11.7 Tianjin 2006 10,750,000 119.3 11.1 Tianjin Eco-City 2015 350,000 1.6 4.5
  • 22.
    The future inChina Increasing Application of… National Green Building Standard for Shanghai EIA law Water Pollution Prevention and Control Law Environment Water Quality Standard (GB 3838-2002) National Hazardous Waste Inventory Law of Renewable Energies
  • 23.

Editor's Notes

  • #5 Economy based on heavy manufacturing and the seaport A region of high average disposable income Bohai Rim special development zone with excellent transportation infrastructure
  • #11 Implementation and Institutional Planning GHG emissions monitoring and estimation Financial Planning Training and capacity building Monitoring of KPIs Green Buildings The increased cost of green building The enhancement and implementation of green building guidelines Green Transportation How to implement and achieve the KPIs
  • #12 Proportion of Green Trips Overall Recycling Rate Access to Free Recreational and Sports Amenities Waste Treatment Barrier-Free Accessibility Services Network Coverage Proportion of Affordable Public Housing Usage of Renewable Energy Usage of Water from Non-Traditional Sources Proportion of R&D Scientists and Engineers in the Eco-city Workforce Employment-Housing Equilibrium Index Ambient Air Quality Quality of Water Bodies within the Eco-city Quality of Water from Taps Noise Pollution Levels Carbon Emission Per Unit GDP Net Loss of Natural Wetlands Proportion of Green Buildings Native Vegetation Index Per Capita Public Green Space Per Capita Daily Water Consumption Per Capita Daily Domestic Waste Generation
  • #19 Tianjin Baseline Normal practice in Tianjin (national standards) Eco-City scenario 20% renewable energy site wide Residential and education buildings improved to energy efficiency exemplars Other buildings to minimum Eco-City standards