2. Z.H. Gu et al. / Sustainable Cities and Society 7 (2013) 52–61 53
Generation Distribution Utilisation
(Energy consumer)
Transportation
Buildings
Industry
(Energy resource) (Energy carrier)
Fossil fuels:
O
C
i
o
l
al Fuel oil (
k
P
e
e
r
t
o
r
s
o
e
l
,
n
d
e
i
)
e
sel fuel,
Natural gas
N
C
at
o
u
a
r
l
a
g
l
a
g
s
as
Renewable energy
H
:
y
S
d
o
r
la
o
r
po
p
w
ow
er
er
W
Bio
in
m
d
a
p
s
o
s
w
en
er
ergy
G
Ti
e
d
o
a
t
l
h
e
e
n
rm
er
a
g
l
y
energy
…
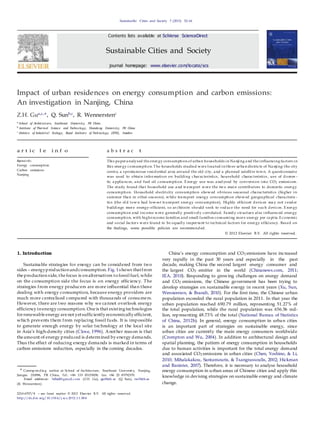
Fig. 1. Diagram of energy flow from generation to utilisation, showing that fossil fuels cannot be quantified at the consumption side of the chain.
Source: Made by Zhenhong Gu).
Roughly a billion Chinese (or more than 90% of the population)
live in only a little more than 30% of China’s land area (Heilig,
1999). Fig. 2 illustrates the geographical concentration of the Chi-
nese population and the increasing concentration of population in
the eastern portion of the country since its rapid growth began in
the mid-20th century (Wang & Wei, 2010).
Apart from a few megacities such as Beijing, Shanghai,
Chongqing and Guangzhou with a population of over 10 million,
the majority of China’s major cities, i.e. provincial capitals and cities
specially designated in the state plan, have a population of 5–10
million. With 8 million permanent population on 11 November
2010, Nanjing, the capital city of Jiangsu Province and located in the
Yangtze River delta region, is a representative large city (Nanjing
Statistic Bureau, 2010). Nanjing City is located at 32◦
02,
38,,
N,
118◦
46,
43,,
E, in a region where the coldest monthly temperature
in January is 2.4 ◦
C and the hottest monthly temperature in July
is 27.8◦
C, with an annual average of around 15.5◦
C. The average
relative humidity is 77% (CDC, 2011). Fig. 3 shows mean monthly
temperature in Nanjing during the period 1971–2001.
In general, China can be divided into seven zones according to
climate characteristics (Fig. 4). The climate in Nanjing is charac-
terised by hot summers and cold winters, the typical weather in
Zone III in Fig. 4 (Ministry of Construction of China, 1993). The col-
dest month of the year is January, with an average temperature of
2.4◦
C, and the hottest month is July, with an average temperature
of 27.8 ◦
C. As in Zone II, both indoor cooling in summer and heating
in winter are needed in Nanjing according to national standards
(Ministry of Construction of China, 1993).
Before China’s reform and opening-up policy in1978, most resi-
dential buildings were constructed in the former Soviet Union style
to meet basic living needs (Ma, 2002). However, most of these old
buildings have now been reformed or replaced and it is difficult to
find any surviving examples.
In the period 1976–1990, new residential buildings were con-
structedtomeet higherlivingstandards, butsuchdevelopment was
mainly restricted to the old city, an area of 44.65 km2
within the
MingDynastycity wall(NanjingUrbanPlanningBureau,2006a).In
the 1990s, some large residential communities, e.g. Longjiang and
Zhongbao, weredevelopedoutside Nanjing’s oldcity withoutcare-
fulplanning.Thelack of businessand commercial buildingsmeans
thatthe residentsof theseareas haveto work inNanjing downtown
(Yeh and Yuan, 1986).
After 2000, new satellite towns and residential areas began to
be developed outside the old city and urban planning was applied
appropriately in this development (Nanjing Local Chronicles
Compilation Committee, 2011). Hexi is a new town that was
planned to be the second centre of Nanjing due to its location
close to the old town. The first two of Nanjing’s subways were
constructed across this area, and many business and commercial
buildings were planned for the central area of Hexi (Nanjing Urban
Planning Bureau, 2006b). A large quantity of residential communi-
ties were planned and constructed in Hexi during the first decade
of the 21st century.
Our survey on energy consumption was carried out in three
different urban areas, representing the three phases of residential
development in Nanjing since 1978. These areas were: Zhujiang
Road(Site A)intheoldcity,Longjiang area(SiteB) intheunplanned
residential area, and Hexi area (Site C) in the planned satellite
town (Fig. 2). Basic information about the households and their
energy consumption was collected in the three areas. Various
Fig. 2. Changes in population density in China showing an obvious trend of population concentration in eastern coastal region s ( Wang & Wei, 2010,). (a) Density in 1949;
(b) density in 2000; and (c) densit y in 2020 (projected) .
3. 54 Z.H. Gu et al. / Sustainable Cities and Society 7 (2013) 52–61
Temperature (ºC)
40.0
35.0
30.0
25.0
20.0
15.0
10.0
5.0
0.0
-5.0
-10.0
-15.0
Av erage Temperature (ºC)
Highest Temperature (ºC)
Lowest Temperature (ºC)
Jan. Feb. March April May June July Aug. Sep. Oct. Nov. Dec.
Fig. 3. Mean monthly temperature in Nanjing, 1971–2001 (CDC, 2011).
Fig. 4. Climate zones I–VII in China.
Source: Ministry of Construction of China (1993)
Fig. 5. Location of study sites A–C and examples of streets and buildings at each site. (a) Site location s; (b) Zhujiang Road, Site A; (c) Longjian g area, Site B; and (d) Hexi area,
Site C.
Source: Made by Zhenhong Gu.
4. Z.H. Gu et al. / Sustainable Cities and Society 7 (2013) 52–61 55
Table 1
Comparison of per capita CO2 emissions.
CO2 emission s from
electricity (kg)
CO2 emission s from
natural gas (kg)
CO2 emission s
from petrol (kg)
Total CO2
emission s (kg)
Site A
Site B
Site C
Average
1144.5
1100.9
1192.5
1144.7
48.7
57.7
58.6
54.9
540.1
610.1
1188.2
768.7
1733.3
1768.7
2439.3
1968.3
characteristics relating to urban living, such as climate, geographi-
cal, architectural, economic and social factors, and their impacts on
energy consumption, were analysed (Fig. 5).
consumption wasestimated bymultiplyingtheaveragepetrol con-
sumption per kilometre by the total driving distance. For those
using public transport, energy consumption was calculated using
the average fuel efficiency of public transport and travel distance
(IPCC, 2006).
In order to relate the data to the discussion on climate change,
the amount of energy consumed was further converted into CO 2
emissions using the IPCC carbon emissions calculation formula
(2006edition)(IPCC, 2006).It wasconcludedthatthe IPCCformula
was the best available option for this study, although a field-tested
formula would have been more accurate.
A problem is there is no one-to-one correspondence between
energy consumption and CO2 emissions, since they are the result
of many factors that act to increase emissions together with fac-
tors that act to reduce emissions. Much work has been done onthe
break-down of changes in energy use or emissions using indices
(Liu,Ang,&Ong,1992;Greening,Davis,Schipper,&Krushch,1997;
Schipper, Haas, & Sheinbaum, 1996; Shorrock, 2000). However,
theyrelatetoagiventimeandplace. Here,theIPCCcarbonemission
calculation formula was used to convert three types of energy car-
riers (IPCC, 2006). Although they are not field test data, the carbon
emissions from energy consumption are generally accurate.
2. Aims andobjectives
The aims of the present study were to survey the energy use
of households in Nanjing, and to identify the factors influencing
urban residential energy consumption. The factors examined were
climate, geographical, architectural, economic and social.
Climate and geography factors are technical factors, while the
others are non-technical factors. Since energy issues are of a tech-
nical nature, it is obvious that technical factors are being discussed
widely at present. However, the influence of non-technical fac-
tors is also important. This study therefore analysed both types of
factors.
The intention was to use the findings to assess the consequences
of some actions and recommend possible strategies promoting res-
idential energy efficiency. Although the strategies may be political,
social, economic and technical, the study focused mainly onarchi-
tectural and urban planning strategies.
3. Methodology
4. Resultsanddiscussions
The survey was carried out by researchers and students from
the Architectural School, Southeast University, in2011. Inall, 1500
questionnaires were randomly distributed in the three areas (500
in each) and the total number of valid returns was 77, representing
204 inhabitants (Site A 26 valid returns, representing 70 inhabi-
tants, Site B 28 valid returns, representing 74 inhabitants, Site C 23
valid returns, representing 60 inhabitants). The response rate was
thus 5.1% in total. These valid answers were used in this study.
Three sample answers to the questionnaire, one for eachsite, are
provided in Table 4. The questionnaire consisted of two sections,
asking for basic information about the household and details of its
energy consumption.
Thus the first section contained questions on type of housing,
number of household members, their age and income, distance to
work and means of transport, and main household appliances.
The second section of the questionnaire explored the main use
of energy. Interms of fuel categories many types of energy carriers
were considered, but only three types are actually used by respon-
dents: electricity, natural gas and petrol. Electricity was the chief
energy carrier, data on whichwere acquired from their bi-monthly
electricitybills(metre reading occurs every twomonths inNanjing)
from January to November 2010. Electric energy use was then cal-
culated interms of kilowatt-hours per household over a period of
one year.Coalandliquefiedpetroleum gaswere oncethemainfuels
for domestic cooking, but today they are usually used incommer-
cial boilers. Natural gas is currently the main source of energy for
domestic cooking in Nanjing and data on natural gas consumption
wereobtainedfromtheeastareaofSichuanprovince(NanjingLocal
Chronicles Compilation Committee, 2011). Petrol is the dominant
fuel used for private vehicles in China, while diesel, compressed
natural gas and liquefied petroleum gas are more often used for
public transport in Nanjing (Zhu, 2010). The amount of petrol
Many attempts have been made to model energy consump-
tion at residential and household level (Permana, Perera, & Kumar,
2008). Unfortunately, the models usually describe and forecast
electricity demand rather than total household energy consump-
tion. Inclusion of transport energy and cooking energy in a
household’s energy consumption is too complicated to be mod-
elled. However, in this study we tried to include all of these and
analyse the dominant features.
4.1. General state of energy consumption and CO2 emissions
The CO2 emissions per capita of the respondents for household
and transport amounted to 1.97 t in 2010, of which the CO2 emis-
sionsfrom electricityconsumptioncomprised1.15t(58%)(Table1).
Per capita CO2 emissions from natural gas consumption were 0.05t
(3%) and from petrol consumption 0.77t (39%).
Thelowest percapitaannual electricity consumption ofafamily
was 572.1 kWh and the highest was 2369.8 kWh, which was more
than 4.1-fold greater than the lowest. The lowest per capita annual
natural gas consumption of a family was 4M3 and the highest was
43.5 M3
, 10.9-fold greater than the lowest. The lowest per capita
annualpetrol consumption ofafamily was59L andthe highest was
750 L, about 13-fold greater than the lowest. Overall, the lowest per
capita annual CO2 emissions of a family was 0.85 t and the highest
was 3.94 t, 4.6-fold greater than the lowest. Thus the difference in
petrol and natural gas consumption between the highest and low-
est consumers was much greater than the difference in electricity
consumption.
The Human Development Report 2007/2008 (UNDP, 2008)
reported that per capita energy-related CO2 emissions in China
were 4.3 t in 2007 and it forecast that by 2015, these emissions
5. 56 Z.H. Gu et al. / Sustainable Cities and Society 7 (2013) 52–61
kWh
1000.0
900.0
800.0
700.0
600.0
500.0
400.0
300.0
200.0
100.0
0.0
761.5 754.
Av erage
Site A
Site B
Site C
2
469.0
10 Jan. - 9 Mar. 10 Mar. - 9 May 10 May - 9 July 10 July - 9 Sep. 10 Sep. - 9 Nov. 10 Nov. - 9 Jan.
Fig. 6. Electricity consumption (kWh) per household in different seasons (kWh). Summer = July–September.
would have increased to 5.2 t per capita. Considering the low car-
bonemissions (2 t CO2 per capita) in rural areas, the CO2 emissions
in urban areas in that year must have been at least 6.6 t per capita,
as China has approximately equal numbers of rural and urban
residents (National Bureau of Statistics of China, 2012a). There-
fore, about 30% of total urban CO2 emissions inNanjing were from
domestic appliances in households and transport by residents.
For reference, in 2007 CO2 emissions per capita were 9.95 t for
Shanghai (not including ship and air transportation) (Liang, Liu, &
Peng, 2010). In the same year, the CO2 emissions per capita were
23.73 t in Wuxi city (including all industry and transportation),1
6–10% of which were from goods transport, 40% from passenger
transport and 3–5% from households (Wang, Zhang, & Bi, 2011).
Hence total carbon emissions from residences were 5.4–9% or 1.28–
2.13 t in Wuxi, which matched our data for Nanjing.
than that at Site B. A plausible explanation is that the households
at Site C used more appliances to get a more comfortable living
climate. A detailed analysis of this is provided in Sections 4.4 and
4.5.
4.3. Geographical factors
Location of the home in relation to work was clearly an
important factor influencing a household’s transport energy con-
sumption. Fig. 7 shows CO2 emissions per capita in the different
areas. Site A had the lowest transport-related emissions, about 71%
of those at Site C, which had the highest transport emissions. How-
ever, electricity and natural gas consumption showed only small
differences between the different sites. The main difference was in
petrol consumption, where that at Site C was 220% of that at Site A
and 194.8% of that at Site B. This shows that location has animpor-
tant influence on residents’ energy consumption for transport.
Energy use for transport was greater in the satellite town (Site
C) than in the old town (Site A). The CO2 emissions from transport
accounted for 31% of total CO2 emissions at Site A, 35% at Site B,
and 49% at Site C. The greater the distance from the city centre, the
higher the proportion of transport energy consumption. Although
significant local services and subways were planned and installed
in Hexi, the long distance to the downtown area still required more
vehicle use than for residential areas in, or close to, the old city.
Mixed function is a frequently used planning strategy to reduce
transport requirements. Theoretically, anarea withmixed residen-
tial, business, commercial and service functions is able to radically
reduce transport energy consumption. This study found that there
were almost zero transport energy requirements for travelling to
work places in the downtown area. However, this is a special or
evenexceptionalcase.Althoughall respondentswantedtolive near
their workplace, in most cases they had to live in the new town
because of the high price of properties in the city centre, where
4.2. Climate factors
Climate is one of the most important factors influencing house-
hold electricity consumption. As a sub-tropical city, Nanjing’s
electricity consumption shows clear season changes. Fig. 3 shows
bi-monthly electricity consumption per household. Inline withthe
mean monthly temperature in Nanjing, electricity consumption
showed accompanying seasonal trends. Electricity consumption
in summer (July–September) was almost twice that in spring and
autumn, and also considerably higher than that in winter (Fig. 6).
It was obvious that electricity consumption over the normal level
was used for cooling in summer and heating in winter. It can be
inferred that energy consumption for cooling and heating as a pro-
portion of total electricity consumption was about one-seventh
(14%), which was far below the proportion indeveloped countries
(50–60%) (GU, Vestbroc, Wennerstena, & Assefaa, 2009). How-
ever, withanimproved standard of living, heating and cooling will
consume more electricity, and the potential energy reduction for
air-conditioning will exceed that of other household appliances.
Thus reducing the use of air-conditioning and improving the per-
formance of air-conditioning equipment should be key concerns in
designing energy-efficient buildings.
Although climate is the main factor in the seasonal variation
in household electricity consumption, it cannot explain the dis-
tinct rise in consumption in the satellite town (Site C) in summer,
whereas it was less than in the spontaneously formed residential
area (Site B) in other seasons. By rights, the buildings inthe satellite
town should be energy-efficient owing to their better insulation
and air-tight windows. In other words, to achieve an acceptable
indoor climate, the electricity consumption at Site C should be less
kg CO2
3000.0
2500.0
2000.0
Petrol
Naturalgas
Electricity
1500.0
1000.0
500.0
0.0
Average Site A Site B Site C
1
Wuxi is an industrial city near Nanjing. It has a similar level of economic devel-
opment and climate to Nanjing.
Fig. 7. CO2 emissions per capita with respect to location for the different energy
carriers studied.
893.1
0
6
37. 3
6
593.0
.
44.
0
5
5
84.5
610.3
550
502.2 487.6
442.5 433.9
452.4 .7
478.6
5
51.
4
8
98.
5
0
47.
3
91. 5
418.8
4
50 446.2
3
90.9
6. Z.H. Gu et al. / Sustainable Cities and Society 7 (2013) 52–61 57
Table 2
Comparison of per capita electricity consumption (kWh) according to dwelling floor
area and construction period.
somewhat energy-efficient owing to the new thermal construction,
butthisbroughtanimprovement ofonly10%electricitysaving.The
reasonisthe residents’self-discipline inusing cooling/heatingsys-
tems. According to JGJ 134-2001, the CDD26 (cooling degree-days
based on26 ◦
C) of Nanjing is 175, and the annual cooling electricity
consumption is 24.9 kWh/m2
. However, the highest cooling elec-
tricity consumption of the respondents in this study was about
9.5kWh/m2
, which wasfar belowthestandard. Thisdoes notmean
that the indoor climate was poor, but rather that the residents usu-
ally only turned on their air-conditioning when the temperature
exceeded 28 ◦
C. The energy-saving performance due to thermal
insulation of external walls usually depends onthe reference value
and only when the reference value is large will the energy savings
be effective. Because the residents paid for space heating and cool-
ing according to their actual energy usage, they tended to avoid
turning on the heating and cooling devices when it was not very
necessary. Hence the actual energy consumption fo r heating and
cooling was much lower than the reference value and the thermal
insulation of external walls was not as effective as the theoretical
value.
However, whileelectricityconsumptionfor heating and cooling
was not the major contributor to total electricity consumption in
the households surveyed, it is increasing rapidly in Chinese cities
(Gu et al., 2009). If measures to improve the thermal performance
of all residential buildings are not introduced, heating and cooling
will consume more electricity in the future.
Residential buildings usually do not have central heating and
cooling systems inthe hot summer and cold winter area of China.
There are a few so-called high-end residential communities with
central heating and cooling systems inNanjing. They installed cen-
tral heating and cooling systems that were designed not for energy
efficiency, but for thermal comfort. For instance, inLandsea Inter-
national Block, a famous ‘green’ residential community in Hexi,
the cooling energy consumption in 2010 was 27 kWh/m2
(Meng,
Zhang, Yang, & Yang, 2011), which was almost three times that of
our respondents. Although central systems have higher coefficient
of performance (COP), they cannot adapt to the radical energy fluc-
tuations in residential buildings (Zhang, Wang, & Yuan, 2007). In
many cases,the heating and cooling systems are idling, which coun-
teracts their high COP. Incomparison, household air-conditioning
units have lower COP, but they have the flexibility to adapt to
all kinds of requirements in residential buildings. One problem of
householdair-conditioning isthatthe architectural design mustset
aside space for the outdoor component of air-conditioning units
(Fig. 8).
Energy efficiency of buildings does not rely on the excessive
pursuit of high COP building devices, but on reducing the use of
energy-consuming devices within the buildings, which should be
the main focus of architectural design.
Floor area (m2) Before 2000 2001–2005 2006–2011 Total
<30
31–60
>60
All
1005.0
1090.8
–
1062.2
1403.4
1184.4
1671.6
1343.5
1140.8
906.4
1507.3
1167.5
1124.2
1087.2
1589.4
most companies and businesses are located. At the same time, with
the increase in land value in the city centre, more and more resi-
dential functions are being replaced by commercial and business
functions. Since 2005, there have been very few new residential
projects built inthe old town, and most new development projects
there have been commercial and business buildings. These more
single-function districts will aggravate the transport problems. In
the 1990s, some city planning experts presented the concept of
a ‘compact city’ to counteract infinite expansion by the intensive
use of urban space (Jenks et al., 1996). The original intention of
the compact city was to solve the problem of urban sprawl arising
from rapid population growth. Today the compact city theory is
being developed into a paradigm of sustainable urban form.
The right path may be approached from two aspects: on the
one hand, reversing the trend of removing residential functions
from the old town; on the other hand, supplying commercial and
business function in the residential communities in the new town.
4.4. Architectural factors
Since the energy consumption of residences was the main
object of the study, the architectural design of buildings must
be mentioned. The relationship between thermal performance
of a building and electricity consumption is a common problem
encountered by architects (Gu et al., 2009).
Most buildings at Site A were constructed before 2000, when
China had no regulations onthe thermal performance of buildings
in this climate zone. There were no heat insulation measures used
inthose buildings. Once the Ministry of Construction of P.R. China
(2001) issued its “Design standard for energy efficiency of residen-
tialbuildingsinHotSummerandCold Winter Zone(JGJ134-2001)”,
the first residential buildings with insulation were built in Nan-
jing in November 2003 (Zhang, 2006). Architects were involved in
designing more energy-efficient buildings. Most buildings at Site B
constructed during that period had basic heat insulation measures.
After 2006, almost all the new residential buildings had thicker
external wall insulation and double-glazed windows in order to
meet the requirements on thermal performa nce in new building
regulations (Nanjing Municipal Government, 2006). Most buildings
at Site C were constructed during that period.
Table 2 shows per capita electricity consumption according to
dwelling floor area and construction period. No dwellings were
built after 2005 at Site A and none before 2000 at Site C. As a result,
the dwellings at Site A were smaller than those at Site C. Before
2000, residential units larger than 60 m2
per capita were so rare
that the data on these are not statistically representative. Gener-
ally, larger units consume more electricity. Therefore, limiting the
per capita floor area may be as important as improving building
thermal performance. However, the smallest units were not the
most electricity-efficient because of the threshold effect – only one
or two householders lived inthese dwellings but they had to oper-
ate the entire electrical system. Almost all the buildings built before
2000 were compact because of the narrow plots in the downtown
area, while the buildings built after 2001 were more spacious as
land was not as restricted, which explains the greater electricity
consumption after 2001. The buildings built after 2006 were more
4.5. Economic factors
As mentioned above, climate cannot explain the higher electric-
ity consumption inthe satellite town (Site C) insummer. By rights,
the buildings in the satellite town should be electricity-efficient,
with their better insulation and air-tight windows. That is to say,
to get the same indoor climate, electricity consumption at Site C
should be less than that at Site B. A plausible explanation for the
unexpected higher electricity consumption is that the households
at Site C used more appliances to get a higher level of indoor com-
fort.
Income is an important factor for energy consumption. As
income rises, energy consumption tends to increase, as numerous
studies have confirmed(Chern, Ishibashi, Taniguchi,& Tokoyama,
2003; Lahiri, Babiker, & Eckaus, 2000). Table 3 shows total energy
consumption with respect to per capita income for the residents
7. 58 Z.H. Gu et al. / Sustainable Cities and Society 7 (2013) 52–61
Fig. 8. Heating and cooling systems are prominent features on the fac¸ ade of residential buildings. (a) This flat building in the Landsea communit y has a clean fac¸ ade. (b) A
flat buildin g without central heating and cooling has to install blinds to shield the outdoor component s of air-condit ion in g units.
Table 3
Per capita income and energy consumption in different forms by the residents surveyed in Nanjing.
Natural gas (M3
)
Annual income (USD) Electricity (kWh) Petrol (L)
<5000
5001–7500
7501–10,000
10,001–12,500
12,501–15,000
>15,000
760.2
827.5
1163.6
1435.5
1831.5
1211.4
20.0
31.5
29.4
28.9
23.9
26.3
112.0
172.4
274.0
342.4
391.7
288.7
kg CO2 The decline found in the energy consumption of the high-
est earning people was unexpected. One reason may be that
high-income people are at home for less time, which decreases
household energy consumption. They value time very highly and
cannot bear wasting time for commuting, so they often live near
the office, which also decreases their energy consumption for
transport. Another reason may be higher environmental aware-
ness, causing them to restrict energy consumption. A problem
that should be noted in this regard is energy transfer, i.e. high-
incomepeople may have consumed less electricity inthe household
because they consumed more energy at other places, e.g. by spend-
ing more time in hotels, restaurants, pubs, spas, game rooms,
gymnasiums, etc. Some simply regard the home as a dormitory,
which leads to low energy consumption inthe household, but they
do not necessarily consume less energy for living. Thus, the energy
is not saved, but transferred.
In general, increasing wealth induces more energy consump-
tion, as confirmed by the data for low to middle income groups in
this study. However, it is impossible to achieve energy efficiency
by slowing down economic development. Other methods must be
identifiedtodecrease energy consumption even whenthe economy
is growing.
3000.0
2500.0
2000.0
Petrol
Naturalgas
Electricity
1500.0
1000.0
500.0
USD/a
0.0
Fig. 9. CO2 emissions per capita with respect to income of the residents surveyed
in Nanjing.
surveyed in Nanjing, while Fig. 9 shows the CO2 emissions distri-
bution. The average per capita annual disposable income was 4400
USD in Nanjing in2010 (Nanjing Statistic Bureau, 2011). Only three
respondents (13 inhabitants) were lower than this standard,2
and
all these respondents were not tenants but owned their property,
so they have to pay for electricity themselves. As Table 3 shows,
higher economic capability supported higher energy consumption
(Table 4).
4.6. Social factors
Itisdifficultto quantitativelyexaminethe influence ofsocialfac-
tors onenergy consumption.Thisstudy focused onthe relationship
between energy consumptionstructures, family structuresand liv-
ing habits arising from these.
On the whole, different energy carriers maintained a rela-
tively constant proportion in energy consumption structures (Mi,
Nie, Li, & Li, 2011). However, for some concrete cases, they were
2
Th e of ficial data did n ot calc ulate f olk c apit al flow, wh ich w as an import ant part
of priv ate inc ome. The real inc ome data obt ained by th e quest ionn aire w ere usually
higher than the official statistical data.
8. Z.H. Gu et al. / Sustainable Cities and Society 7 (2013) 52–61 59
Table 4
Three examples from the questionn aire sheets.
Location Site A Site B Site C
Floor area
Built time
Number of household members
Family members
84 m 2
1998
2
Man, 31
Wife, 30
98 m 2
2001
3
Man, 36
Wife, 35
A child, 3
139 m2
2006
5
Man, 35
Wife, 31
Man’s father, 67
Man’s mother, 63
A child, 2
55,000 USD
Man: 13 km, car
Wife: 10 km, subway
Air conditionin g: 4
Elec. space heater: 1
Refrigerat or: 1
Washin g machine: 1
Computer: 3
Elec. water heater: 1
Gas water heater: 1
Electric lighting: 7 sets and 10
point lighting sources
Plasmon TV set: 2
Solar heater: 0
Electric bicycle: 1
5214 kWh
743 kWh
613 kWh
681 kWh
1508 kWh
685 kWh
984 kWh
140 M3
560 L
Family annual income
Distance to duty and means of transport
30,000 USD
Man: 6 km, bus
Wife: 5.5 km, bicycle
Air conditionin g: 1
Elec. space heater: 2
Refrigerat or: 1
Washin g machine: 0
Computer: 2
Elec. water heater: 0
Gas water heater: 1
Electric lighting: 5 sets and 4
point lighting sources
LCD TV set: 1
Solar heater: 0
Electric bicycle: 1
4719 kWh
780 kWh
577 kWh
622 kWh
629 kWh
942 kWh
1169 kWh
24 M3
250 L
21,000 USD
Man: 9 km, car
Wife: 8 km, bus
Air conditionin g: 2
Elec. space heater: 1
Refrigerat or: 1
Washin g machine: 0
Computer: 2
Elec. water heater: 0
Gas water heater: 1
Electric lighting: 5 sets and 4
point lighting sources
LCD TV set: 1
Solar heater: 1
Electric bicycle: 1
2611 kWh
725 kWh
651 kWh
403 kWh
476 kWh
356 kWh
1234 kWh
46 M3
410 L
Main household appliances
Elec. consumpt ion
10 January–9 March
10 March–9 May
10 May–9 July
10 July–9 September
10 September–9 November
10 November–9 January
Natural gas
Petrol
kWh
1500 1387
1200
1059
900 820
Peak electricity
Off-peak electricity
Total electricity
625 632
603
567
600 520 496
456
290
335 325 307
289 269
300 231 227
0
10 Jan. - 9 Mar. 10 Mar. - 9 May 10 May - 9 July 10 July - 9 Sep. 10 Sep. - 9 Nov. 10 Nov. - 9 Jan.
Fig. 10. Actual electricity consumption (kWh) by one resident surveyed.
interrelated. Electricity and household appliances, natural gas and
cooking and hot water, petrol and transport usually had corre-
sponding correlations. If some function used a different energy
type, the energy consumption would be different, for instance, gas
water heater or electrical water heater, gas stove or electromag-
netic oven, motorcycle or electric bicycle, etc.
Electrical appliances are usually the most convenient option,
but the generation of electricity should also be considered. Actu-
ally, electricity is not an energy source but an energy carrier. Its
environmental impact depends on how it is produced and today
electricityis mainly produced inthe world by hydropower, nuclear
powerandfossilfuels.Afeature incommon forthe differentengine
technologies available is low efficiency, as the majority of the pri-
mary energy is dissipated as heat, which is often not utilised. It
is thus obvious that transport planning in cities has to develop in
another direction, namely to reduce the use of private cars. Inany
case, petrol cannot be recommended as an energy carrier because
of its high carbon emissions and environmental impact. Although
natural gas is an available alternative energy source to petrol in the
near future interms of carbon emissions and reserves, electricity is
likely to be the only available energy carrier when fossil fuels are
exhausted in the future.
Nanjing is a city with four distinct seasons, which brings both
challenges and opportunities for energy consumption in space
heating and cooling. Fig. 10 shows the bi-monthly electricity con-
sumption ofone residentthatisfar belowthedistributionof overall
electricity consumption, where cooling consumed more energy
than heating (see Fig. 3). It is surprising that the electricity con-
sumption of the resident in Fig. 7 was higher in winter than in
summer. Another unusual finding is that off-peak electricity con-
sumption was more than peak electricity consumption3
in most
months. Further investigation showed that the householders were
3
N anjin g Pow er has a polic y of peak/off-peak elect ric it y pric in g. From 8 am t o
9 pm is peak t ime and f rom 9 pm t o 8 is off- peak t ime. At t he t ime of study, t he price
of peak elect ricit y w as 0.56 Yuan/kWh and t he pric e of off-peak elect ricit y w as 0.36
Yuan/kWh.
9. 60 Z.H. Gu et al. / Sustainable Cities and Society 7 (2013) 52–61
kg in Nanjing by June, 2011 (Zhu, 2011). Young people surveyed here
preferred to drive the car to work when there was no convenient
bus or subway line connecting the home and the workplace. How-
ever, it was rare for an elderly person to be able to drive a car.
The main means of transport for the elderly were buses or bicy-
cles. Therefore even in a large family, no more than two members
drove cars, which led to minor petrol consumption per capita in
this category.
Family structures and life habits can be changed through many
approaches, e.g. education, economic incentives, social security
policies, etc. Urban planning is another possible approach. Urban
planners should consider these issues more carefully infuture and
bear inmind that city planning based onaesthetics is not necessar-
ily suitable for optimising urban energy consumption.
2500.0
2000.0
1500.0
Petrol
Natural gas
Electricity
1000.0
500.0
0.0
1 2 3 4 >5
household populations
Fig. 11. CO2 emissions per capita with respect to number of members per house-
hold.
5. Conclusions
accustomed to working at night and because of this working pat-
ternthey needed little air-conditioning insummer, but much space
heating inwinter. Therefore, if people were to make use of daytime
to work in winter and night-time to work in summer, energy con-
sumption patterns would better match the seasonal temperature
pattern and electricity consumption would remain low.
Besides the temperature pattern, transport also followed a
familiar pattern. During the morning and evening rush hour, vehi-
cles take two or three times longer to travel their normal route.
Timeandpetrol are wasted during thetrafficjams. Ifpeople wereto
avoid the rush hour, the commuting time would be shortened dra-
matically. Saving time means saving energy. Since petrol is mainly
usedfor commutingtransport, changing travelpatterns hasspecial
significance insaving petrol.
For China’s one-child policy, it is rare for a family to exceed
five members.4
The traditional extended Chinese family, withtens
of members, has disappeared in today’s cities. The mean number
of household members among the questionnaire respondents was
2.84 per household, while as an average for Nanjing this number
decreased from 2.92 per household in 2000 to 2.77 per house-
hold in 2010 (Nanjing Statistic Bureau, 2010). The questionnaire
households can be divided into two sets by number of generations
represented: small families withone or two generations, and large
families withthree or four generations. The different habits within
different age brackets induced different energy consumption.
Fig. 11 shows the CO2 emissions per capita withrespect to num-
berof household members. The overalltrend wasfor CO2 emissions
per capita to decrease when household size increased, which indi-
cates that large families are more energy-efficient.
For retired people, the household is the main area of activity.
They cook and eat at home and their social activities are usu-
ally limited to the local community. Thus they consume very little
energy for transport.
Natural gas was used almost only for cooking in the house-
holds surveyed. There was clear trend in natural gas consumption
for household size. The large families, including the elderly and
children, usually cooked at home and therefore their natural gas
consumption was higher. The small families without elderly peo-
ple usually ate fast food or at restaurants, whic h led to very low
natural gas consumption in the home.
Private vehicles began to be popular at the beginning of the 21st
century and although per capita car ownership is still at a low level,
it is increasing rapidly. There were more than 1.3 million vehicles
This study inNanjingrevealedthat householduseandtransport
were the two main contributors to domestic energy consumption
inthecity. Household electricityconsumptionshowedobvioussea-
sonal characteristics, being higher in summer than in the other
three seasons. Transport energy consumption showed geographical
characteristics, with the old town nearest the business area hav-
ing the lowest transport energy consumption. Household devices
withahighcoefficientofperformance(COP)didnotmakebuildings
more energy-efficient,soarchitectural designshouldseekto reduce
the use of such devices. Energy consumption generally increased
withincreasingincome, especially atlower levels. Family structure
also influenced energy consumption, with high-income families
and small families consuming more energy per capita. The results
showed that economic and social factors were equally important
to technical factors for energy efficiency.
Based onthe findings above and considering sustainable urban
development, some possible policies that could indirectly affect
energy consumption are:
1) Urban sprawl cannot solve developing city problems. Making
the most of existing city land to develop a compact city is
the only way to create an energy-efficient city. Promotion of
mixed residential and commercial activities without creating
land use conflicts is the most important strategy to decrease
energy consumption for transport. The CO2 emissions from a
fully mixed-function city area are only about 70% of those of
a wholly residential area. Urban planning should reverse the
trend of removing residential functions from the city centre and
provide more commercial and business functions in suburban
areas.
2) Thermal performance should be improved not only by con-
structing new buildings, but also by refurbishing old buildings.
An equally important consideration is to restrict per capita
floor area. However, small households containing only one or
two members are less energy-efficient per capita than house-
holds withmore members. Unfortunately, modern families are
becoming smaller in China. The government should promote
large households containing several generations.
3) Satellitetownsshouldbedevelopedmorecarefully.Landfinance
is currently a major driving force in the development of new
satellitetowns inChina.Even if new satellitetownsare unavoid-
able, they should be as close to downtown areas as possible. The
provisionof adequate public transportto connectsatellitetowns
and central city is essential. While local services may meet most
requirements in new towns, transport between satellite towns
and city centre is unavoidable. Vehicles are negative for energy
efficiency and environmental impact.
4
Actually, people c an have more th an one ch ild f or some reason s, e.g. h usband and
wif e are bot h ‘one-c hild’, remarriage,t w in s, payin gf or soc ial support f ees, etc. H enc e
there were st ill some families wit h more th an fiv e members durin g the survey. On e
househ old surveyed had 10 members: a man and h is wif e, t he man’s tw o ch ildren ,
the man’s parents, and 4 tenants.
CO2
Emissions
10. Z.H. Gu et al. / Sustainable Cities and Society 7 (2013) 52–61 61
4) Energy issues should be considered from a systems perspec-
tive. Despite high performance by a single element, e.g. central
air-conditioning, the system may not be efficient. The highest
technology also has a scope of application. The best adapted is
the best measure. It is important to explore and develop inter-
actions between systems at different levels within the city and
between the city and its surroundings. There is a need for more
intelligentdesign ofbuildings and bettersystemsfor energy dis-
tribution, where locally produced energy canbe complemented
withcentrally produced energy in new smart grids for electric-
ity and low temperature district heating and cooling systems.
By working withneighbourhoods, the interactions betweensys-
tems canbe examined from a technical but also from a social and
economic perspective.
Lahiri, S., Babiker, M., & Ec kaus, R. S. ( 2000). Th e effect s of c han gin g c on sumption
patt erns on the c ost s of emission restrict ion s. In MIT Joint Program on t he Science
and Policy on Global Changes, Report no. 64.
Liang, Z. H., Liu, X. Y., & Peng, W. B. (2010). The long term view of Shanghai low
carbon city developm ent . Blue book of Shanghai: Annual report on resources and
environm ents of Shanghai 2010. Beijing: Social Sciences Academic Press (China).
Liu, X. Q., Ang, B. W., & Ong, H. L. (1992). The application of the Divisia index to
the decomposit ion of changes in industrial energy consumption . Energy Journal,
13(4), 161–171.
Ma, L. J . C. ( 2002). Urban t ran sf ormat ion in C h ina, 1949–2000: a review an d researc h
agenda. Environment and Planning, 34(9), 1545–1569.
Men g, C., Zhan g, L., Yan g, C. H., & Yan g, Y. X. (2011). Assessment and analysis of
energy efficienc y f or Landsea internat ional Bloc k, Nanjin g. Const ruction Science
and Technology, (14), 46–49.
Mi, L. Y., N ie, R., Li, H. L., & Li, X. H .( 2011). Empirical research of soc ialn orms affect in g
urban resident s low carbon energy c on sumption behav ior. Energy Procedia, ( 5),
229–234.
Mihalakakou, G., Sant amouris, M., & Tsan grassoulis, A. ( 2002). On th e energy c on-
sumption in residential buildin gs. Energy and Buildings, 34(7), 727–736.
Minist ry of C on st ruct ion of Ch in a, 1993. Thermal design c ode f or c iv il buildin g ( GB
50176-93).
Nanjing Local Chronicles Compilation Committee, 2011. Nanjing Almanac 2010.
Nanjin g M un ic ipal Gov ern ment, 2006. The option s about improv in g t he en ergy
efficiency of buildin gs in Nanjing.
Nanjin g Urban Plann in g Bureau, 2006a. Regulat ory plan of N anjin g old t ow n ( Deep-
ening version in 2006).
Nanjing Urban Planning Bureau, 2006b. City master plan of Nanjing (2007–2030) .
Nanjing Statistic Bureau, 2010. Communiqué of Nanjing on the major figures of the
2010 population census.
Nanjin g St atist ic Bureau, 2011. C ommun iqué of Nanjin g on th e 2010 Nat ion al Ec o-
nomic and Social Development.
National Bureau of Statistics of China, 2012.Chin a’s total population and struc-
tural changes in 2011. National Bureau of Statistics of China, Beijing, China.
http://www.stat s.gov.cn /was40/gjtjj en detail.jsp?ch an nelid=1175&rec ord=9
(accessed on 10.02.12).
Nat ion al Bureau of St atist ic s of Ch in a, 2012. C ommun iqué of the Nat ional Bureau of
Stat ist ic s of People’s Republic of Ch in a on Major Figures of the 2010 Population
Census (No. 1).
Perman a, A. S., Perera, R., & Kumar, S. (2008). Understandin g energy c on sumpt ion
pattern of househ olds in different urban development f orm s: A c omparat ive
study in Bandung City, Indonesia. Energy Policy, 36(11), 4287–4297.
Sch ipper, L. J., H aas, R., & Sh ein baum, C. ( 1996). Rec ent t rends in resident ial en ergy
use in OEC D c ountries an dt heir impact on c arbon dioxide emission s: a c ompar-
ativ e an alysis of the period 1973 –1992. Journal of Mit igation and Adaptation, 1,
167–196.
Sh orroc k, L. D. (2000). I dent if yin g t he indiv idual c ompon ent s of Unit ed Kin gdom
domest ic sect or c arbon emission ch an ges bet ween 1990 an d 2000. Energy Policy,
28(3), 193–200.
UN DP.( 2008). Human Development Report 2007/2008, fight ing climat e change: human
solidarit y in a divided world. New York: Palgrave Macmillan.
Wan g, M., & Wei, D.Y., 2010. Populat ion & n atural resources c ase study: wh at are the
challen ges of meet in g the resource needs of a very large populat ion? In Solem, M .,
Klein, P., Muñ iz- Solari, O., & Ray, W., eds., A A G Center f or Global Geograph y
Education. Available from http://globalgeograph y.aag.org
Wan g, H. K., Zh an g, R. R., & Bi, J. (2011). Carbon acc ountin gf or C hinese c ities: a case
of Wuxi City. China Environme nt al Science, 31(6), 1029–1038.
Xu, B., Sun, Q., Wen nersten , R., & Bran dt, N. ( 2010). An analysis of C hinese pol-
ic y in strument s f or c limate c han ge mitigat ion. Int ernat ional Journal of Climat e
Change Strategies and Management , 2(4), 380–392.
Yeh, A.G.- o., Yuan, H .- q., 1986.Satellit e t own development in C hina: problems an d
prospect s. Workin g Paper n o. 18, Centre of Urban St udies & Urban Plann in g,
Universit y of Hong Kong.
Zh an g, Y. Z. (2006). J u Fuyuan g in Nanjin g: energy ef fic ienc y and green buildin g
design and innovation . Construct ion Science and Technology, (7), 42–43.
Zh an g, Q., Wan g, Y.H ., & Yuan, D.L.(2007) . Resident ialenergy effic ienc yf orLan dsea
International Block. Heating Ventilat ion and Air Conditioning, 37(9), 123–126.
Zh u, S. L. (2010) . C omparison of t ran sport ation energy c on sumpt ion and green -
house gas emission betw een Beijin g an d Sh an ghai. Urban Transport of China,
8(3), 58–63.
Zh u, J .J., 2011. Regist ered number of aut omobiles has exceeded 1.3 million. M odern
Express of Jiangsu reported July 20.
Acknowledgements
This study was supported by the National Natural Science Foun-
dation of China (Grant No. 50908043). The authors would also like
to thank Prof. Dongqing Han (Southeast University, China), Yinyan
Xu (Nanjing Maternity and Child health Care hospital, China), Dr.
Zheng Wang, Dr. Hua Liu, Dr. BinTang, Dr. Rong Fang, Yuan Meng,
Danhong Ma, Yiming Kong, Qiuping Tang, Siyuan Han, Feifan Ma
and Jingxian Zhu (Southeast University, China).
References
CDC (C limatic Dat a Center), Nat ional Meteorologic al Inf ormation Center, Chin a
Meteorological Administration, 2011. Ch ina Met eorologic al Dat a Sh arin g
Service System, available in http://cdc.cma.gov.cn/in dex.jsp
Chen, S. Q., Yosh in o, H ., & Li, N .P.( 2010). St atist ical an alyses on summerenergyc on-
sumpt ion c haracterist ic s of resident ial buildin gs in some cit ies of C hina. Energy
and Buildings, 42, 136–146.
Chern , W. S.,I sh ibash i, Kimiko, Tan iguch i, Kiyosh i, & Tokoyama, Yuki. ( 2003) . Anal-
ysis of food consumpt ion of Japanese households . Rome: Food and Agricult ure
Organization s of the United Nations.
Chinanews.c om, 2011. Expert: China’s CO2 emission s account for 23% of the
world’s total emissions. Chinanews.com, Beijing, China. http://www.chinanews.
com/ny/2011/12- 04/3506192.sht ml (accessed on 04.12.11).
Close, J. (1996) . Int egrat ion of ph ot ov oltaic s w ith in high rise buildin gs in t he den se
urban env iron ment s of SE Asia, c onsiderat ion of legislat ion t o promot e it an d t o
maintain solar energy access. Renewable Energy, 8(1–4), 471–474.
Crompt on , P., & Wu, Y.( 2004). En ergy c on sumption in Ch in a: past t ren ds an d fut ure
directions. Energy Economics, 27(2005), 195–208.
Greenin g, L. A., Dav is, W. B., Sch ipper, L. J ., & Krushc h, M. P. ( 1997). C omparison
of six dec omposit ion met h ods: applic at ion t o aggregate energy inten sit y f or
manufacturin g in ten OECD countries. Energy Economics, 19(3), 375–390.
Gu, Z. H ., V est broc, D. U., Wen nerst en a, R., & Assefaa, G. ( 2009) . A st udy of Ch inese
st rat egies f or energy- effic ient h ousin g development s from an arch itect ’s per-
spect ive, c ombin ed wit h Swedish experienc es an d game th eory. Civil engineering
and environment al systems, 26(4), 323–338.
Heilig, G. K. (1999). Can China feed itself? A system for evaluat ion of policy options.
Laxenburg: IIASA. (CD-ROM Vers. 1.1)
Hic kman, R., & Ban ister, D., 2007. Tran sportat ion an d reduced energy c on sumpt ion :
wh at role can urban plann in g play? Workin g Paper n o. 1026, Tran sport Studies
Unit, Oxford Universit y Centre for the Environment.
IEA. (2010). emissions from fuel combustion highlights (2010 ed.). Paris,
CO2
France: International Energy Agency. http://www.iea.org/co2h ighlights/
CO2highlight s.pdf (accessed on 02.01.12)
IPCC. (2006). 2006 IPCC guidelin es for national greenhouse gas inventories. In H.
S. Eggleston, L. Buendia, K. Miwa, T. Ngara, & K. Tanabe (Eds.), Prepared by the
National Greenhouse Gas Inventories Programme. Japan: IGES.
Jenks, M., Burton, E., & Williams, K. (1996). The compact city a sustainable urban form?
Oxford Brookes University, Oxford, UK: Spon Press.