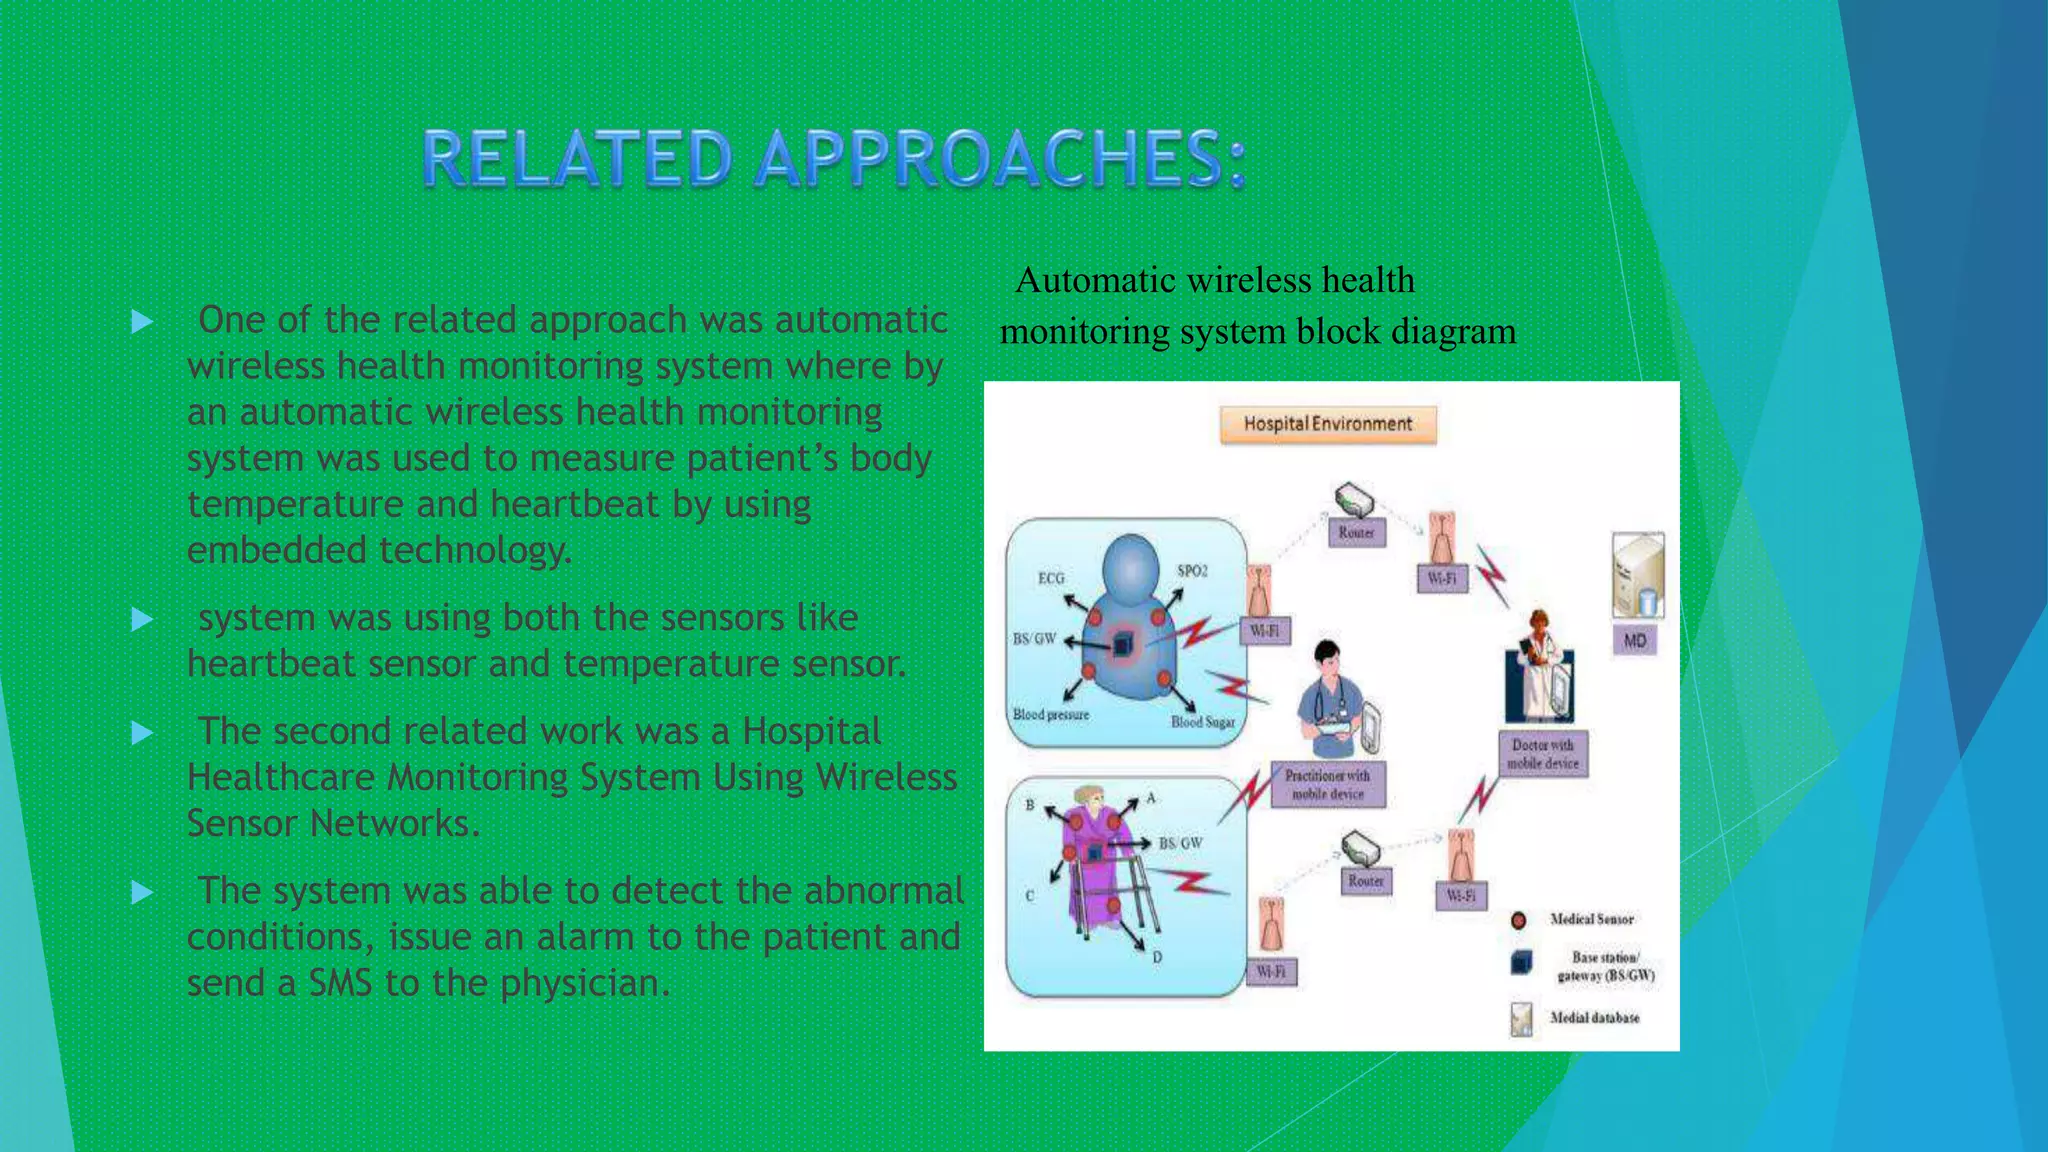
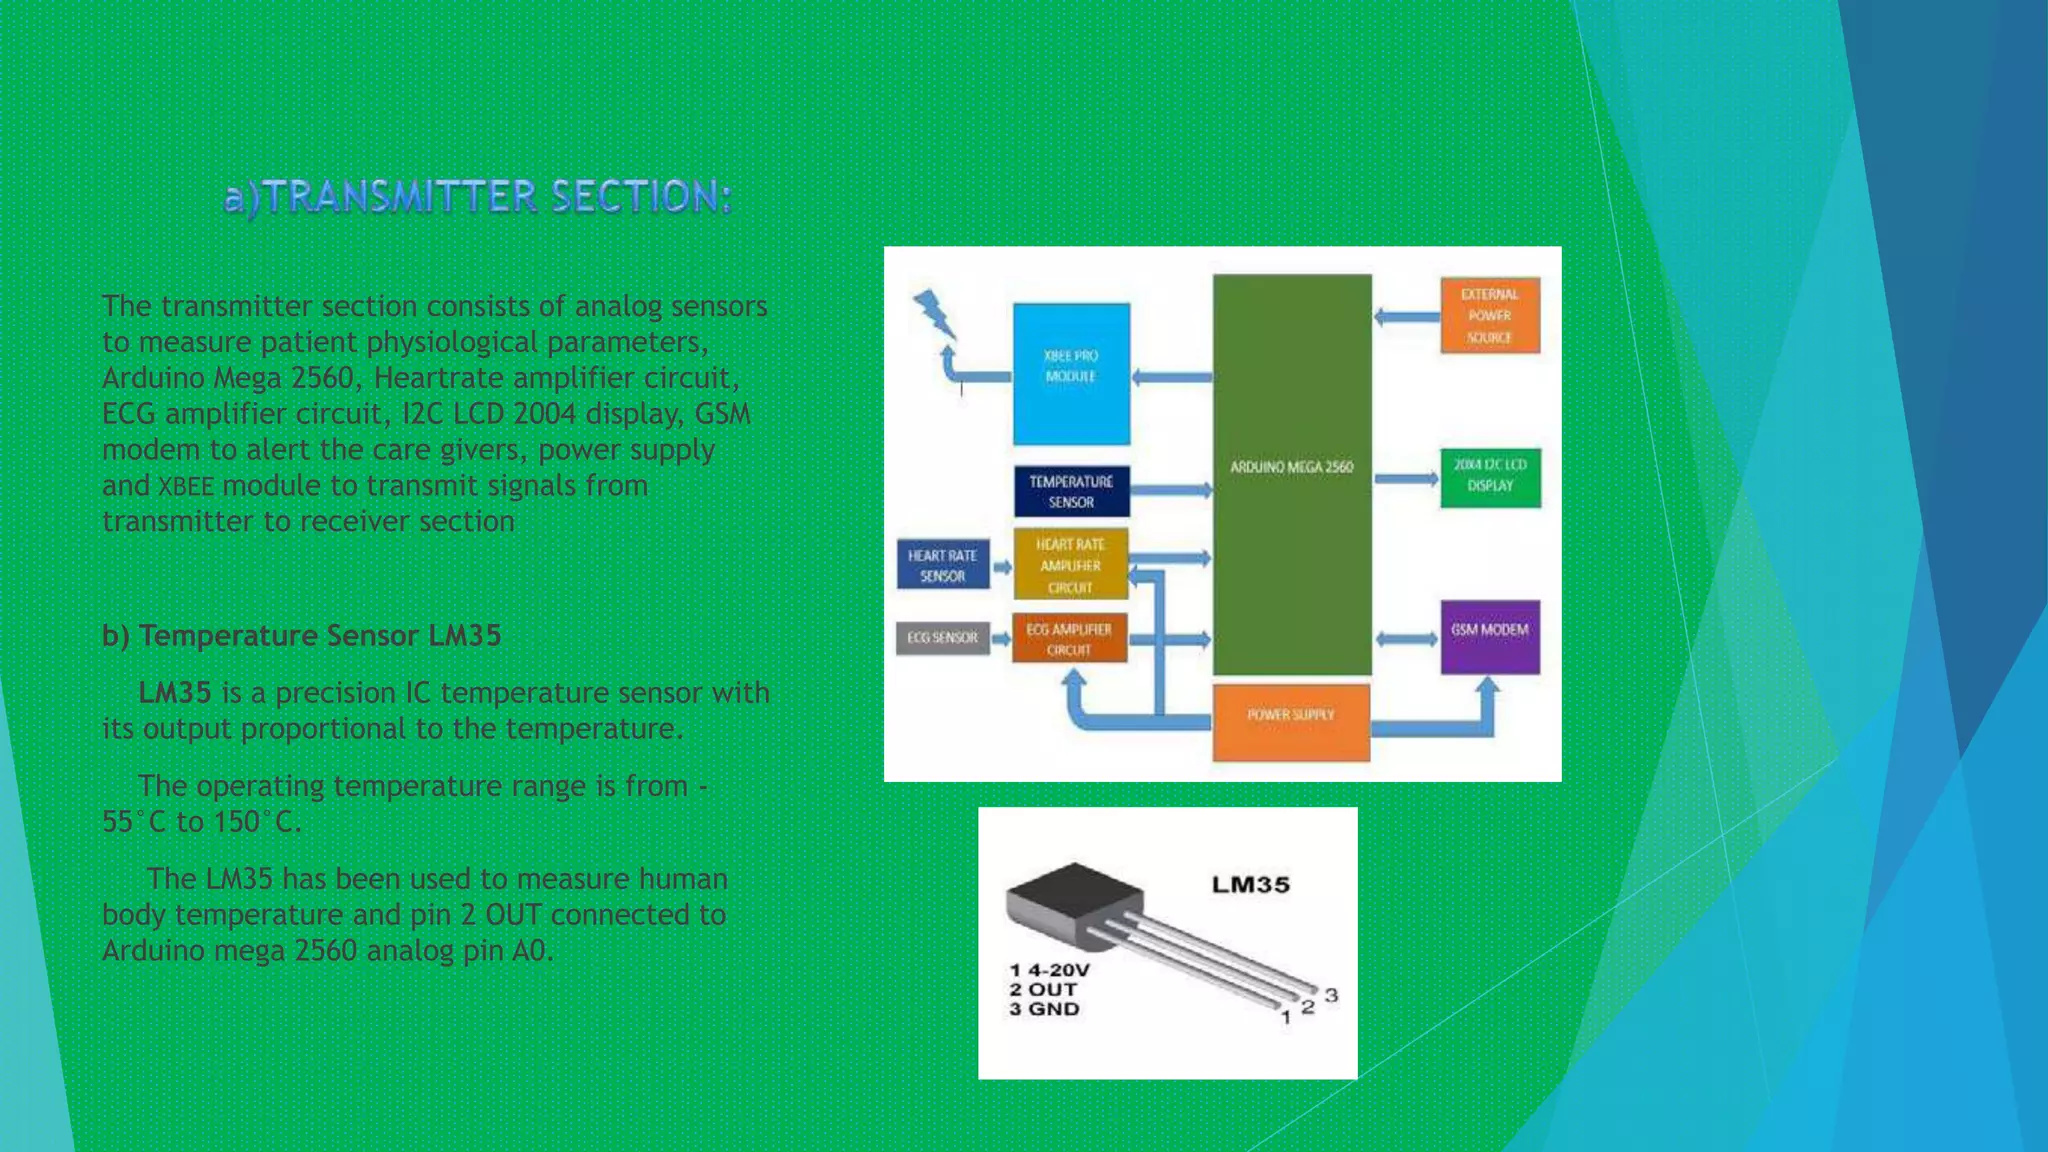
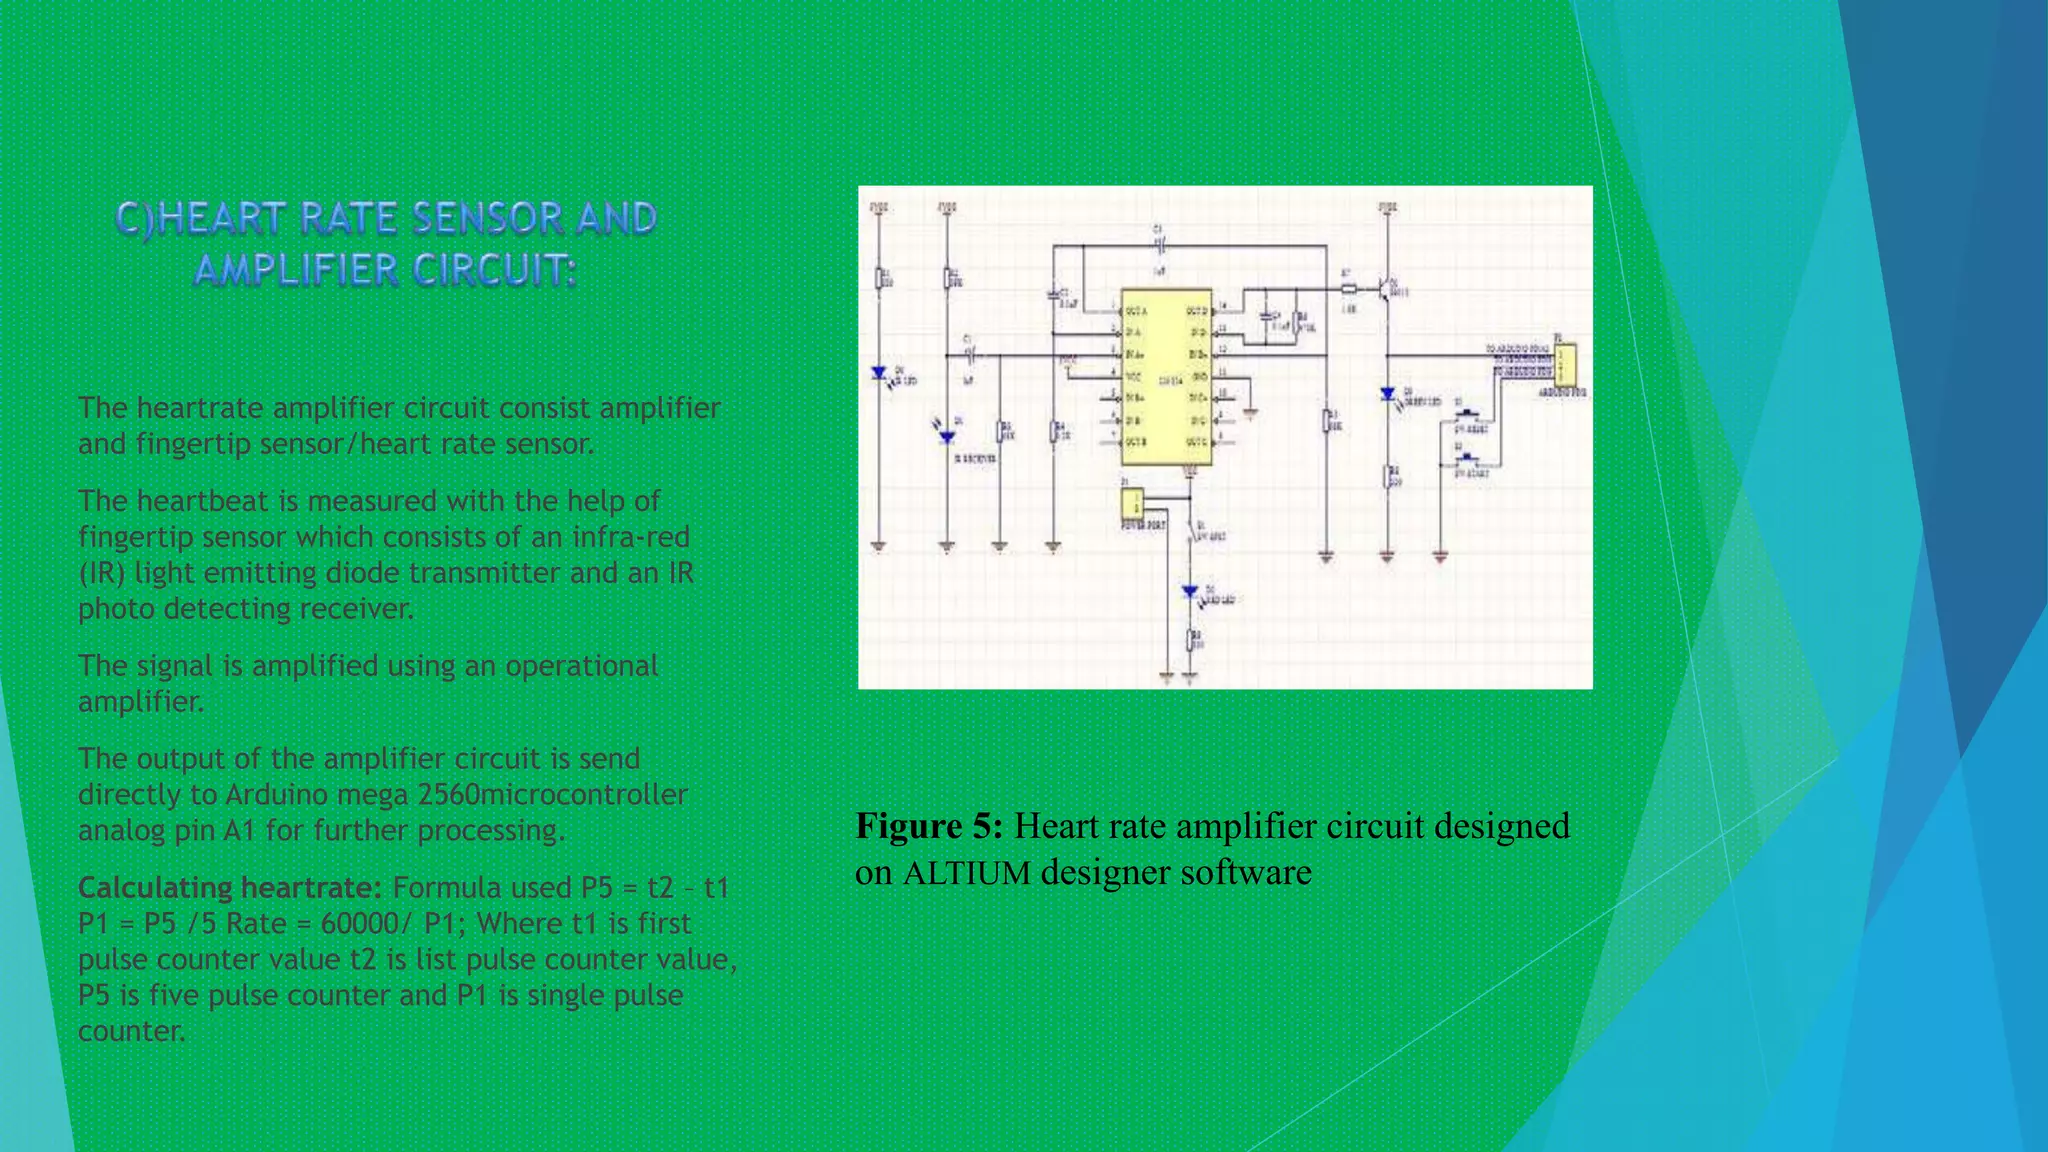
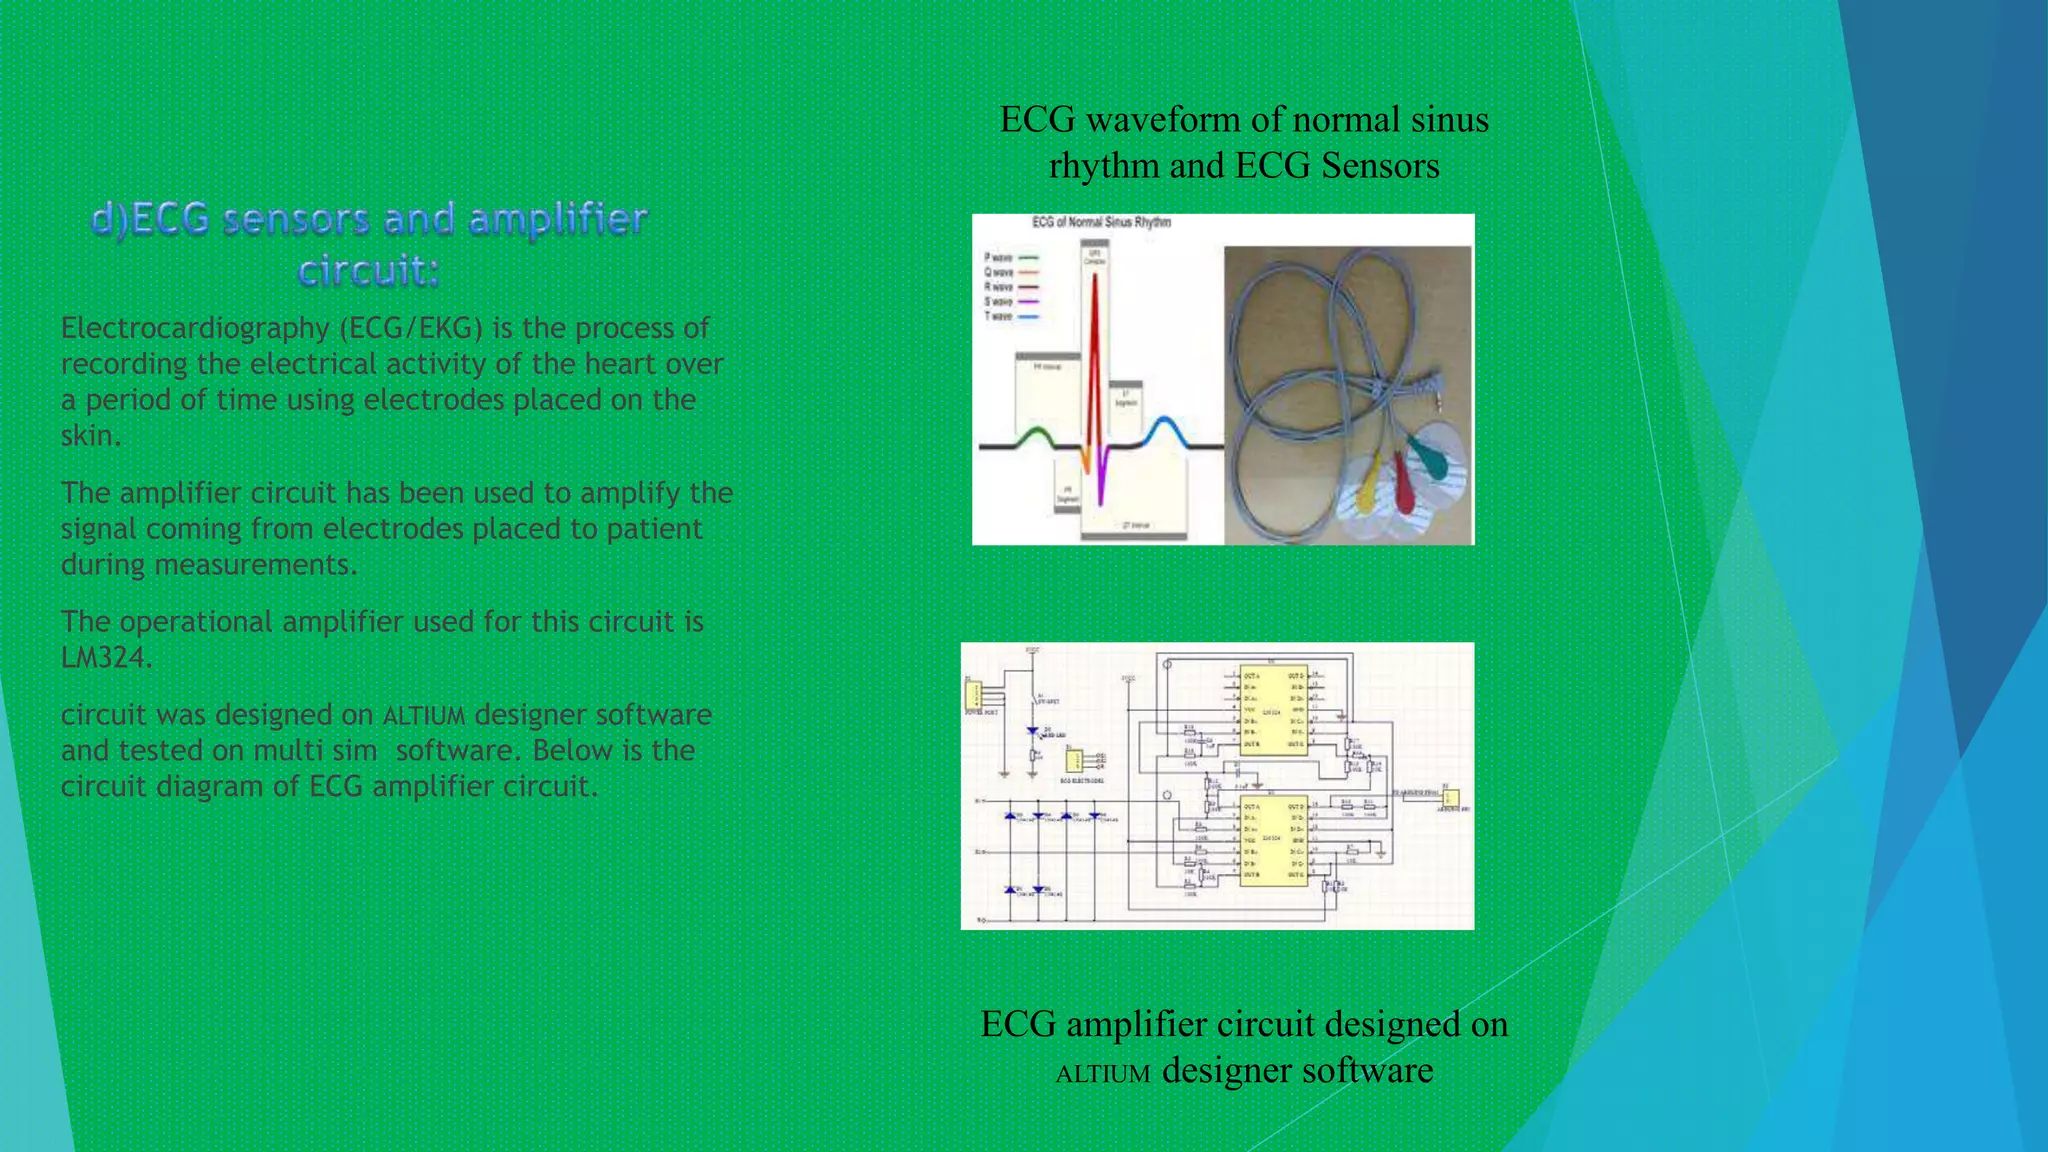
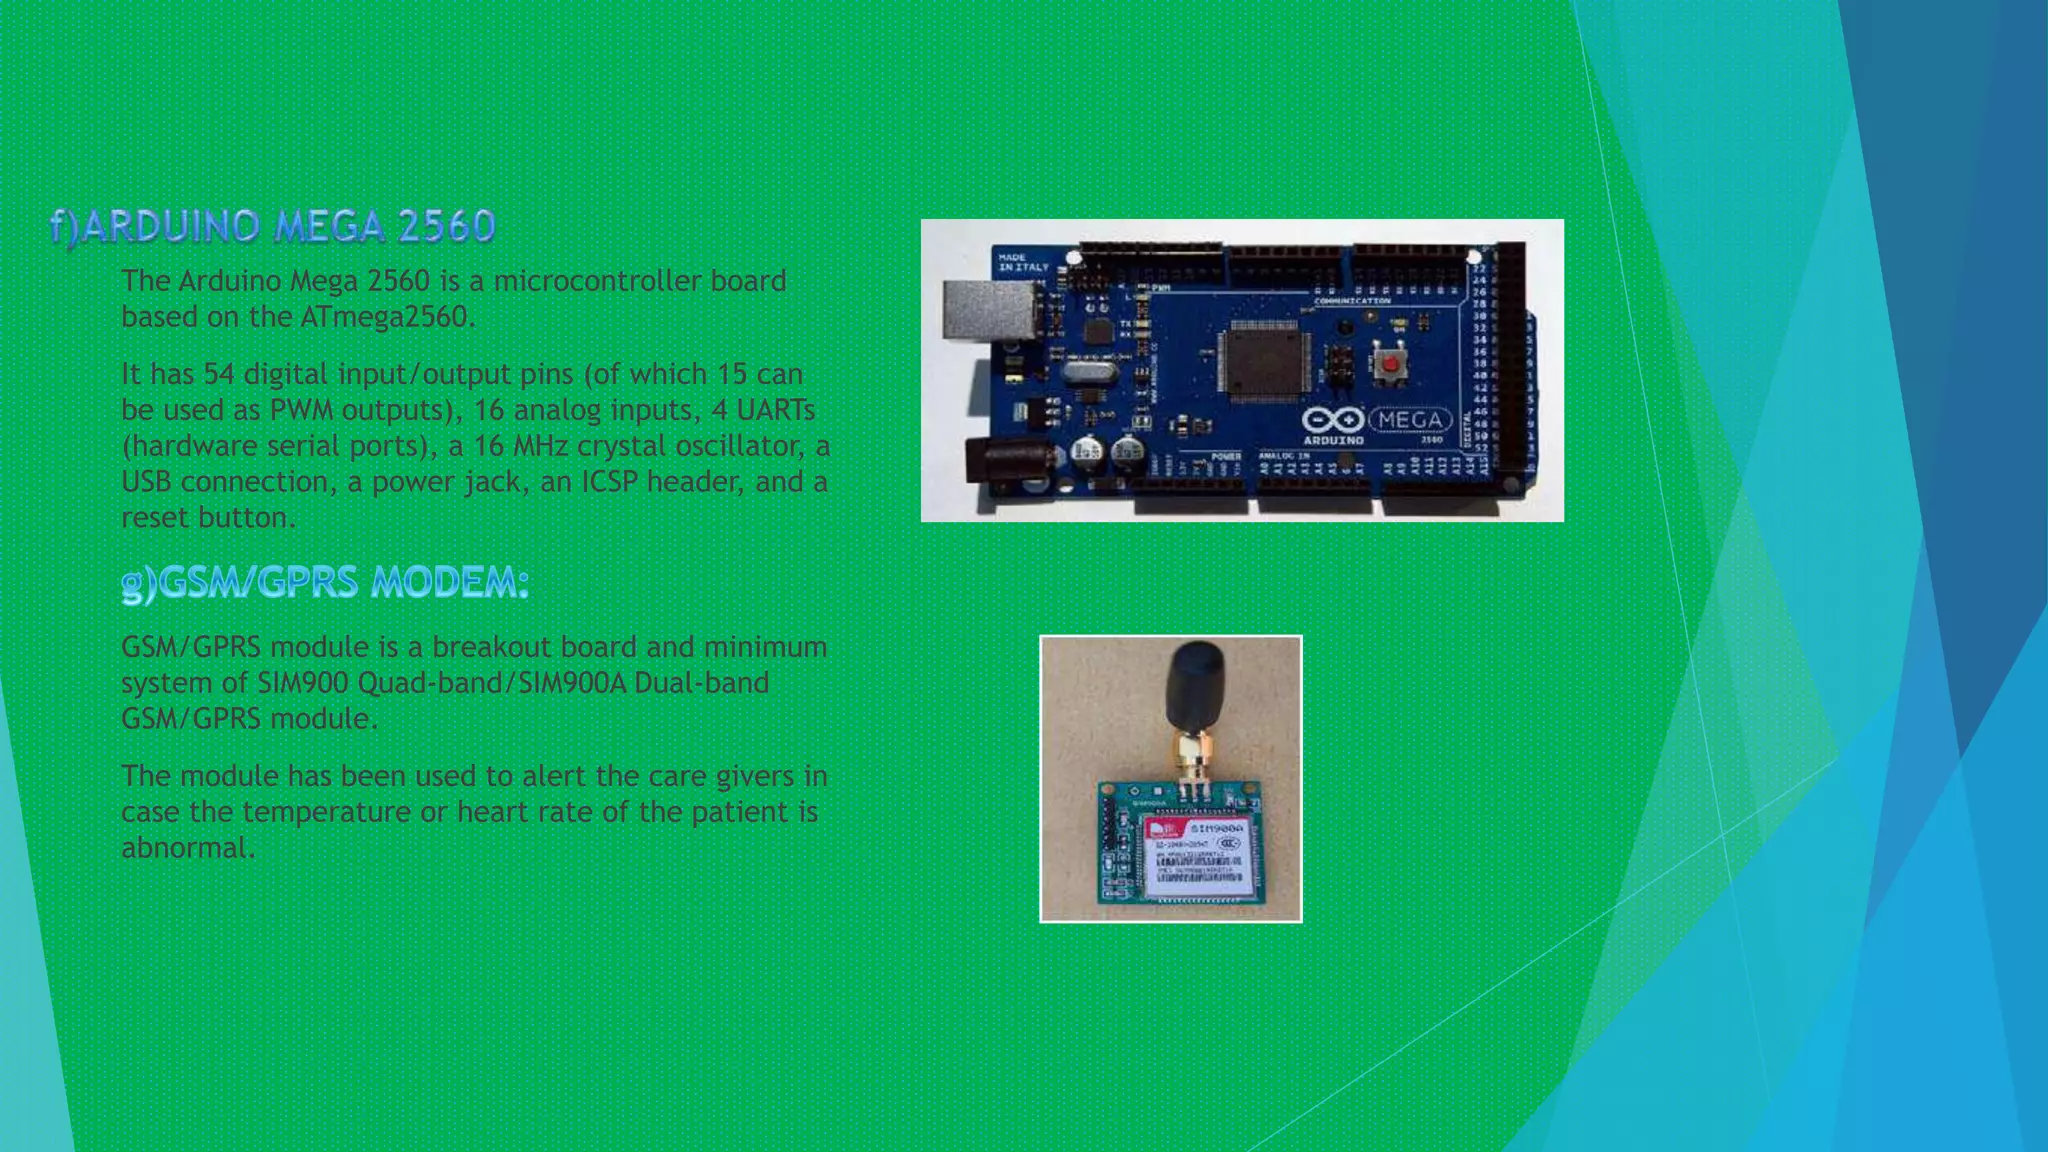
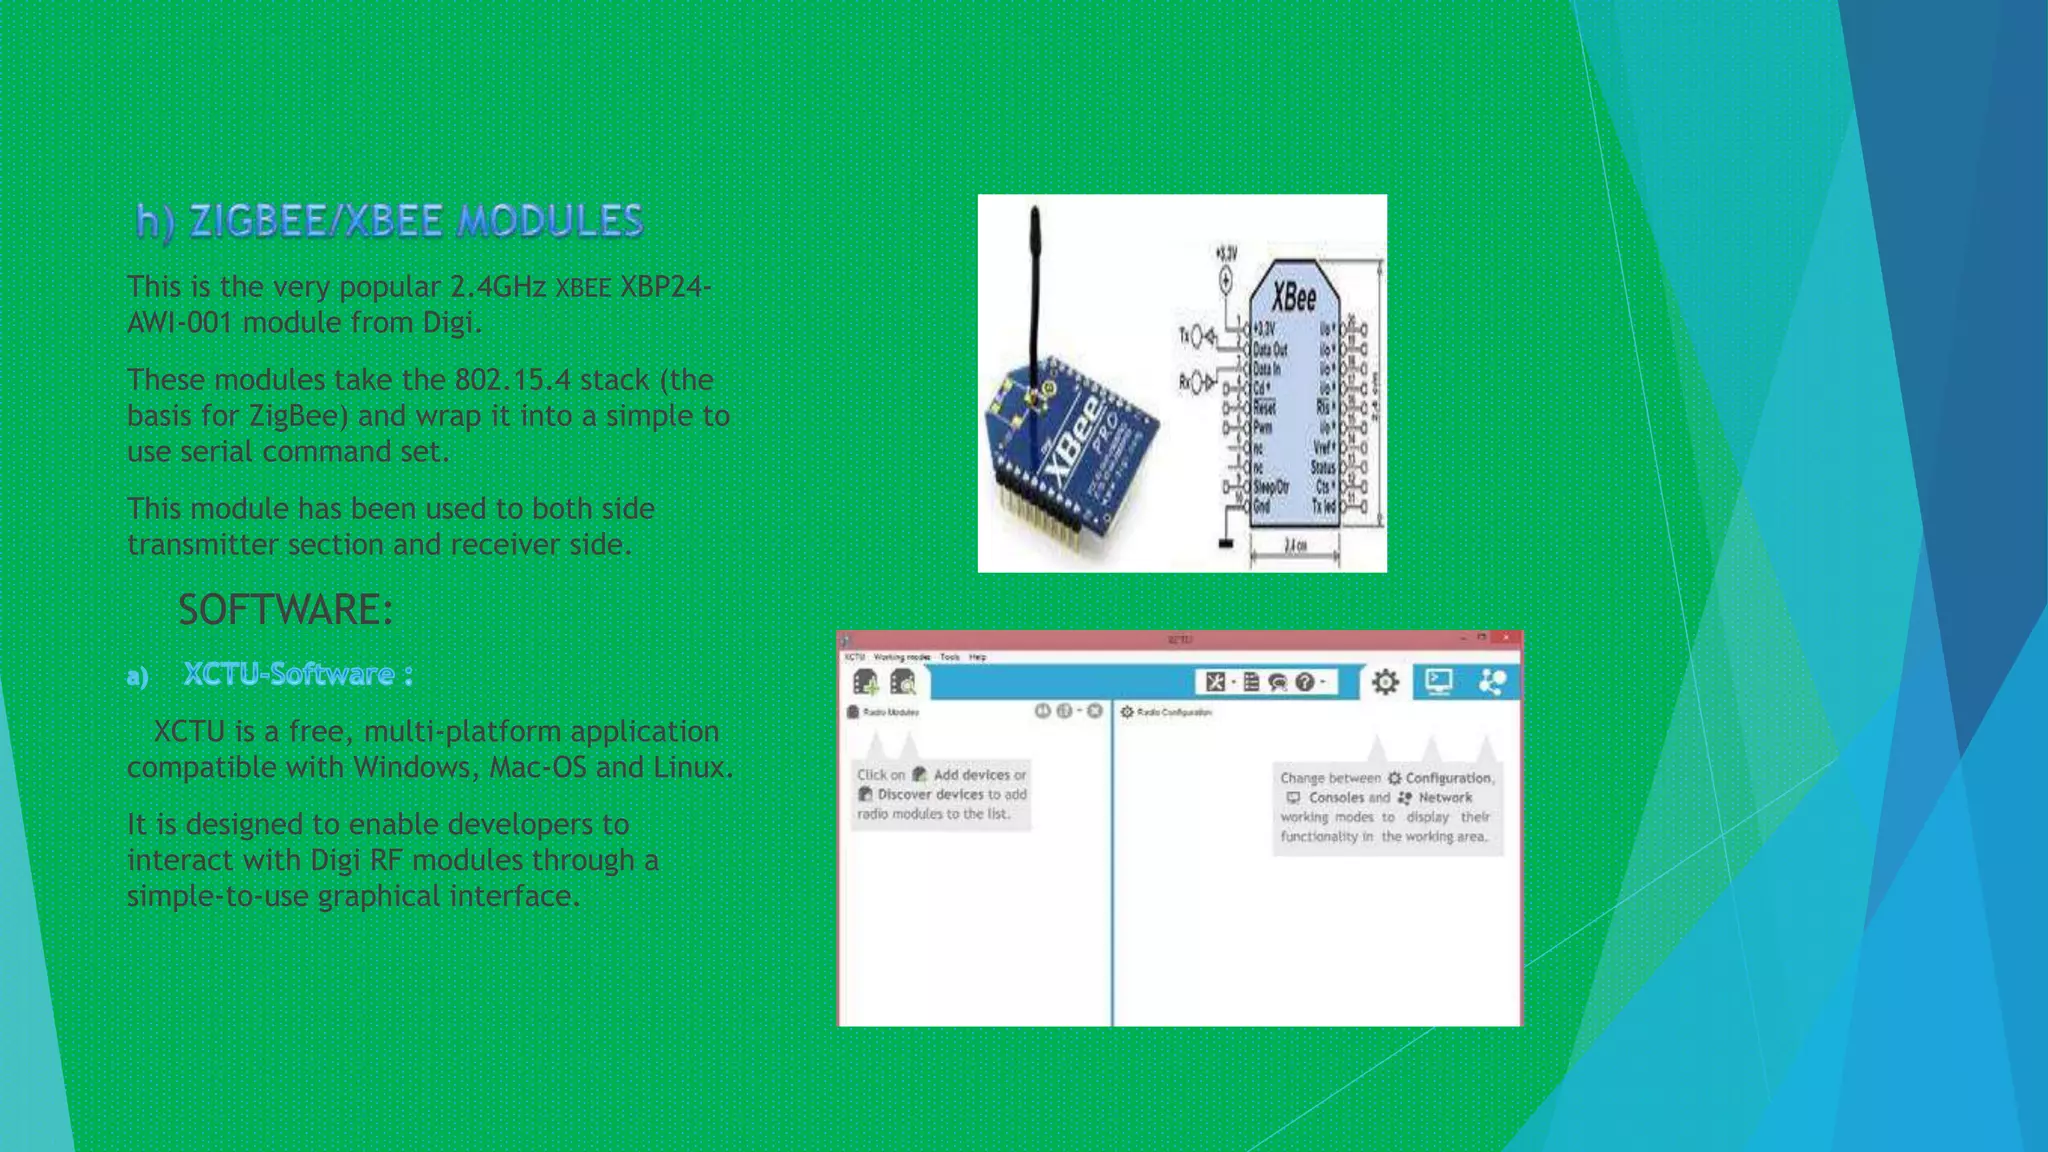
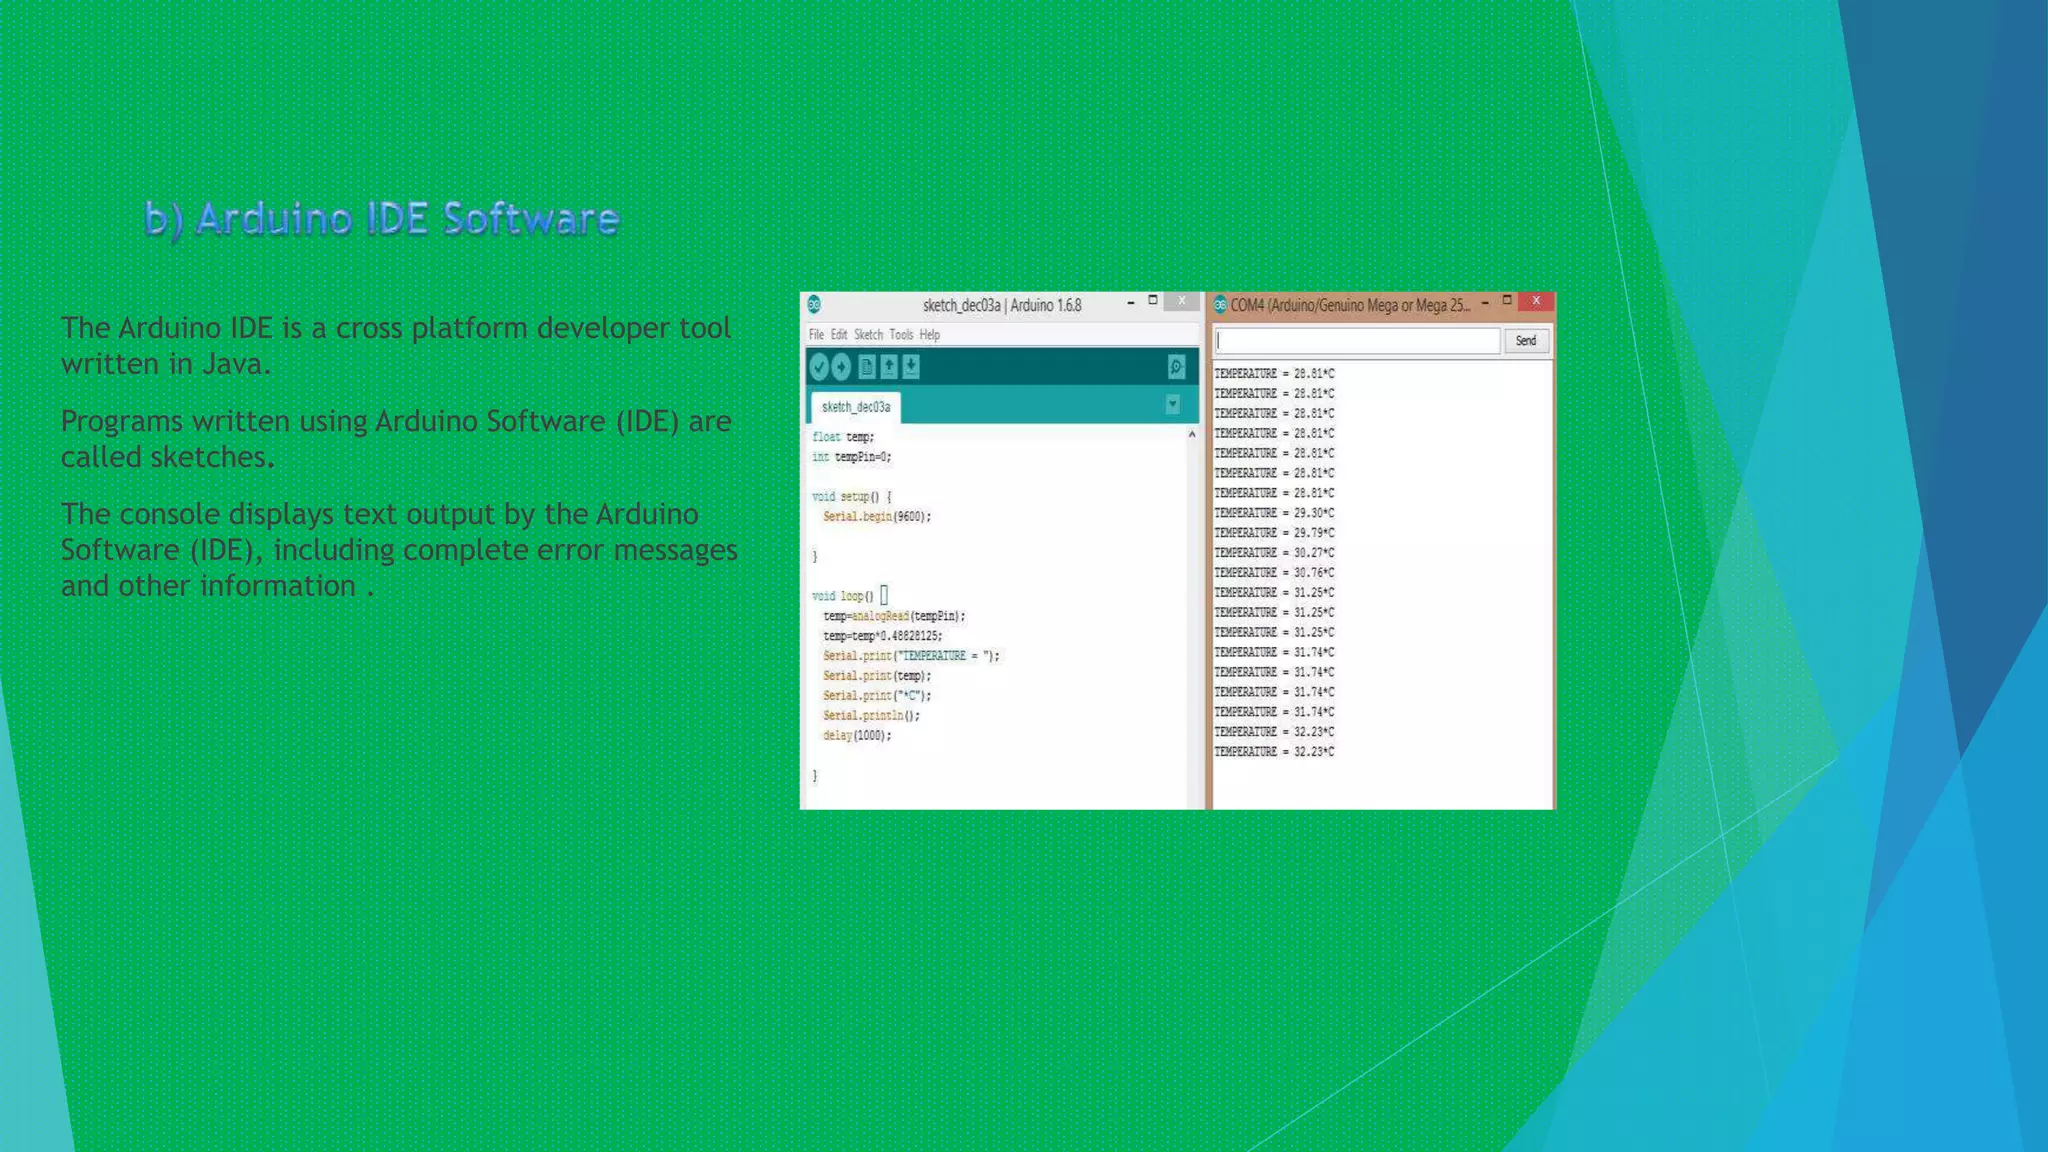
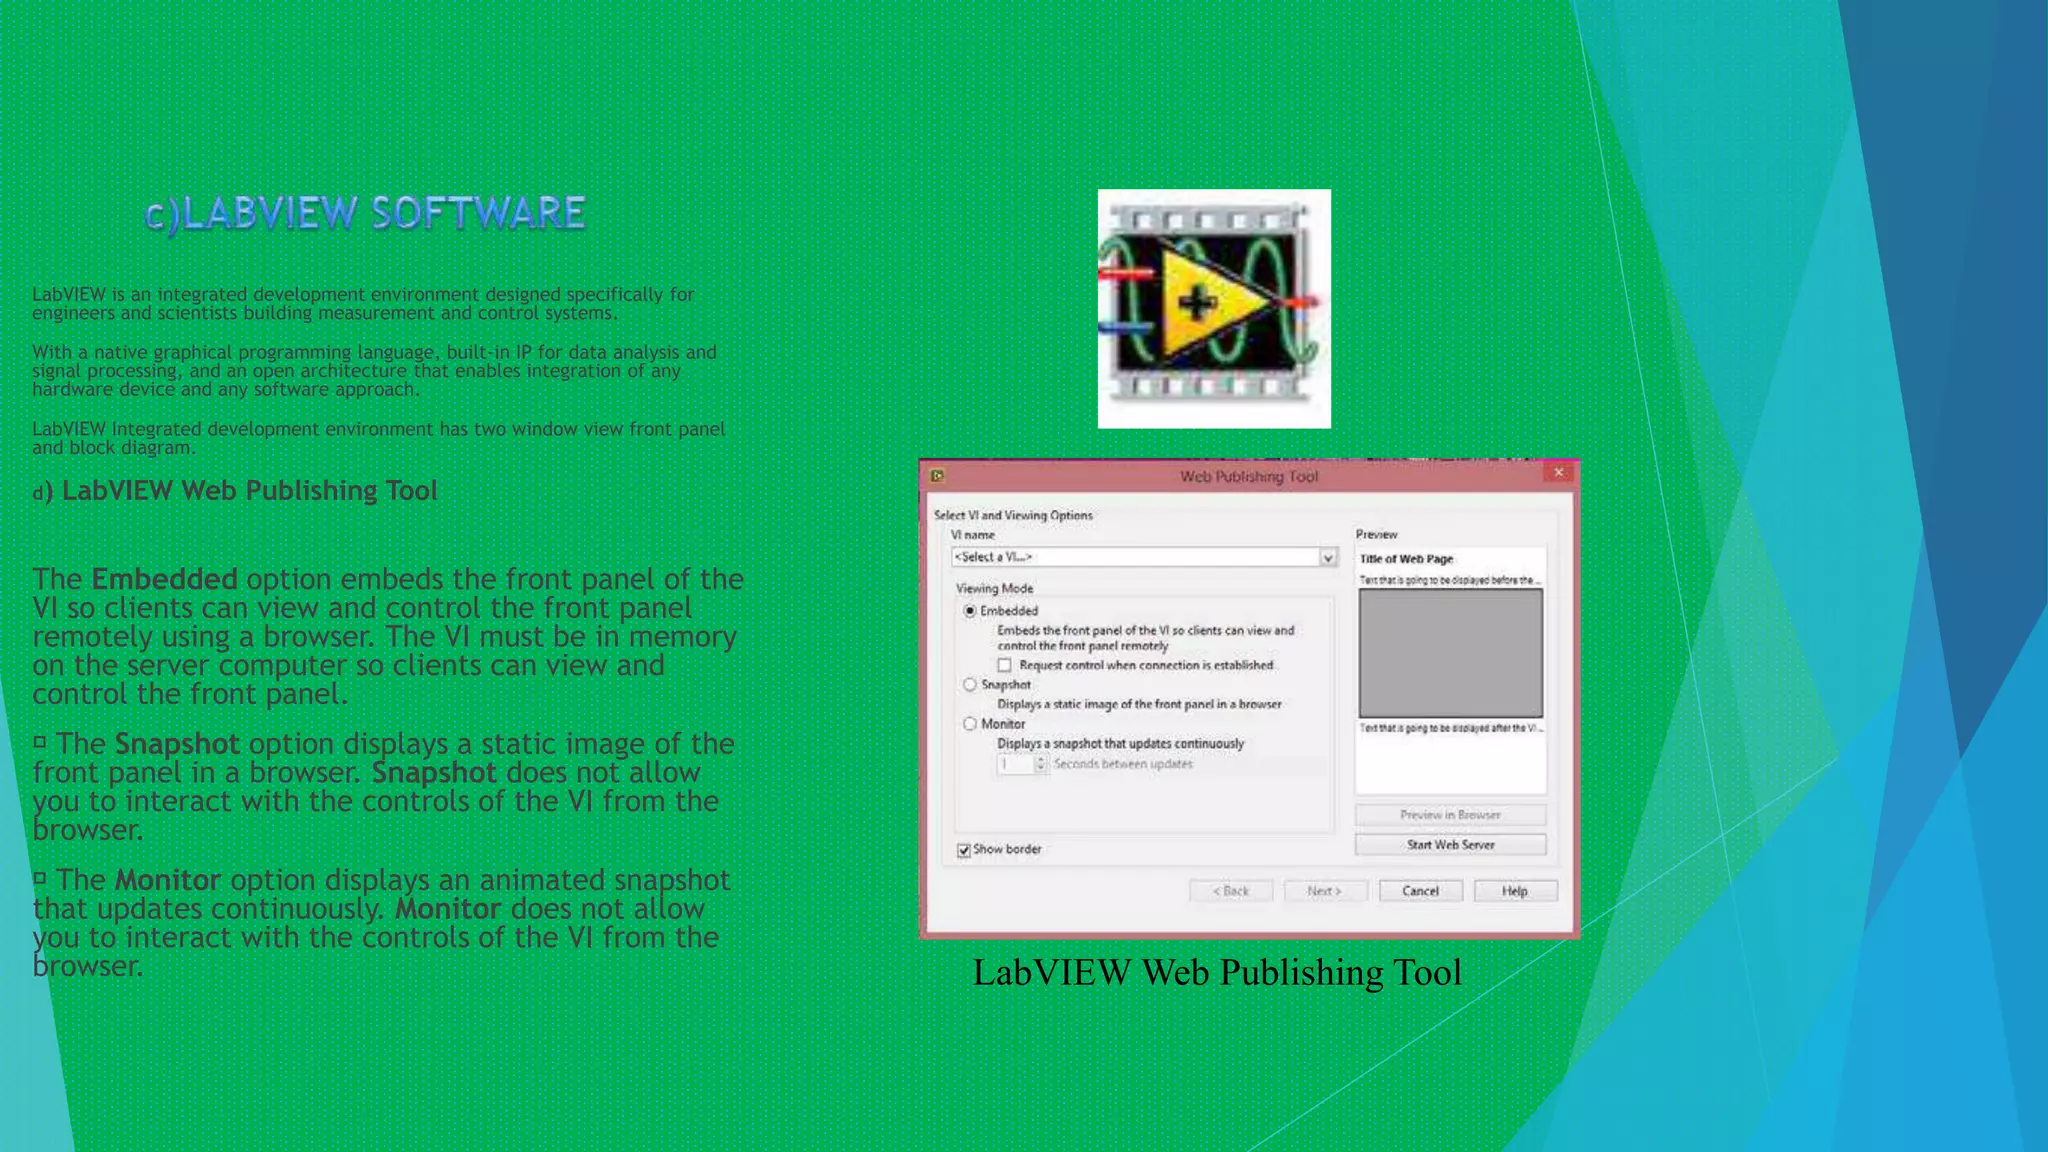
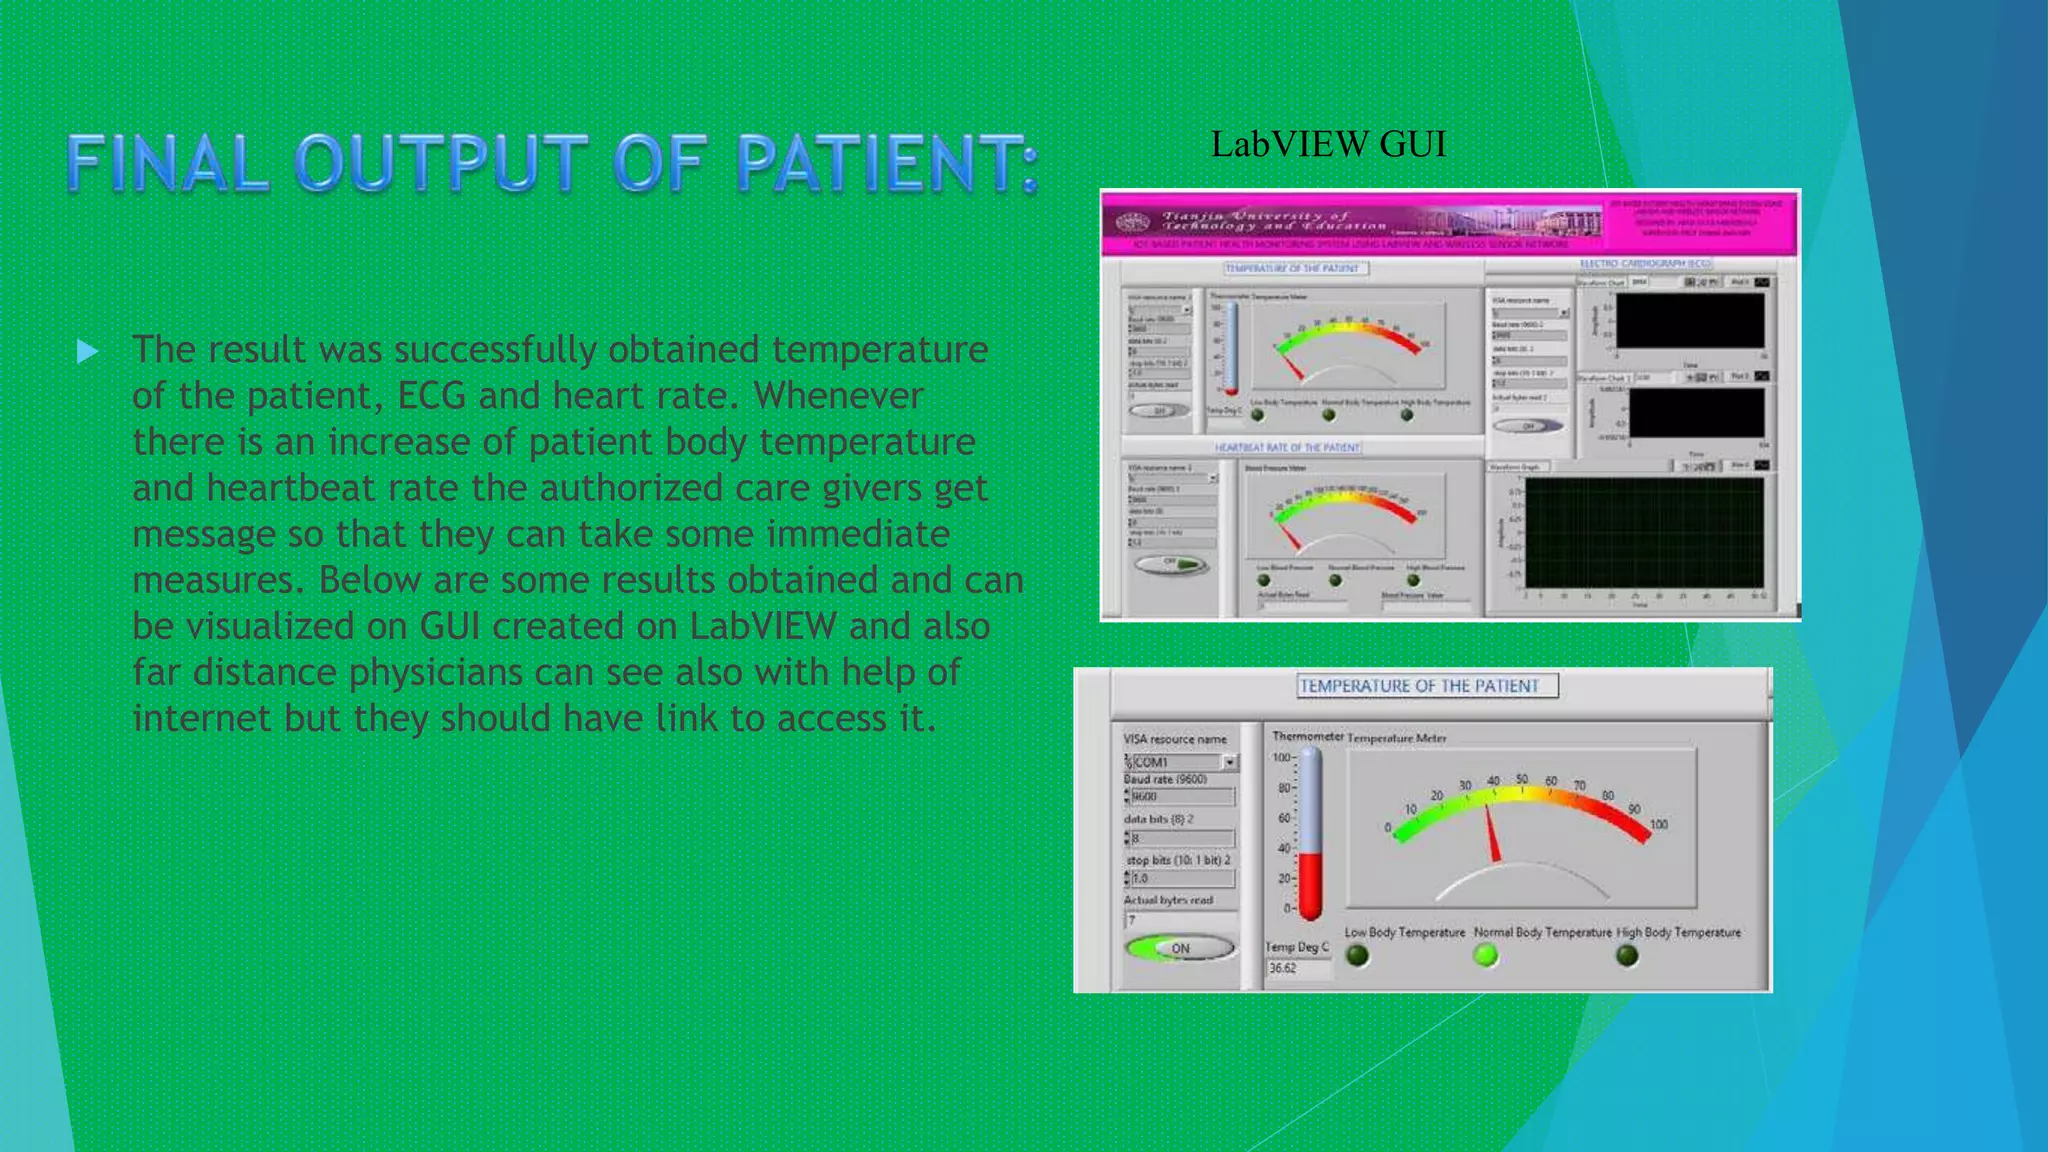
IOT Based Patient Health Monitoring System Using LABVIEW AND
WIRELESS SENSORS
 With rapid development of economies, growth of aging population and the prevalence of
chronic diseases across the world, there is an urgent need to find new ways to improve
patient outcomes, increase access to care, and reduce the cost of medical care.
 A health care monitoring system is necessary to constantly monitor patient’s physiological
parameters. The tele-medical system focuses on the measurement and evaluation of vital
parameters e.g. temperature, electrocardiogram (ECG), heart rate variability, fall detection
etc.
 This will enable doctors and care givers to observe patients without having to be physically
present at their bedside, be it in the hospital or in their home.
 One of the related approach was automatic
wireless health monitoring system where by
an automatic wireless health monitoring
system was used to measure patient’s body
temperature and heartbeat by using
embedded technology.
 system was using both the sensors like
heartbeat sensor and temperature sensor.
 The second related work was a Hospital
Healthcare Monitoring System Using Wireless
Sensor Networks.
 The system was able to detect the abnormal
conditions, issue an alarm to the patient and
send a SMS to the physician.
Automatic wireless health
monitoring system block diagram
HARD WARE
Consists of
1.Transmitter section,
2. Receiver section.
SOFT WARE:
consists of:
1.XCTU software,
2.LabVIEW,
3.Arduino IDE software
The transmitter section consists of analog sensors
to measure patient physiological parameters,
Arduino Mega 2560, Heartrate amplifier circuit,
ECG amplifier circuit, I2C LCD 2004 display, GSM
modem to alert the care givers, power supply
and XBEE module to transmit signals from
transmitter to receiver section
b) Temperature Sensor LM35
LM35 is a precision IC temperature sensor with
its output proportional to the temperature.
The operating temperature range is from -
55°C to 150°C.
The LM35 has been used to measure human
body temperature and pin 2 OUT connected to
Arduino mega 2560 analog pin A0.
The heartrate amplifier circuit consist amplifier
and fingertip sensor/heart rate sensor.
The heartbeat is measured with the help of
fingertip sensor which consists of an infra-red
(IR) light emitting diode transmitter and an IR
photo detecting receiver.
The signal is amplified using an operational
amplifier.
The output of the amplifier circuit is send
directly to Arduino mega 2560microcontroller
analog pin A1 for further processing.
Calculating heartrate: Formula used P5 = t2 – t1
P1 = P5 /5 Rate = 60000/ P1; Where t1 is first
pulse counter value t2 is list pulse counter value,
P5 is five pulse counter and P1 is single pulse
counter.
Figure 5: Heart rate amplifier circuit designed
on ALTIUM designer software
Electrocardiography (ECG/EKG) is the process of
recording the electrical activity of the heart over
a period of time using electrodes placed on the
skin.
The amplifier circuit has been used to amplify the
signal coming from electrodes placed to patient
during measurements.
The operational amplifier used for this circuit is
LM324.
circuit was designed on ALTIUM designer software
and tested on multi sim software. Below is the
circuit diagram of ECG amplifier circuit.
ECG amplifier circuit designed on
ALTIUM designer software
ECG waveform of normal sinus
rhythm and ECG Sensors
 The power supply circuit designed is to help to power the
heart rate circuit, ECG circuit and GSM modem. The input of
the power supply ranges 9-18Vdc and the output is 5Vdc.
 The regulator LM7805 has been used to regulate the voltage
for this purposes.
 The power supply or external power source has been used to
power the Arduino mega 2560 too so there is no need to worry
about it because the Arduino boards normally has inbuilt
power supply .
The Arduino Mega 2560 is a microcontroller board
based on the ATmega2560.
It has 54 digital input/output pins (of which 15 can
be used as PWM outputs), 16 analog inputs, 4 UARTs
(hardware serial ports), a 16 MHz crystal oscillator, a
USB connection, a power jack, an ICSP header, and a
reset button.
GSM/GPRS module is a breakout board and minimum
system of SIM900 Quad-band/SIM900A Dual-band
GSM/GPRS module.
The module has been used to alert the care givers in
case the temperature or heart rate of the patient is
abnormal.
This is the very popular 2.4GHz XBEE XBP24-
AWI-001 module from Digi.
These modules take the 802.15.4 stack (the
basis for ZigBee) and wrap it into a simple to
use serial command set.
This module has been used to both side
transmitter section and receiver side.
SOFTWARE:
XCTU is a free, multi-platform application
compatible with Windows, Mac-OS and Linux.
It is designed to enable developers to
interact with Digi RF modules through a
simple-to-use graphical interface.
The Arduino IDE is a cross platform developer tool
written in Java.
Programs written using Arduino Software (IDE) are
called sketches.
The console displays text output by the Arduino
Software (IDE), including complete error messages
and other information .
LabVIEW is an integrated development environment designed specifically for
engineers and scientists building measurement and control systems.
With a native graphical programming language, built-in IP for data analysis and
signal processing, and an open architecture that enables integration of any
hardware device and any software approach.
LabVIEW Integrated development environment has two window view front panel
and block diagram.
d) LabVIEW Web Publishing Tool
The Embedded option embeds the front panel of the
VI so clients can view and control the front panel
remotely using a browser. The VI must be in memory
on the server computer so clients can view and
control the front panel.
The Snapshot option displays a static image of the
front panel in a browser. Snapshot does not allow
you to interact with the controls of the VI from the
browser.
The Monitor option displays an animated snapshot
that updates continuously. Monitor does not allow
you to interact with the controls of the VI from the
browser. LabVIEW Web Publishing Tool
 The result was successfully obtained temperature
of the patient, ECG and heart rate. Whenever
there is an increase of patient body temperature
and heartbeat rate the authorized care givers get
message so that they can take some immediate
measures. Below are some results obtained and can
be visualized on GUI created on LabVIEW and also
far distance physicians can see also with help of
internet but they should have link to access it.
LabVIEW GUI
patient monitoring systems are very useful tools to
enable monitoring patient health much attention to the
development of this topic should be taken into
consideration in order to enhance access to care and
improve patient health. This can be developed by
increasing number of sensors so that all physiological
parameters can be observed
PATIENT HEALTH MONITORING SYSTEM

PATIENT HEALTH MONITORING SYSTEM

  • 1.
    IOT Based PatientHealth Monitoring System Using LABVIEW AND WIRELESS SENSORS
  • 2.
     With rapiddevelopment of economies, growth of aging population and the prevalence of chronic diseases across the world, there is an urgent need to find new ways to improve patient outcomes, increase access to care, and reduce the cost of medical care.  A health care monitoring system is necessary to constantly monitor patient’s physiological parameters. The tele-medical system focuses on the measurement and evaluation of vital parameters e.g. temperature, electrocardiogram (ECG), heart rate variability, fall detection etc.  This will enable doctors and care givers to observe patients without having to be physically present at their bedside, be it in the hospital or in their home.
  • 3.
     One ofthe related approach was automatic wireless health monitoring system where by an automatic wireless health monitoring system was used to measure patient’s body temperature and heartbeat by using embedded technology.  system was using both the sensors like heartbeat sensor and temperature sensor.  The second related work was a Hospital Healthcare Monitoring System Using Wireless Sensor Networks.  The system was able to detect the abnormal conditions, issue an alarm to the patient and send a SMS to the physician. Automatic wireless health monitoring system block diagram
  • 4.
    HARD WARE Consists of 1.Transmittersection, 2. Receiver section. SOFT WARE: consists of: 1.XCTU software, 2.LabVIEW, 3.Arduino IDE software
  • 5.
    The transmitter sectionconsists of analog sensors to measure patient physiological parameters, Arduino Mega 2560, Heartrate amplifier circuit, ECG amplifier circuit, I2C LCD 2004 display, GSM modem to alert the care givers, power supply and XBEE module to transmit signals from transmitter to receiver section b) Temperature Sensor LM35 LM35 is a precision IC temperature sensor with its output proportional to the temperature. The operating temperature range is from - 55°C to 150°C. The LM35 has been used to measure human body temperature and pin 2 OUT connected to Arduino mega 2560 analog pin A0.
  • 6.
    The heartrate amplifiercircuit consist amplifier and fingertip sensor/heart rate sensor. The heartbeat is measured with the help of fingertip sensor which consists of an infra-red (IR) light emitting diode transmitter and an IR photo detecting receiver. The signal is amplified using an operational amplifier. The output of the amplifier circuit is send directly to Arduino mega 2560microcontroller analog pin A1 for further processing. Calculating heartrate: Formula used P5 = t2 – t1 P1 = P5 /5 Rate = 60000/ P1; Where t1 is first pulse counter value t2 is list pulse counter value, P5 is five pulse counter and P1 is single pulse counter. Figure 5: Heart rate amplifier circuit designed on ALTIUM designer software
  • 7.
    Electrocardiography (ECG/EKG) isthe process of recording the electrical activity of the heart over a period of time using electrodes placed on the skin. The amplifier circuit has been used to amplify the signal coming from electrodes placed to patient during measurements. The operational amplifier used for this circuit is LM324. circuit was designed on ALTIUM designer software and tested on multi sim software. Below is the circuit diagram of ECG amplifier circuit. ECG amplifier circuit designed on ALTIUM designer software ECG waveform of normal sinus rhythm and ECG Sensors
  • 8.
     The powersupply circuit designed is to help to power the heart rate circuit, ECG circuit and GSM modem. The input of the power supply ranges 9-18Vdc and the output is 5Vdc.  The regulator LM7805 has been used to regulate the voltage for this purposes.  The power supply or external power source has been used to power the Arduino mega 2560 too so there is no need to worry about it because the Arduino boards normally has inbuilt power supply .
  • 9.
    The Arduino Mega2560 is a microcontroller board based on the ATmega2560. It has 54 digital input/output pins (of which 15 can be used as PWM outputs), 16 analog inputs, 4 UARTs (hardware serial ports), a 16 MHz crystal oscillator, a USB connection, a power jack, an ICSP header, and a reset button. GSM/GPRS module is a breakout board and minimum system of SIM900 Quad-band/SIM900A Dual-band GSM/GPRS module. The module has been used to alert the care givers in case the temperature or heart rate of the patient is abnormal.
  • 10.
    This is thevery popular 2.4GHz XBEE XBP24- AWI-001 module from Digi. These modules take the 802.15.4 stack (the basis for ZigBee) and wrap it into a simple to use serial command set. This module has been used to both side transmitter section and receiver side. SOFTWARE: XCTU is a free, multi-platform application compatible with Windows, Mac-OS and Linux. It is designed to enable developers to interact with Digi RF modules through a simple-to-use graphical interface.
  • 11.
    The Arduino IDEis a cross platform developer tool written in Java. Programs written using Arduino Software (IDE) are called sketches. The console displays text output by the Arduino Software (IDE), including complete error messages and other information .
  • 12.
    LabVIEW is anintegrated development environment designed specifically for engineers and scientists building measurement and control systems. With a native graphical programming language, built-in IP for data analysis and signal processing, and an open architecture that enables integration of any hardware device and any software approach. LabVIEW Integrated development environment has two window view front panel and block diagram. d) LabVIEW Web Publishing Tool The Embedded option embeds the front panel of the VI so clients can view and control the front panel remotely using a browser. The VI must be in memory on the server computer so clients can view and control the front panel. The Snapshot option displays a static image of the front panel in a browser. Snapshot does not allow you to interact with the controls of the VI from the browser. The Monitor option displays an animated snapshot that updates continuously. Monitor does not allow you to interact with the controls of the VI from the browser. LabVIEW Web Publishing Tool
  • 13.
     The resultwas successfully obtained temperature of the patient, ECG and heart rate. Whenever there is an increase of patient body temperature and heartbeat rate the authorized care givers get message so that they can take some immediate measures. Below are some results obtained and can be visualized on GUI created on LabVIEW and also far distance physicians can see also with help of internet but they should have link to access it. LabVIEW GUI
  • 14.
    patient monitoring systemsare very useful tools to enable monitoring patient health much attention to the development of this topic should be taken into consideration in order to enhance access to care and improve patient health. This can be developed by increasing number of sensors so that all physiological parameters can be observed