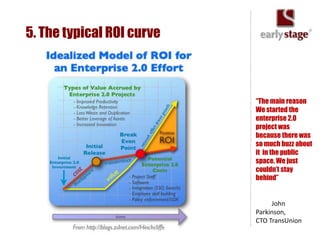
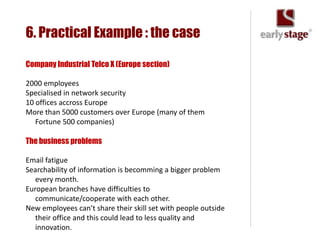
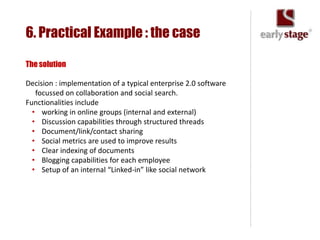
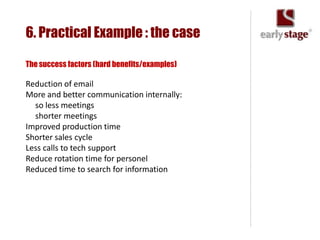
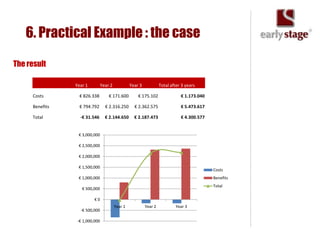
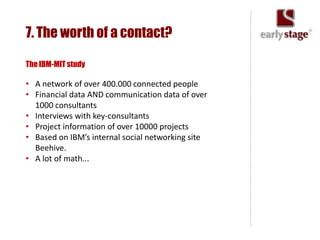
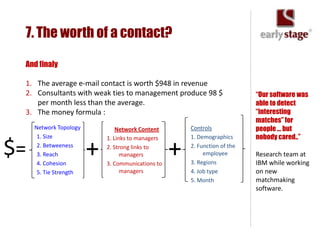
Calculating the ROI of
   collaboration tools


                         Bart Van Den Kieboom
                         June 17 2009
What will we talk about in the coming 45
minutes?

1.   Setting the scene…
2.   Why calculating ROI?
3.   Challenges in calculating ROI for Enterprise 2.0
     projects.
4.   Components of ROI-calculation
5.   The typical ROI-curve
6.   A practical example
7.   Bonus : what is the value of one contact in your
     network (948 $)
1   Setting the scene
1. Setting the scene


     Enabling interactivity
Increased collaboration
          Change Management
       Social Computing
       Social Media
1. Setting the scene


                       And many, many more...
2   Why Calculating
    ROI?
2. Why Calculating ROI?
Pré-project

•   It’s a necessary part of each business case
•   To get approval and support from management
•   It will help you to identify the real benefits and business
    drivers
•   A quantitative approach tends to be more acceptable than
    evangelistation
•   It will provide a set of KPI’s for future evaluation
•   It helps to see the big picture
2. Why Calculating ROI?
Post-project

•   Just because for once you will have the real numbers
•   It will help to detect problems
•   To adjust the business case
•   To be prepared for the first evaluation
3   The Challenges?
3. The challenges

• The benefits are often difficult to measure
• Enterprise 2.0 tools are rarely used as originaly intended
• The uptake and use of collaboration software is very
  difficult to forecast
• Direct costs are often low, so more time is needed to        “The benefit of Web
  calculate the the real time spend.                           2.0 tools within the
• The cost of doing a ROI-study should be aligned with the     enterprise is very
                                                               squishy, very soft. It
  cost of the project.
                                                               is all about
• The evolution of the collaboration software during the       productivity, comm
  analysed period will impact the ROI calculations.            unication and
• You will need data from the HR-department to get the         worker
  right number on personel cost                                efficiency, which
                                                               are notoriously
                                                               difficult to
                                                               measure.”


                                                                    Oliver
                                                               Young, Forrester
                                                               Research
4   Components of
    ROI calculation?
4. Components of ROI calculation

Costs

Technology related
    • Software licence fees
    • Deployment
    • Maintenance
    • Integration costs
    • Additional hardware required
    • Bandwith
Adoption
    • Training
    • Time to learn
4. Components of ROI calculation

Tangible assets

Revenue
     • New revenue from existing clients
     • Revenue from new clients
Increased productivity
     • Time saved searching for info
     • Increased effectiveness of access to better
       information
Company internal communication
     • Less email
     • Fewer phone calls
     • Fewer meetings
     • Less travel
Technology related
     • Replacement of existing software licences
     • Reallocation of IT staff
4. Components of ROI calculation

Tangible assets (cont„d)

Product development
    • Reduced time to market
    • Cost of market research
Supply-side (partners)
    • Reduced communication costs
    • More efficient supply
4. Components of ROI calculation

Intangible assets

Brand capital
     • Increased sales
     • Ability to hire better staff          “Improvements in
     • Increased customer loyalty            intangible assets
Social capital                               affect financial
                                             outcomes through
     • Greater collaboration
                                             chains of cause-
     • Cost of market research               and-effect
     • Lower staff turnover                  relationships”
Innovation
     • Create new markets
     • Take market share                           Robert Kaplan
Recruitment/retention                        and David
                                             Norton, Harvard
     • Lower recruiting and training costs
                                             Bus. School
4. Components of ROI calculation


                                   “a key aspect of the
                                   ROI issue is that the
                                   strategic
                                   capabilities
                                   represented by
                                   Enterprise 2.0 are
                                   primarily emergent
                                   in nature, instead of
                                   carefully aimed at
                                   and unleashed at
                                   specific problems”

                                   Dion Hinchcliffe,
                                   ZDNet
5   The typical
    ROI-curve
5. The typical ROI curve


                           “The main reason
                           We started the
                           enterprise 2.0
                           project was
                           because there was
                           so much buzz about
                           it in the public
                           space. We just
                           couldn‟t stay
                           behind”


                                John
                           Parkinson,
                           CTO TransUnion
6   Practical
    Example
6. Practical Example : the case

Company Industrial Telco X (Europe section)

2000 employees
Specialised in network security
10 offices accross Europe
More than 5000 customers over Europe (many of them
   Fortune 500 companies)

The business problems

Email fatigue
Searchability of information is becomming a bigger problem
   every month.
European branches have difficulties to
   communicate/cooperate with each other.
New employees can’t share their skill set with people outside
   their office and this could lead to less quality and
   innovation.
6. Practical Example : the case

The solution

Decision : implementation of a typical enterprise 2.0 software
   focussed on collaboration and social search.
Functionalities include
  • working in online groups (internal and external)
  • Discussion capabilities through structured threads
  • Document/link/contact sharing
  • Social metrics are used to improve results
  • Clear indexing of documents
  • Blogging capabilities for each employee
  • Setup of an internal “Linked-in” like social network
6. Practical Example : the case

The success factors (hard benefits/examples)

Reduction of email
More and better communication internally:
  so less meetings
  shorter meetings
Improved production time
Shorter sales cycle
Less calls to tech support
Reduce rotation time for personel
Reduced time to search for information
6. Practical Example : the case

The success factors (soft benefits)

Increased client satisfaction
Less frustration for employees to communicate
   amongst each other
Better evaluation of employees
Better cross-departemental communication
Improved brand image
Better recruitment
Shorter adaption time for new employees
6. Practical Example : the case

The costs (first year)

Software licences                                   120.000 €
Hardware + bandwith                                 55.000 €
Consultancy to help for succesfull implementation   50.000 €
IT staff needed for implementation (2 FTE during    28.000 €
2 months) (2 * 7000 * 2)
Internal trainers and change management (2 FTE      42.000 €
during 3 months) (2* 7000 * 3)
Assimilation time for the employees (2000 empl.     497.737 €
55.000 € of value per employee) * (1 day/221)
Maintenance and support (0,4 FTE per year)          33.600 €

Total : 826.337 €
6. Practical Example : the case

The costs (recurring)

Software Maintenance (20%)                   24.000 €
Hardware maintenance + bandwith              14.000 €
Maintenance and support (0,4 FTE per year)   33.600 €
New developments (and change requests)       100.000 €


Total : 171.600 €
6. Practical Example : the case

The benefits (first year)

Email reduction
  The cost
  The average manager spends 30 minutes a day answering mails to
  his team-members
  The average sallary is 70.000 € per year
  This means a cost for the company of :
  300 managers * 70.000 € / 221 working days / 16 half hours per day
  = 5939 € per day.
  The reduction
  Thanks to the new software the managers need 10 minutes less to
  answer mails. So the new cost is : (5939 / 3) * 2 = 3959 € per day
  or a benefit of 1980 € per day

Total benefit per year : 437,500 € per year
6. Practical Example : the case

The benefits (first year)

Improved search time
  The cost
  The average employee spends 20 minutes a day looking for info
  The average sallary is 55.000 € per year
  This means a cost for the company of :
  2000 employees * 55.000 € / 221 working days / (480/20) per day =
  20.739,00 € per day.
  The reduction
  Thanks to the new software the employees need 8 minutes less to
  find information. So the new cost is : (2000 employees * 55.000 € /
  221 working days / (480/12) per day : 12.443,00 €

Cost reduction : 8296 € per day!

Total benefit per year : 1.833.333,00 € per year
6. Practical Example : the case

The benefits (second year)

Improved Employee collaboration
  It’s not so easy to measure this.
  Assume that with the improved collaboration you get new R&D-
  teams.
  10 % of the R&D projects generate a real value of approx. 500.000 €
  Thanks to collaboration software 10% of the new teams will
  generate new value.
  In this example we assume that 20 new projects are created that
  wouldn’t have existed otherwise. 2 of them will create added value.

  here we assume that an added value of 2 times 500.000 € is created
  (but only from the second year on). We will not include it into the
  ROI however because of the too abstract assumptions.
6. Practical Example : the case

The benefits

Better communications with customers
  By allowing the clients access to the platform and by using it’s
  benefits with the client a better relationship will be build.
  It also creates more confidence
  The global result will be a bigger client retention with more recurring
  deals.
  This is a typical KPI that can be measured post-implementation but :

•   it is difficult to attribute the correct part of increased sales to the
  software.
•   And what if there is decreased sales?
6. Practical Example : the case

Final assumption

• Benefits for the first year are limited due to the implementation
  time.
• It would be incorrect to attribute all benefits directly to year 1.
• We only attribute 35% of the calculated benefits to year one
6. Practical Example : the case

The result

                Year 1          Year 2            Year 3            Total after 3 years

     Costs        € 826.338         € 171.600         € 175.102                € 1.173.040

     Benefits     € 794.792       € 2.316.250       € 2.362.575                € 5.473.617

     Total        -€ 31.546       € 2.144.650       € 2.187.473                € 4.300.577


                 € 3,000,000

                 € 2,500,000

                 € 2,000,000

                 € 1,500,000
                                                                                             Costs
                 € 1,000,000                                                                 Benefits
                                                                                             Total
                   € 500,000

                          €0
                                         Year 1            Year 2           Year 3
                  -€ 500,000

                 -€ 1,000,000
7   The bonus :
    948 $
7. The worth of a contact?

The IBM-MIT study

• A network of over 400.000 connected people
• Financial data AND communication data of over
  1000 consultants
• Interviews with key-consultants
• Project information of over 10000 projects
• Based on IBM’s internal social networking site
  Beehive.
• A lot of math...
7. The worth of a contact?

The key findings

1. The structural diversity and the centrality of your network
   have a positive impact on your work performance.

2. Having a few strong ties with the management is better
   than having many weak ties with the management

3. Having strong ties with management is good (as said
   above) but having to many managers working on your
   project is bad for productivity.

4. Equipping your project team with people who have
   desirable network characteristics will have a positive
   impact on the projects performance.
7. The worth of a contact?

 And finaly

 1. The average e-mail contact is worth $948 in revenue
 2. Consultants with weak ties to management produce 98 $                   “Our software was
    per month less than the average.                                        able to detect
 3. The money formula :                                                     “interesting
                                                                            matches” for
     Network Topology           Network Content        Controls             people ... but
      1. Size               1. Links to managers       1. Demographics      nobody cared..”

$=    2. Betweeness
      3. Reach
      4. Cohesion
                        +   2. Strong links to
                                  managers
                            3. Communications to
                                                   +   2. Function of the
                                                            employee
                                                       3. Regions
                                                                            Research team at
                                                                            IBM while working
      5. Tie Strength             managers             4. Job type          on new
                                                       5. Month             matchmaking
                                                                            software.
Thank you

Calculating the ROI of collaboration tools

  • 1.
    Calculating the ROIof collaboration tools Bart Van Den Kieboom June 17 2009
  • 2.
    What will wetalk about in the coming 45 minutes? 1. Setting the scene… 2. Why calculating ROI? 3. Challenges in calculating ROI for Enterprise 2.0 projects. 4. Components of ROI-calculation 5. The typical ROI-curve 6. A practical example 7. Bonus : what is the value of one contact in your network (948 $)
  • 3.
    1 Setting the scene
  • 4.
    1. Setting thescene Enabling interactivity Increased collaboration Change Management Social Computing Social Media
  • 5.
    1. Setting thescene And many, many more...
  • 6.
    2 Why Calculating ROI?
  • 7.
    2. Why CalculatingROI? Pré-project • It’s a necessary part of each business case • To get approval and support from management • It will help you to identify the real benefits and business drivers • A quantitative approach tends to be more acceptable than evangelistation • It will provide a set of KPI’s for future evaluation • It helps to see the big picture
  • 8.
    2. Why CalculatingROI? Post-project • Just because for once you will have the real numbers • It will help to detect problems • To adjust the business case • To be prepared for the first evaluation
  • 9.
    3 The Challenges?
  • 10.
    3. The challenges •The benefits are often difficult to measure • Enterprise 2.0 tools are rarely used as originaly intended • The uptake and use of collaboration software is very difficult to forecast • Direct costs are often low, so more time is needed to “The benefit of Web calculate the the real time spend. 2.0 tools within the • The cost of doing a ROI-study should be aligned with the enterprise is very squishy, very soft. It cost of the project. is all about • The evolution of the collaboration software during the productivity, comm analysed period will impact the ROI calculations. unication and • You will need data from the HR-department to get the worker right number on personel cost efficiency, which are notoriously difficult to measure.” Oliver Young, Forrester Research
  • 11.
    4 Components of ROI calculation?
  • 12.
    4. Components ofROI calculation Costs Technology related • Software licence fees • Deployment • Maintenance • Integration costs • Additional hardware required • Bandwith Adoption • Training • Time to learn
  • 13.
    4. Components ofROI calculation Tangible assets Revenue • New revenue from existing clients • Revenue from new clients Increased productivity • Time saved searching for info • Increased effectiveness of access to better information Company internal communication • Less email • Fewer phone calls • Fewer meetings • Less travel Technology related • Replacement of existing software licences • Reallocation of IT staff
  • 14.
    4. Components ofROI calculation Tangible assets (cont„d) Product development • Reduced time to market • Cost of market research Supply-side (partners) • Reduced communication costs • More efficient supply
  • 15.
    4. Components ofROI calculation Intangible assets Brand capital • Increased sales • Ability to hire better staff “Improvements in • Increased customer loyalty intangible assets Social capital affect financial outcomes through • Greater collaboration chains of cause- • Cost of market research and-effect • Lower staff turnover relationships” Innovation • Create new markets • Take market share Robert Kaplan Recruitment/retention and David Norton, Harvard • Lower recruiting and training costs Bus. School
  • 16.
    4. Components ofROI calculation “a key aspect of the ROI issue is that the strategic capabilities represented by Enterprise 2.0 are primarily emergent in nature, instead of carefully aimed at and unleashed at specific problems” Dion Hinchcliffe, ZDNet
  • 17.
    5 The typical ROI-curve
  • 18.
    5. The typicalROI curve “The main reason We started the enterprise 2.0 project was because there was so much buzz about it in the public space. We just couldn‟t stay behind” John Parkinson, CTO TransUnion
  • 19.
    6 Practical Example
  • 21.
    6. Practical Example: the case Company Industrial Telco X (Europe section) 2000 employees Specialised in network security 10 offices accross Europe More than 5000 customers over Europe (many of them Fortune 500 companies) The business problems Email fatigue Searchability of information is becomming a bigger problem every month. European branches have difficulties to communicate/cooperate with each other. New employees can’t share their skill set with people outside their office and this could lead to less quality and innovation.
  • 22.
    6. Practical Example: the case The solution Decision : implementation of a typical enterprise 2.0 software focussed on collaboration and social search. Functionalities include • working in online groups (internal and external) • Discussion capabilities through structured threads • Document/link/contact sharing • Social metrics are used to improve results • Clear indexing of documents • Blogging capabilities for each employee • Setup of an internal “Linked-in” like social network
  • 23.
    6. Practical Example: the case The success factors (hard benefits/examples) Reduction of email More and better communication internally: so less meetings shorter meetings Improved production time Shorter sales cycle Less calls to tech support Reduce rotation time for personel Reduced time to search for information
  • 24.
    6. Practical Example: the case The success factors (soft benefits) Increased client satisfaction Less frustration for employees to communicate amongst each other Better evaluation of employees Better cross-departemental communication Improved brand image Better recruitment Shorter adaption time for new employees
  • 25.
    6. Practical Example: the case The costs (first year) Software licences 120.000 € Hardware + bandwith 55.000 € Consultancy to help for succesfull implementation 50.000 € IT staff needed for implementation (2 FTE during 28.000 € 2 months) (2 * 7000 * 2) Internal trainers and change management (2 FTE 42.000 € during 3 months) (2* 7000 * 3) Assimilation time for the employees (2000 empl. 497.737 € 55.000 € of value per employee) * (1 day/221) Maintenance and support (0,4 FTE per year) 33.600 € Total : 826.337 €
  • 26.
    6. Practical Example: the case The costs (recurring) Software Maintenance (20%) 24.000 € Hardware maintenance + bandwith 14.000 € Maintenance and support (0,4 FTE per year) 33.600 € New developments (and change requests) 100.000 € Total : 171.600 €
  • 27.
    6. Practical Example: the case The benefits (first year) Email reduction The cost The average manager spends 30 minutes a day answering mails to his team-members The average sallary is 70.000 € per year This means a cost for the company of : 300 managers * 70.000 € / 221 working days / 16 half hours per day = 5939 € per day. The reduction Thanks to the new software the managers need 10 minutes less to answer mails. So the new cost is : (5939 / 3) * 2 = 3959 € per day or a benefit of 1980 € per day Total benefit per year : 437,500 € per year
  • 28.
    6. Practical Example: the case The benefits (first year) Improved search time The cost The average employee spends 20 minutes a day looking for info The average sallary is 55.000 € per year This means a cost for the company of : 2000 employees * 55.000 € / 221 working days / (480/20) per day = 20.739,00 € per day. The reduction Thanks to the new software the employees need 8 minutes less to find information. So the new cost is : (2000 employees * 55.000 € / 221 working days / (480/12) per day : 12.443,00 € Cost reduction : 8296 € per day! Total benefit per year : 1.833.333,00 € per year
  • 29.
    6. Practical Example: the case The benefits (second year) Improved Employee collaboration It’s not so easy to measure this. Assume that with the improved collaboration you get new R&D- teams. 10 % of the R&D projects generate a real value of approx. 500.000 € Thanks to collaboration software 10% of the new teams will generate new value. In this example we assume that 20 new projects are created that wouldn’t have existed otherwise. 2 of them will create added value. here we assume that an added value of 2 times 500.000 € is created (but only from the second year on). We will not include it into the ROI however because of the too abstract assumptions.
  • 30.
    6. Practical Example: the case The benefits Better communications with customers By allowing the clients access to the platform and by using it’s benefits with the client a better relationship will be build. It also creates more confidence The global result will be a bigger client retention with more recurring deals. This is a typical KPI that can be measured post-implementation but : • it is difficult to attribute the correct part of increased sales to the software. • And what if there is decreased sales?
  • 31.
    6. Practical Example: the case Final assumption • Benefits for the first year are limited due to the implementation time. • It would be incorrect to attribute all benefits directly to year 1. • We only attribute 35% of the calculated benefits to year one
  • 32.
    6. Practical Example: the case The result Year 1 Year 2 Year 3 Total after 3 years Costs € 826.338 € 171.600 € 175.102 € 1.173.040 Benefits € 794.792 € 2.316.250 € 2.362.575 € 5.473.617 Total -€ 31.546 € 2.144.650 € 2.187.473 € 4.300.577 € 3,000,000 € 2,500,000 € 2,000,000 € 1,500,000 Costs € 1,000,000 Benefits Total € 500,000 €0 Year 1 Year 2 Year 3 -€ 500,000 -€ 1,000,000
  • 33.
    7 The bonus : 948 $
  • 34.
    7. The worthof a contact? The IBM-MIT study • A network of over 400.000 connected people • Financial data AND communication data of over 1000 consultants • Interviews with key-consultants • Project information of over 10000 projects • Based on IBM’s internal social networking site Beehive. • A lot of math...
  • 35.
    7. The worthof a contact? The key findings 1. The structural diversity and the centrality of your network have a positive impact on your work performance. 2. Having a few strong ties with the management is better than having many weak ties with the management 3. Having strong ties with management is good (as said above) but having to many managers working on your project is bad for productivity. 4. Equipping your project team with people who have desirable network characteristics will have a positive impact on the projects performance.
  • 36.
    7. The worthof a contact? And finaly 1. The average e-mail contact is worth $948 in revenue 2. Consultants with weak ties to management produce 98 $ “Our software was per month less than the average. able to detect 3. The money formula : “interesting matches” for Network Topology Network Content Controls people ... but 1. Size 1. Links to managers 1. Demographics nobody cared..” $= 2. Betweeness 3. Reach 4. Cohesion + 2. Strong links to managers 3. Communications to + 2. Function of the employee 3. Regions Research team at IBM while working 5. Tie Strength managers 4. Job type on new 5. Month matchmaking software.
  • 37.