Downloaded 1,547 times
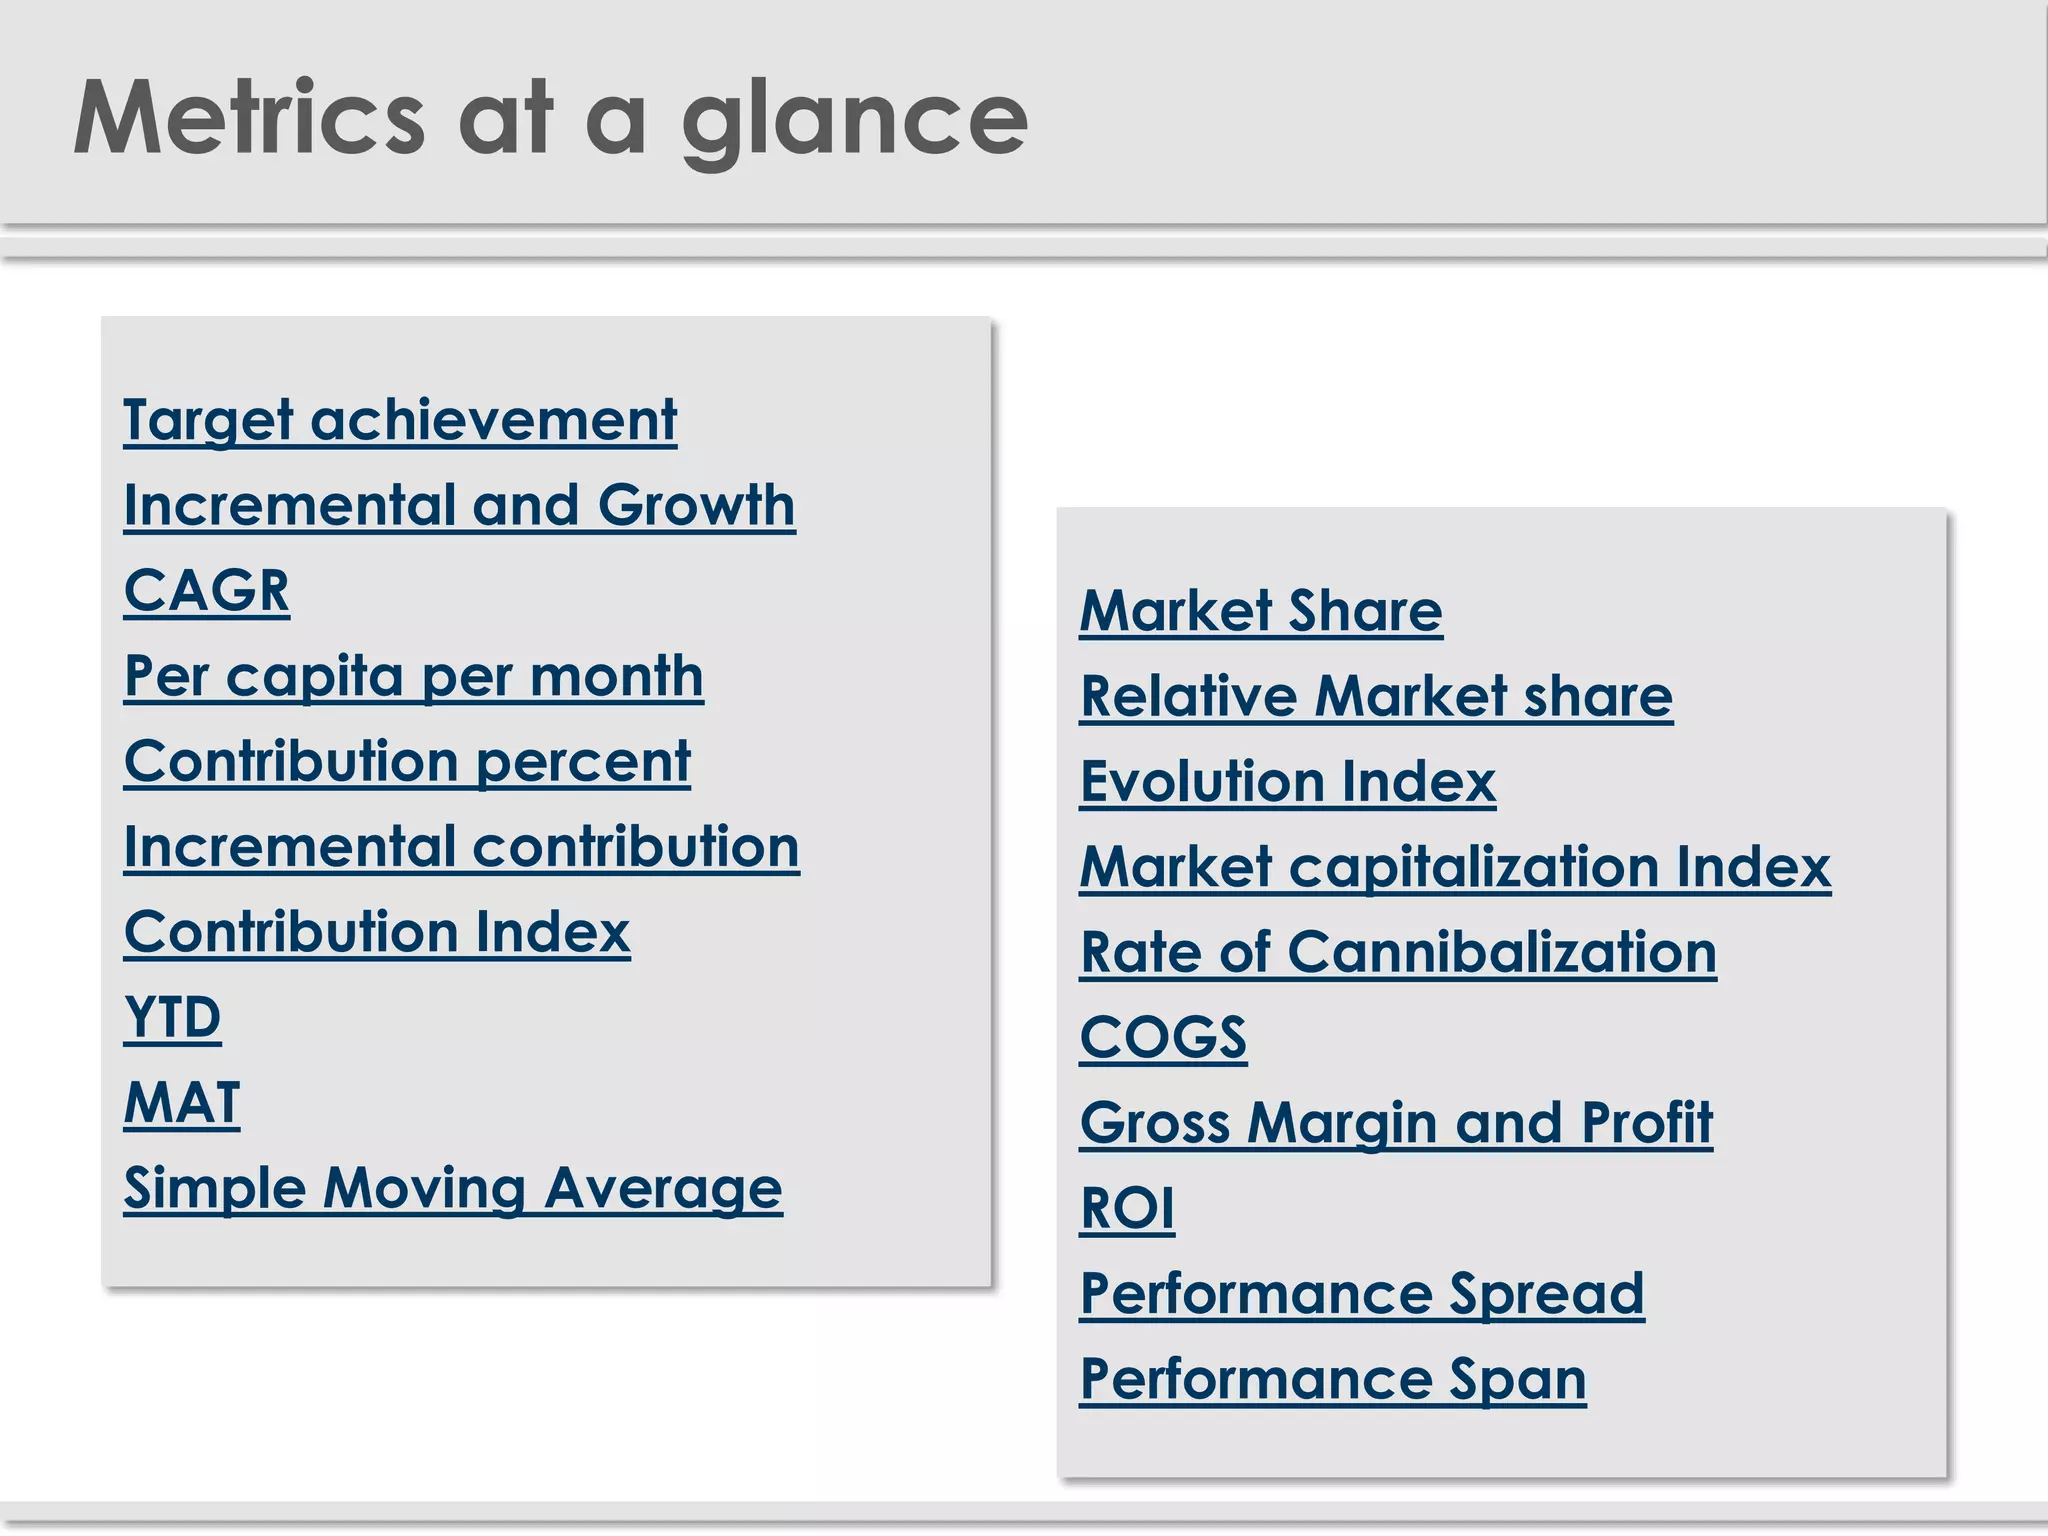
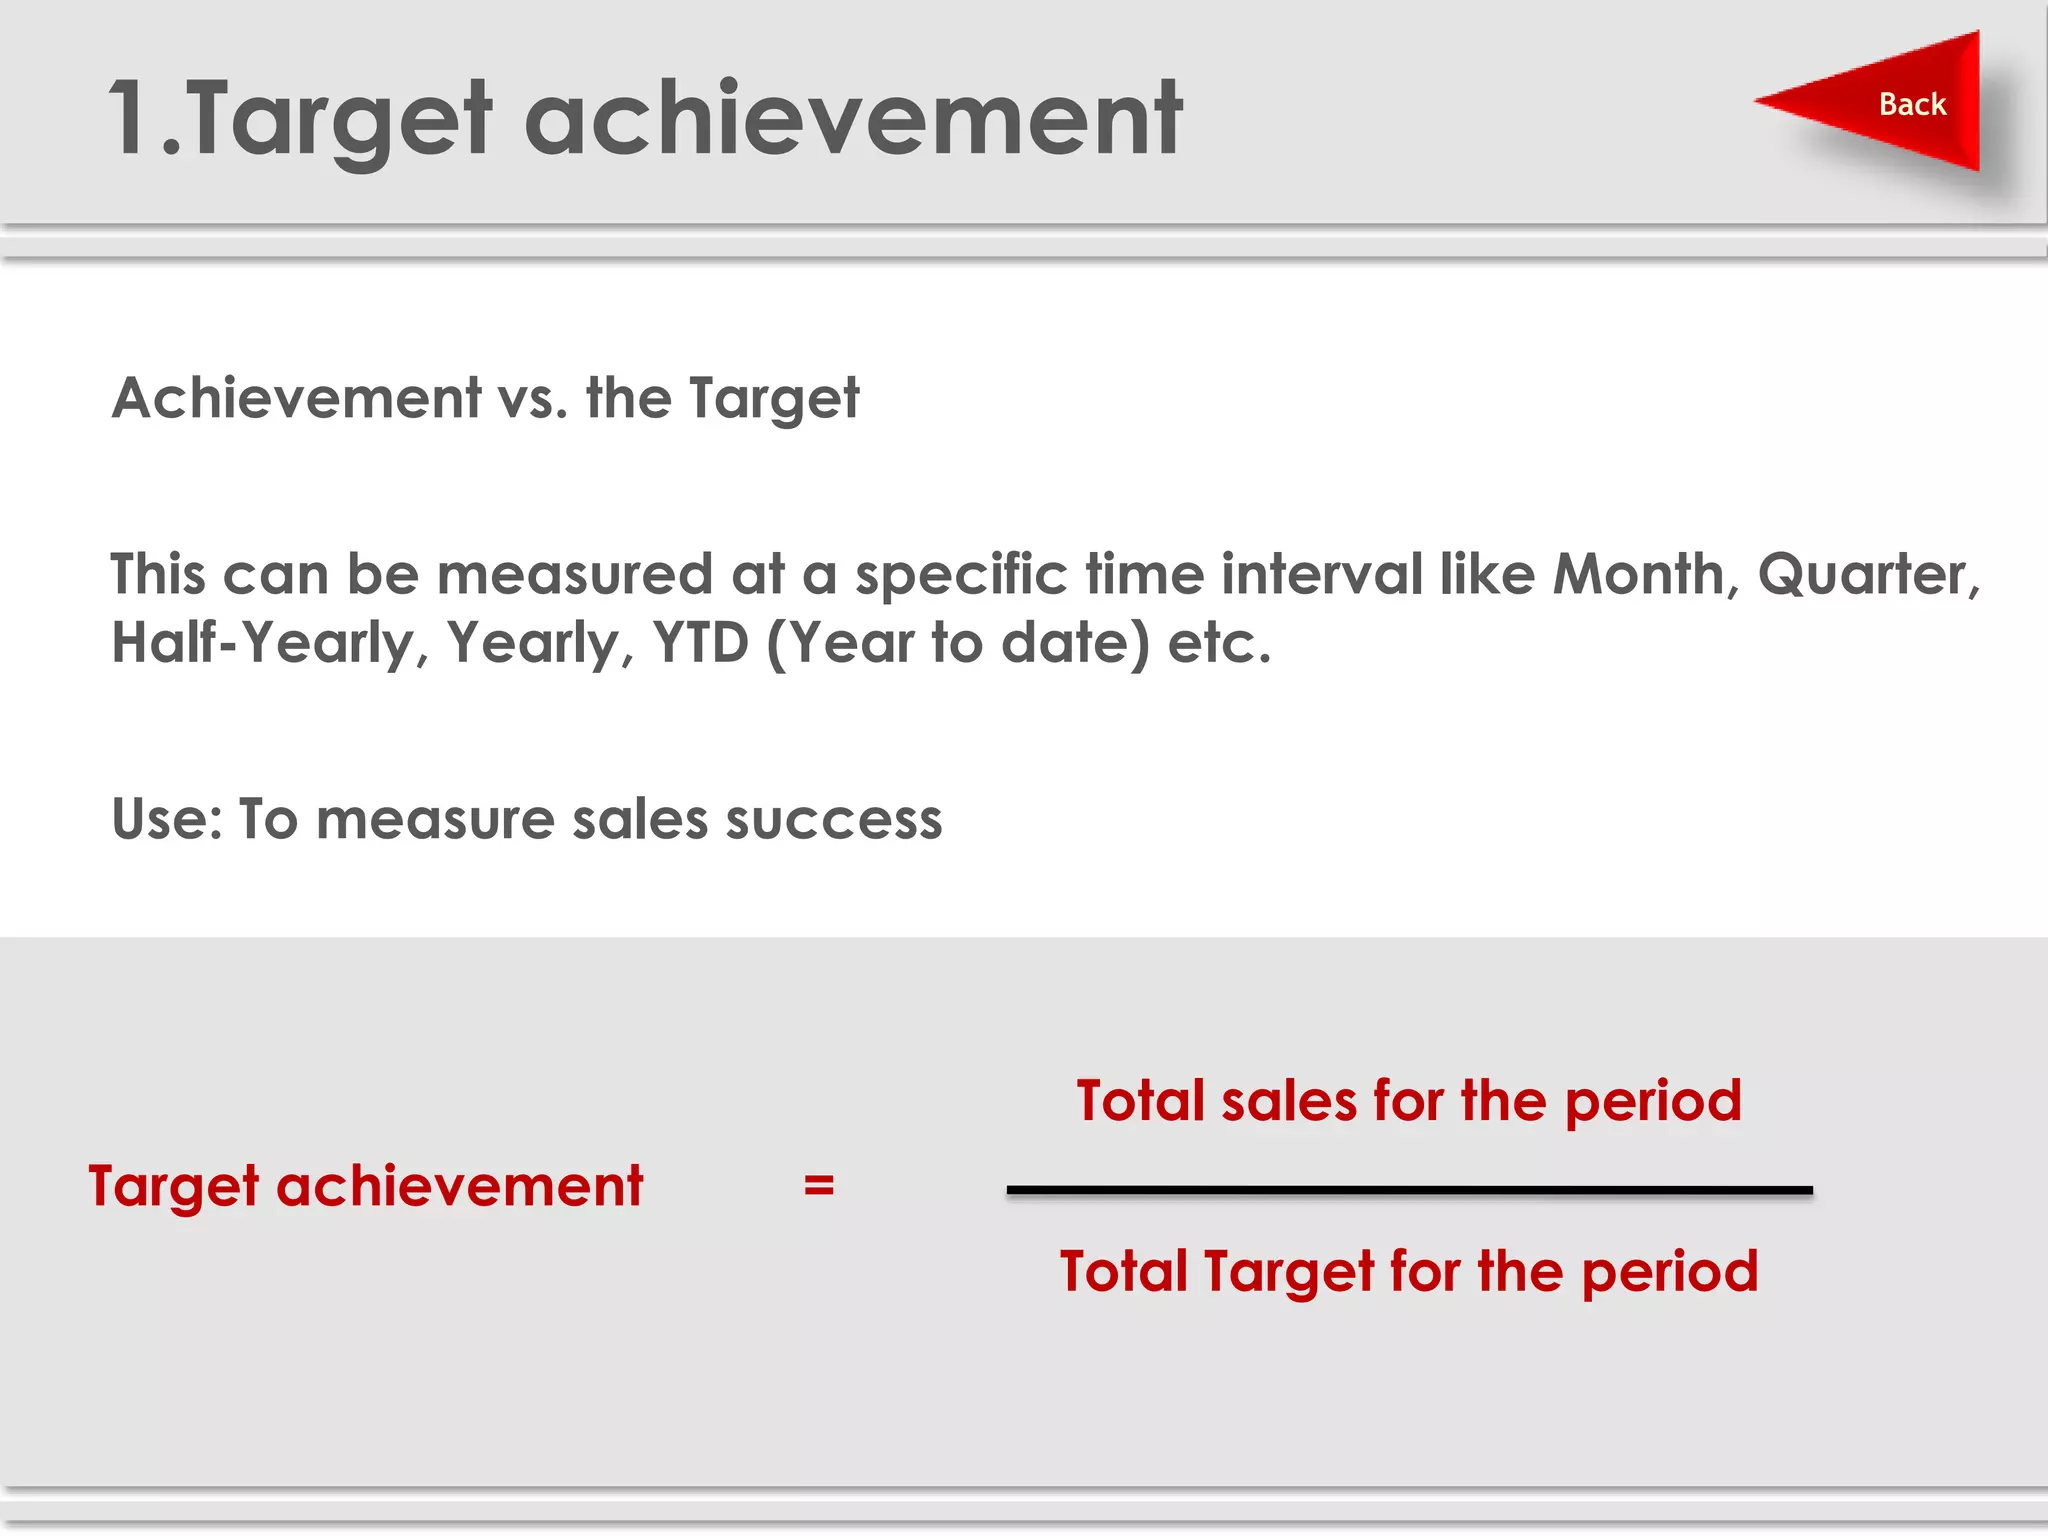
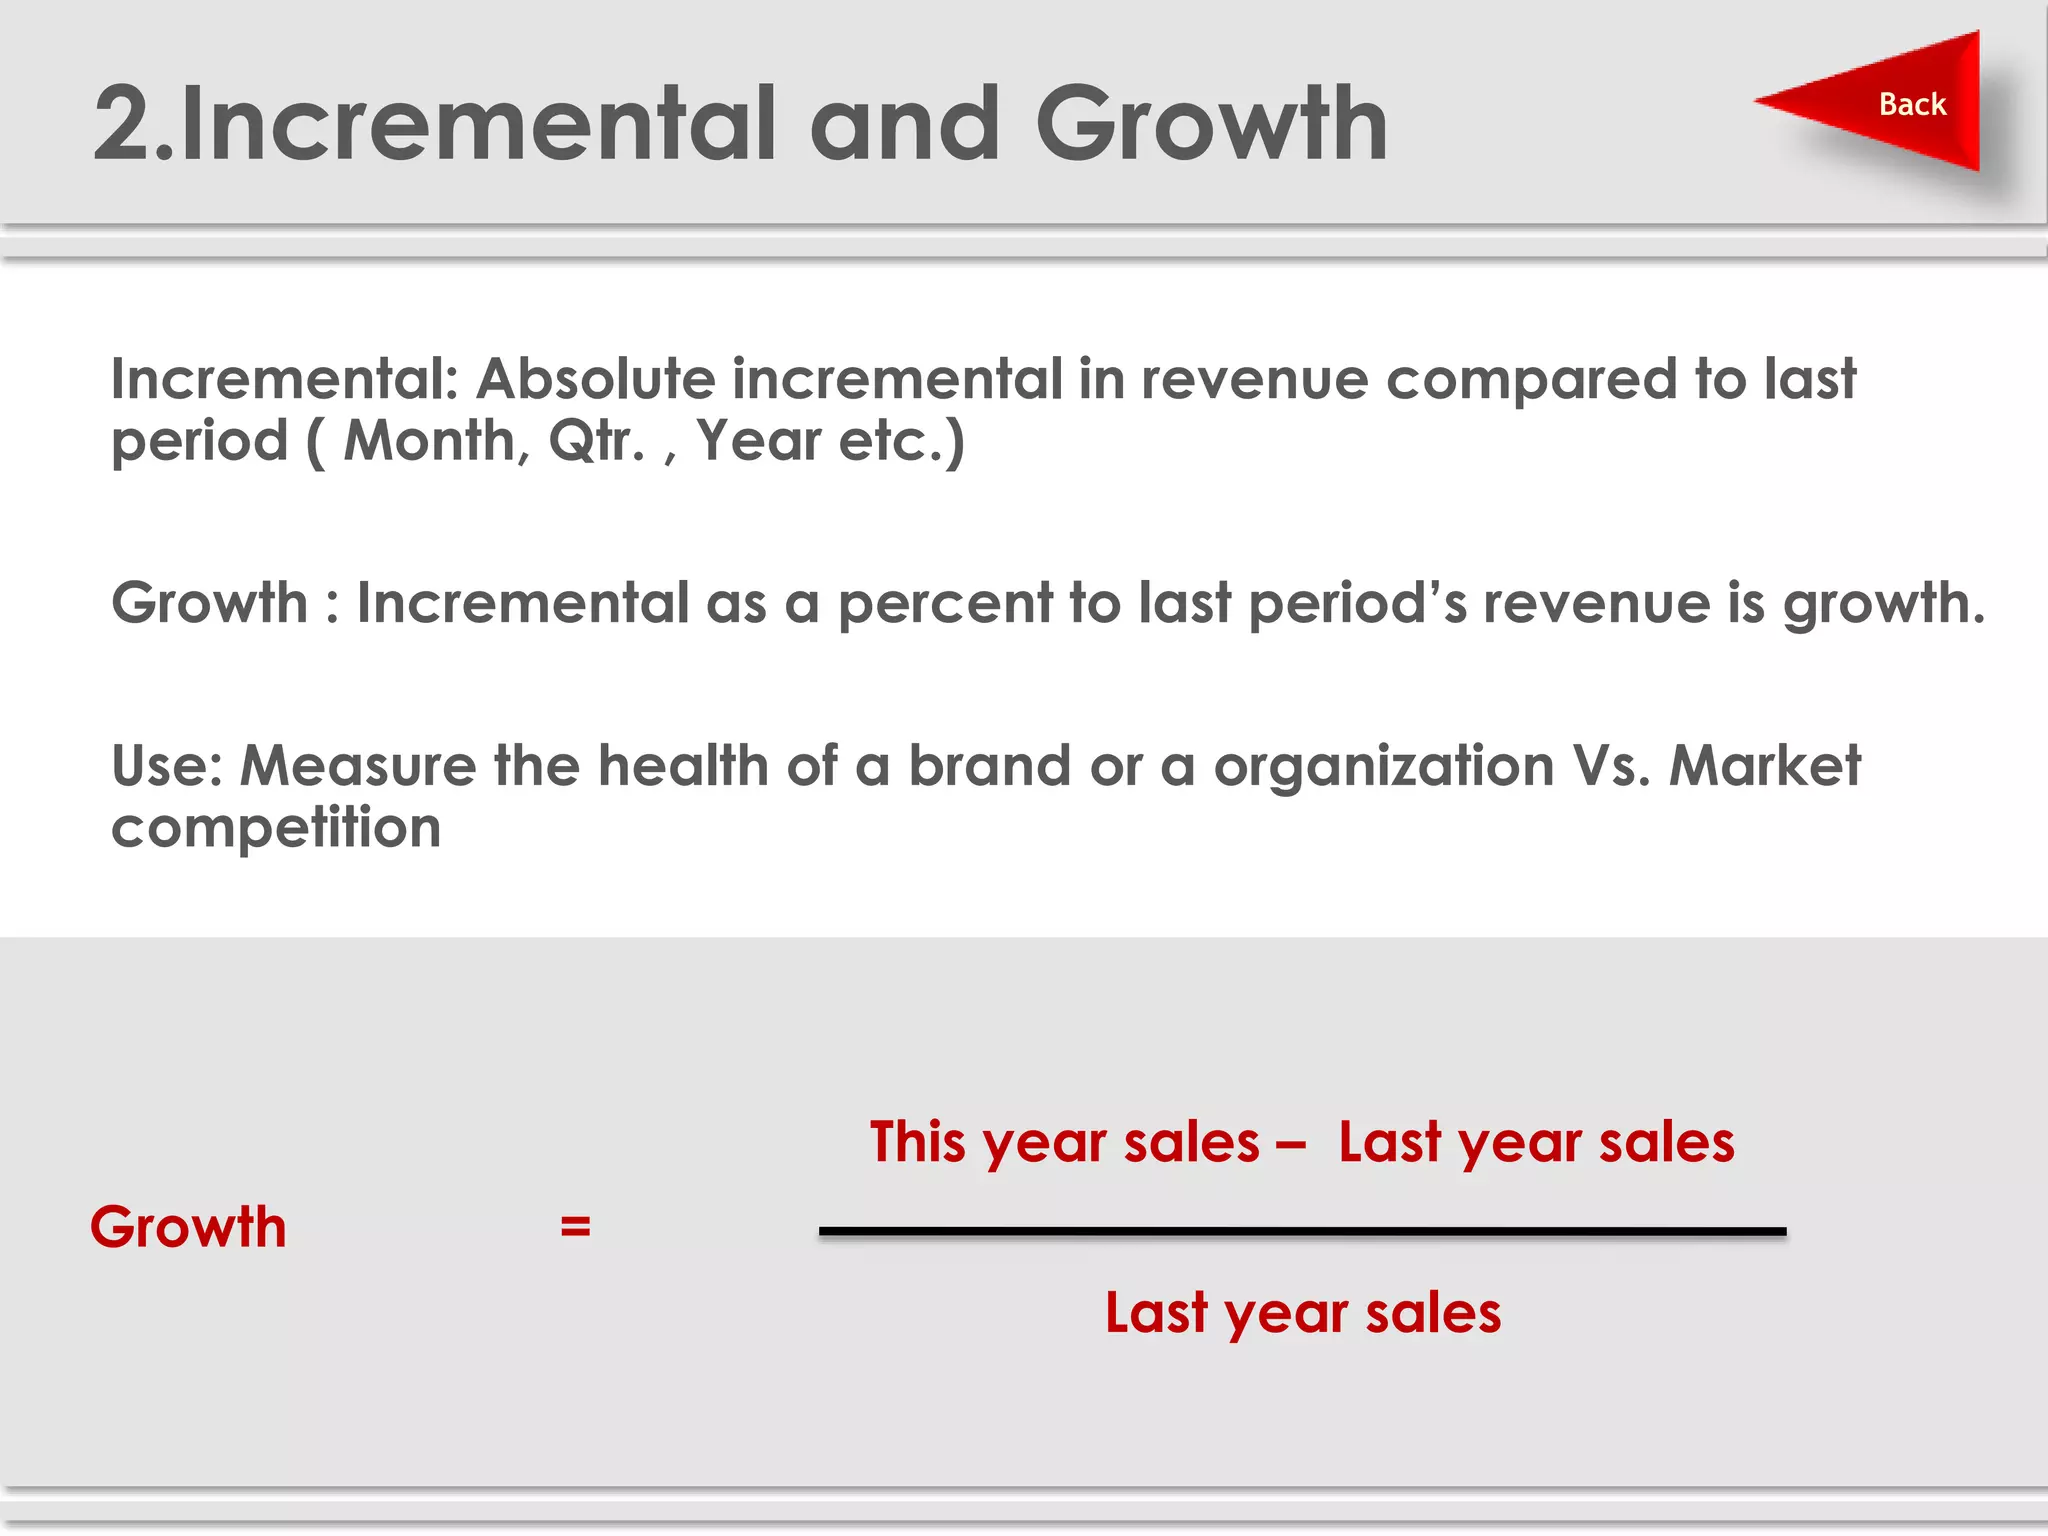
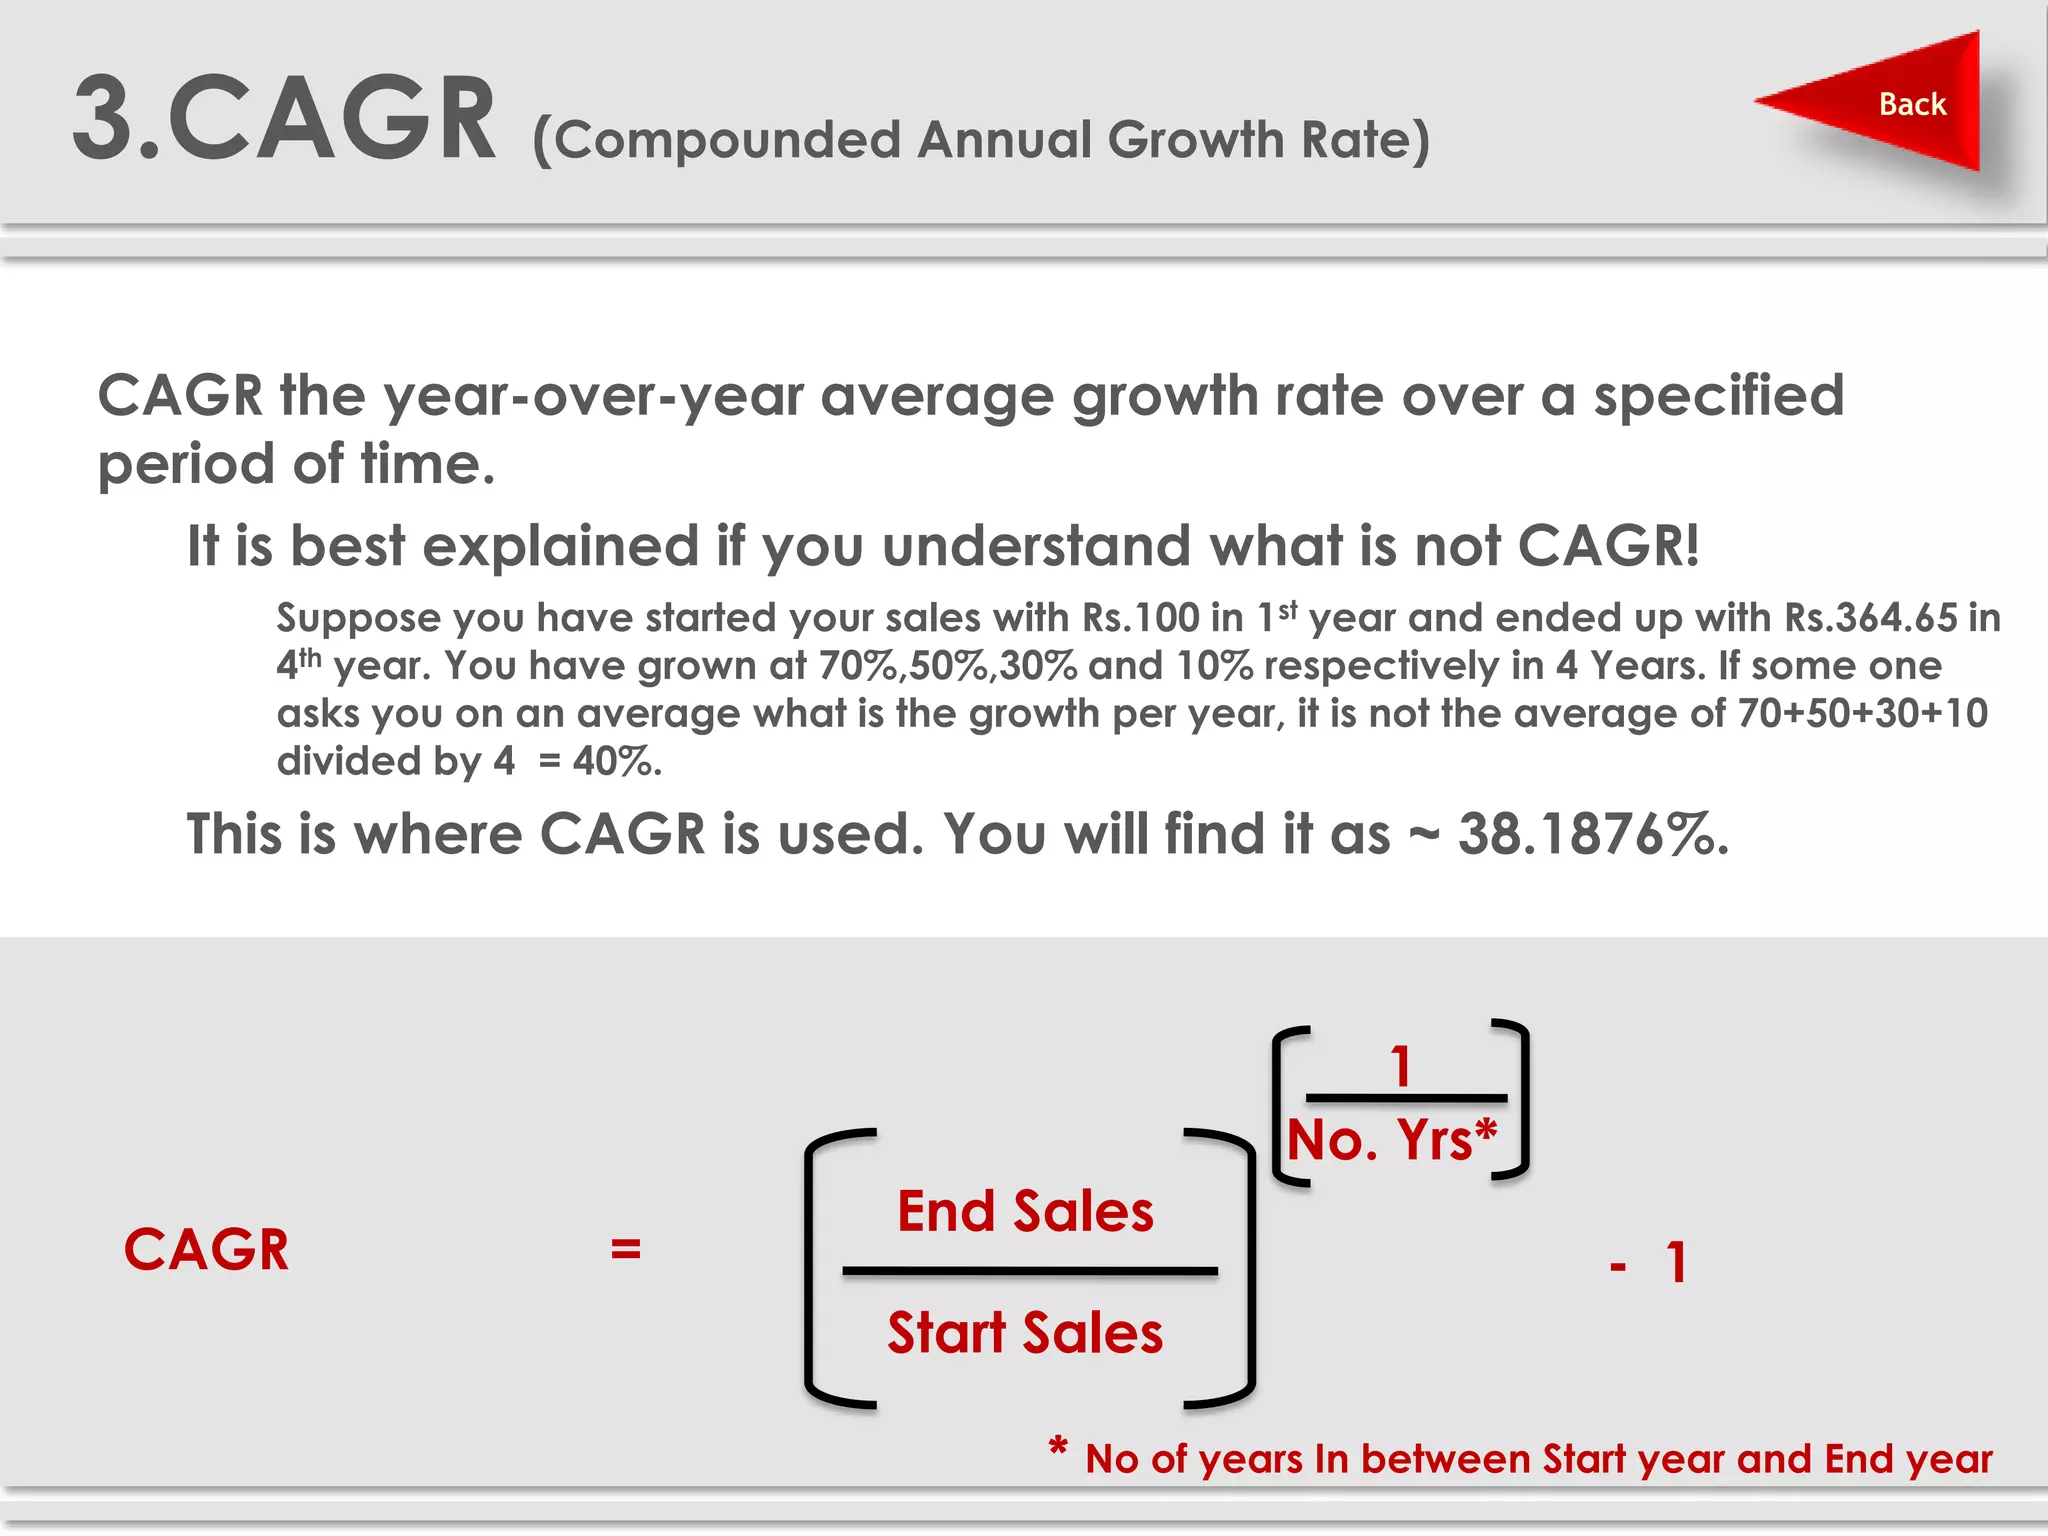
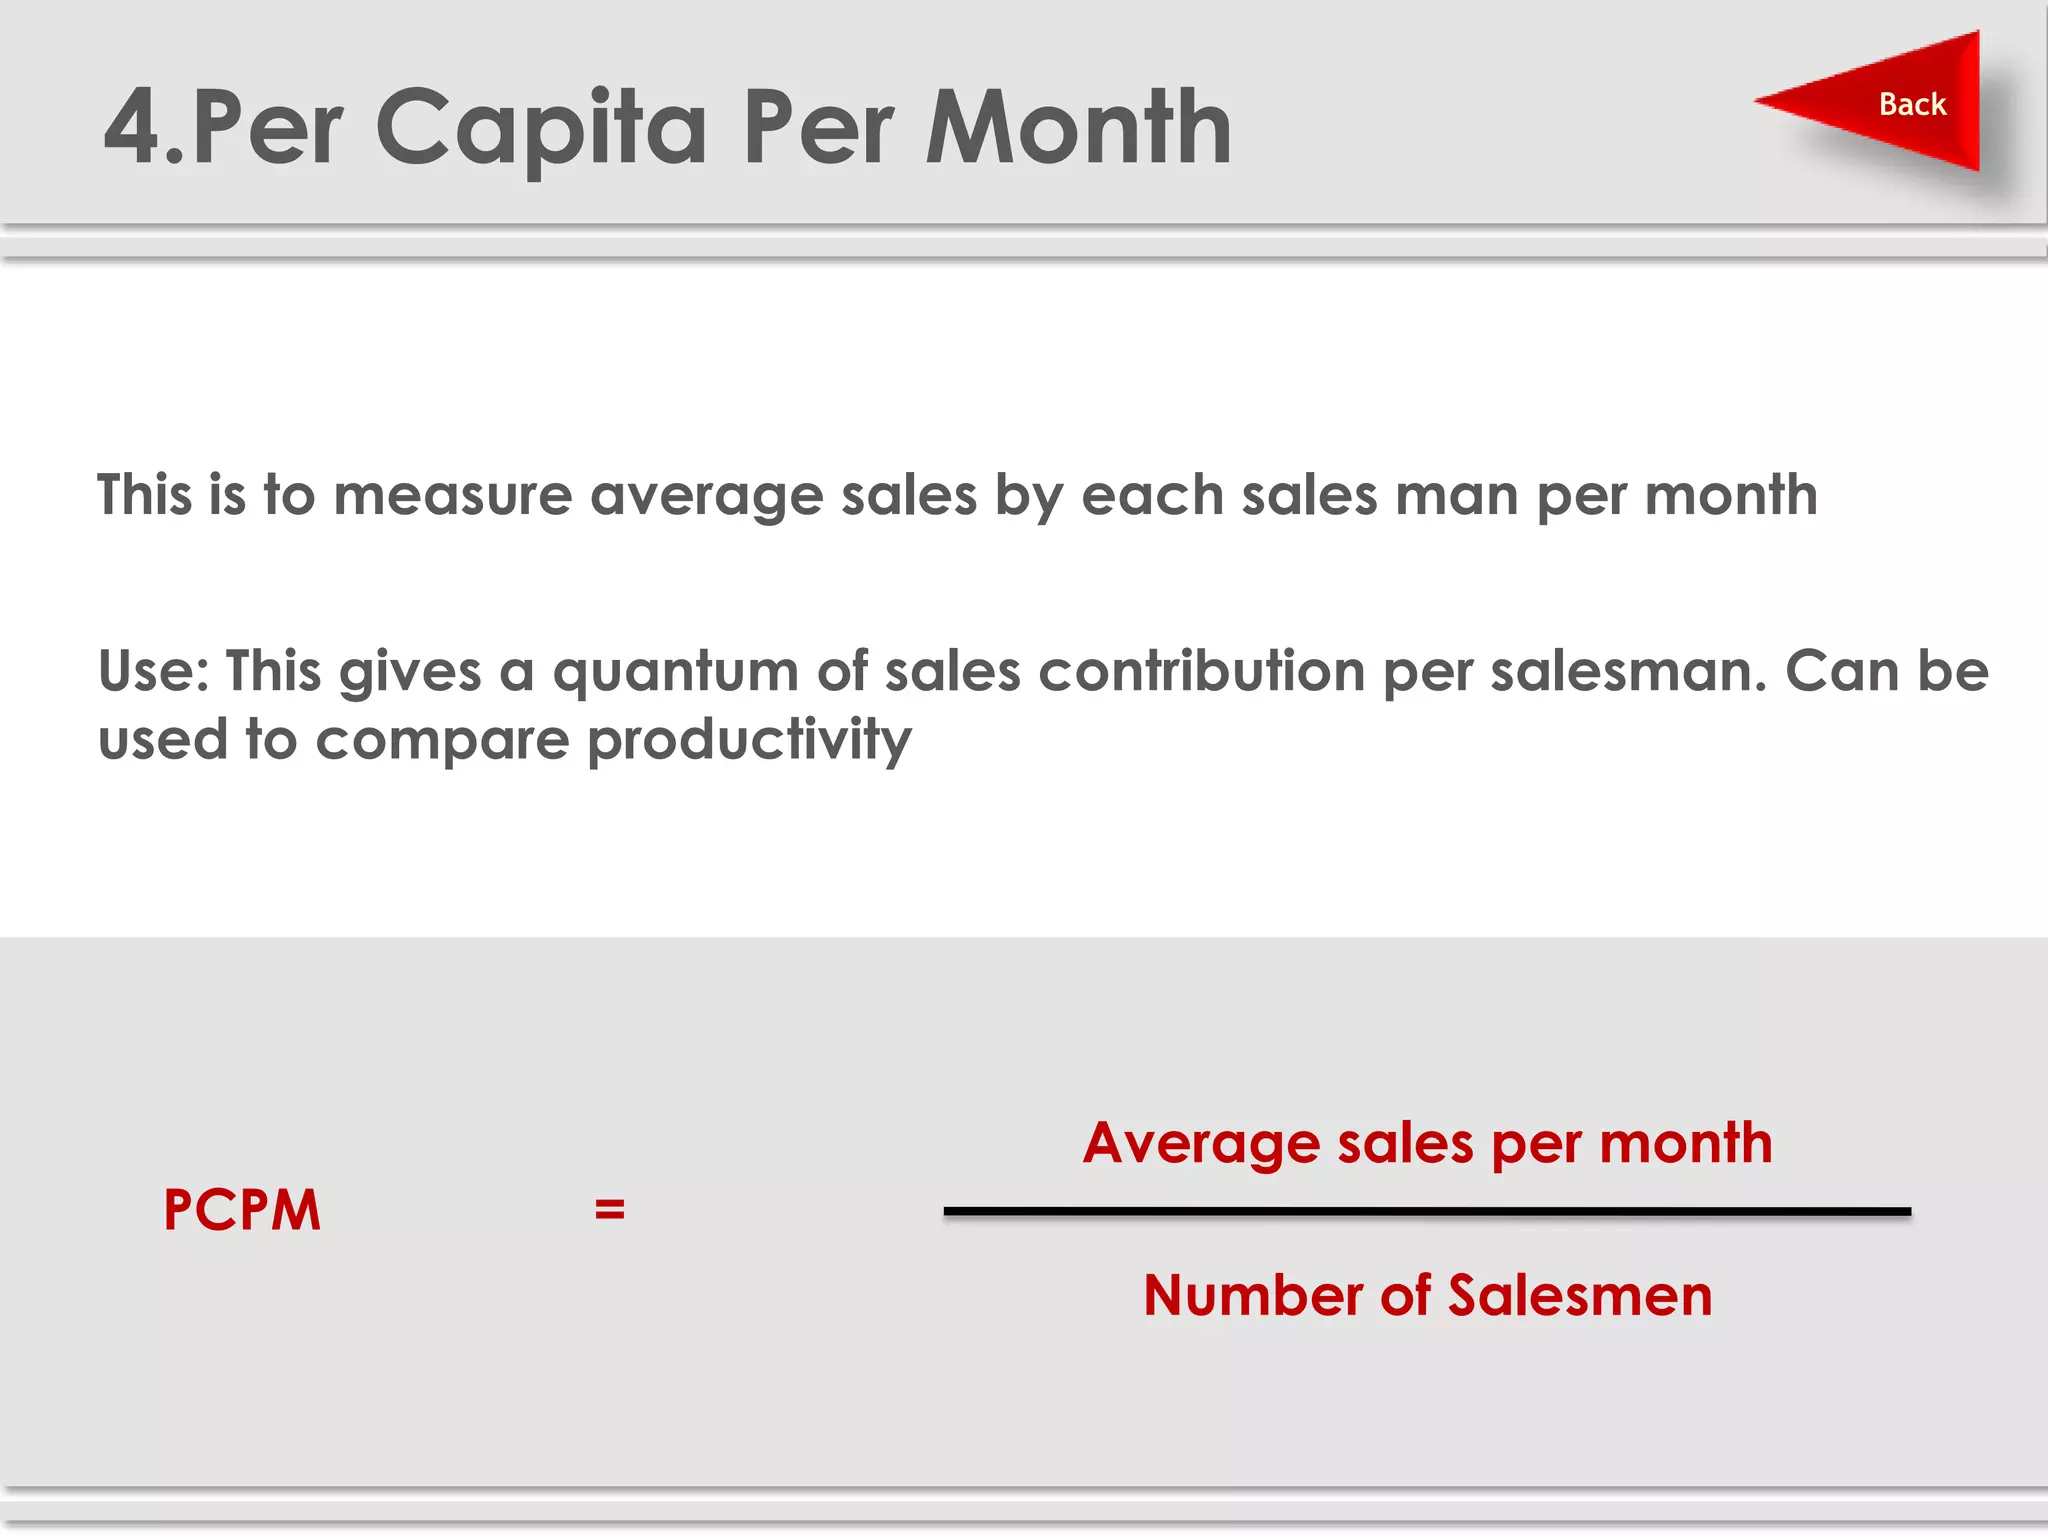
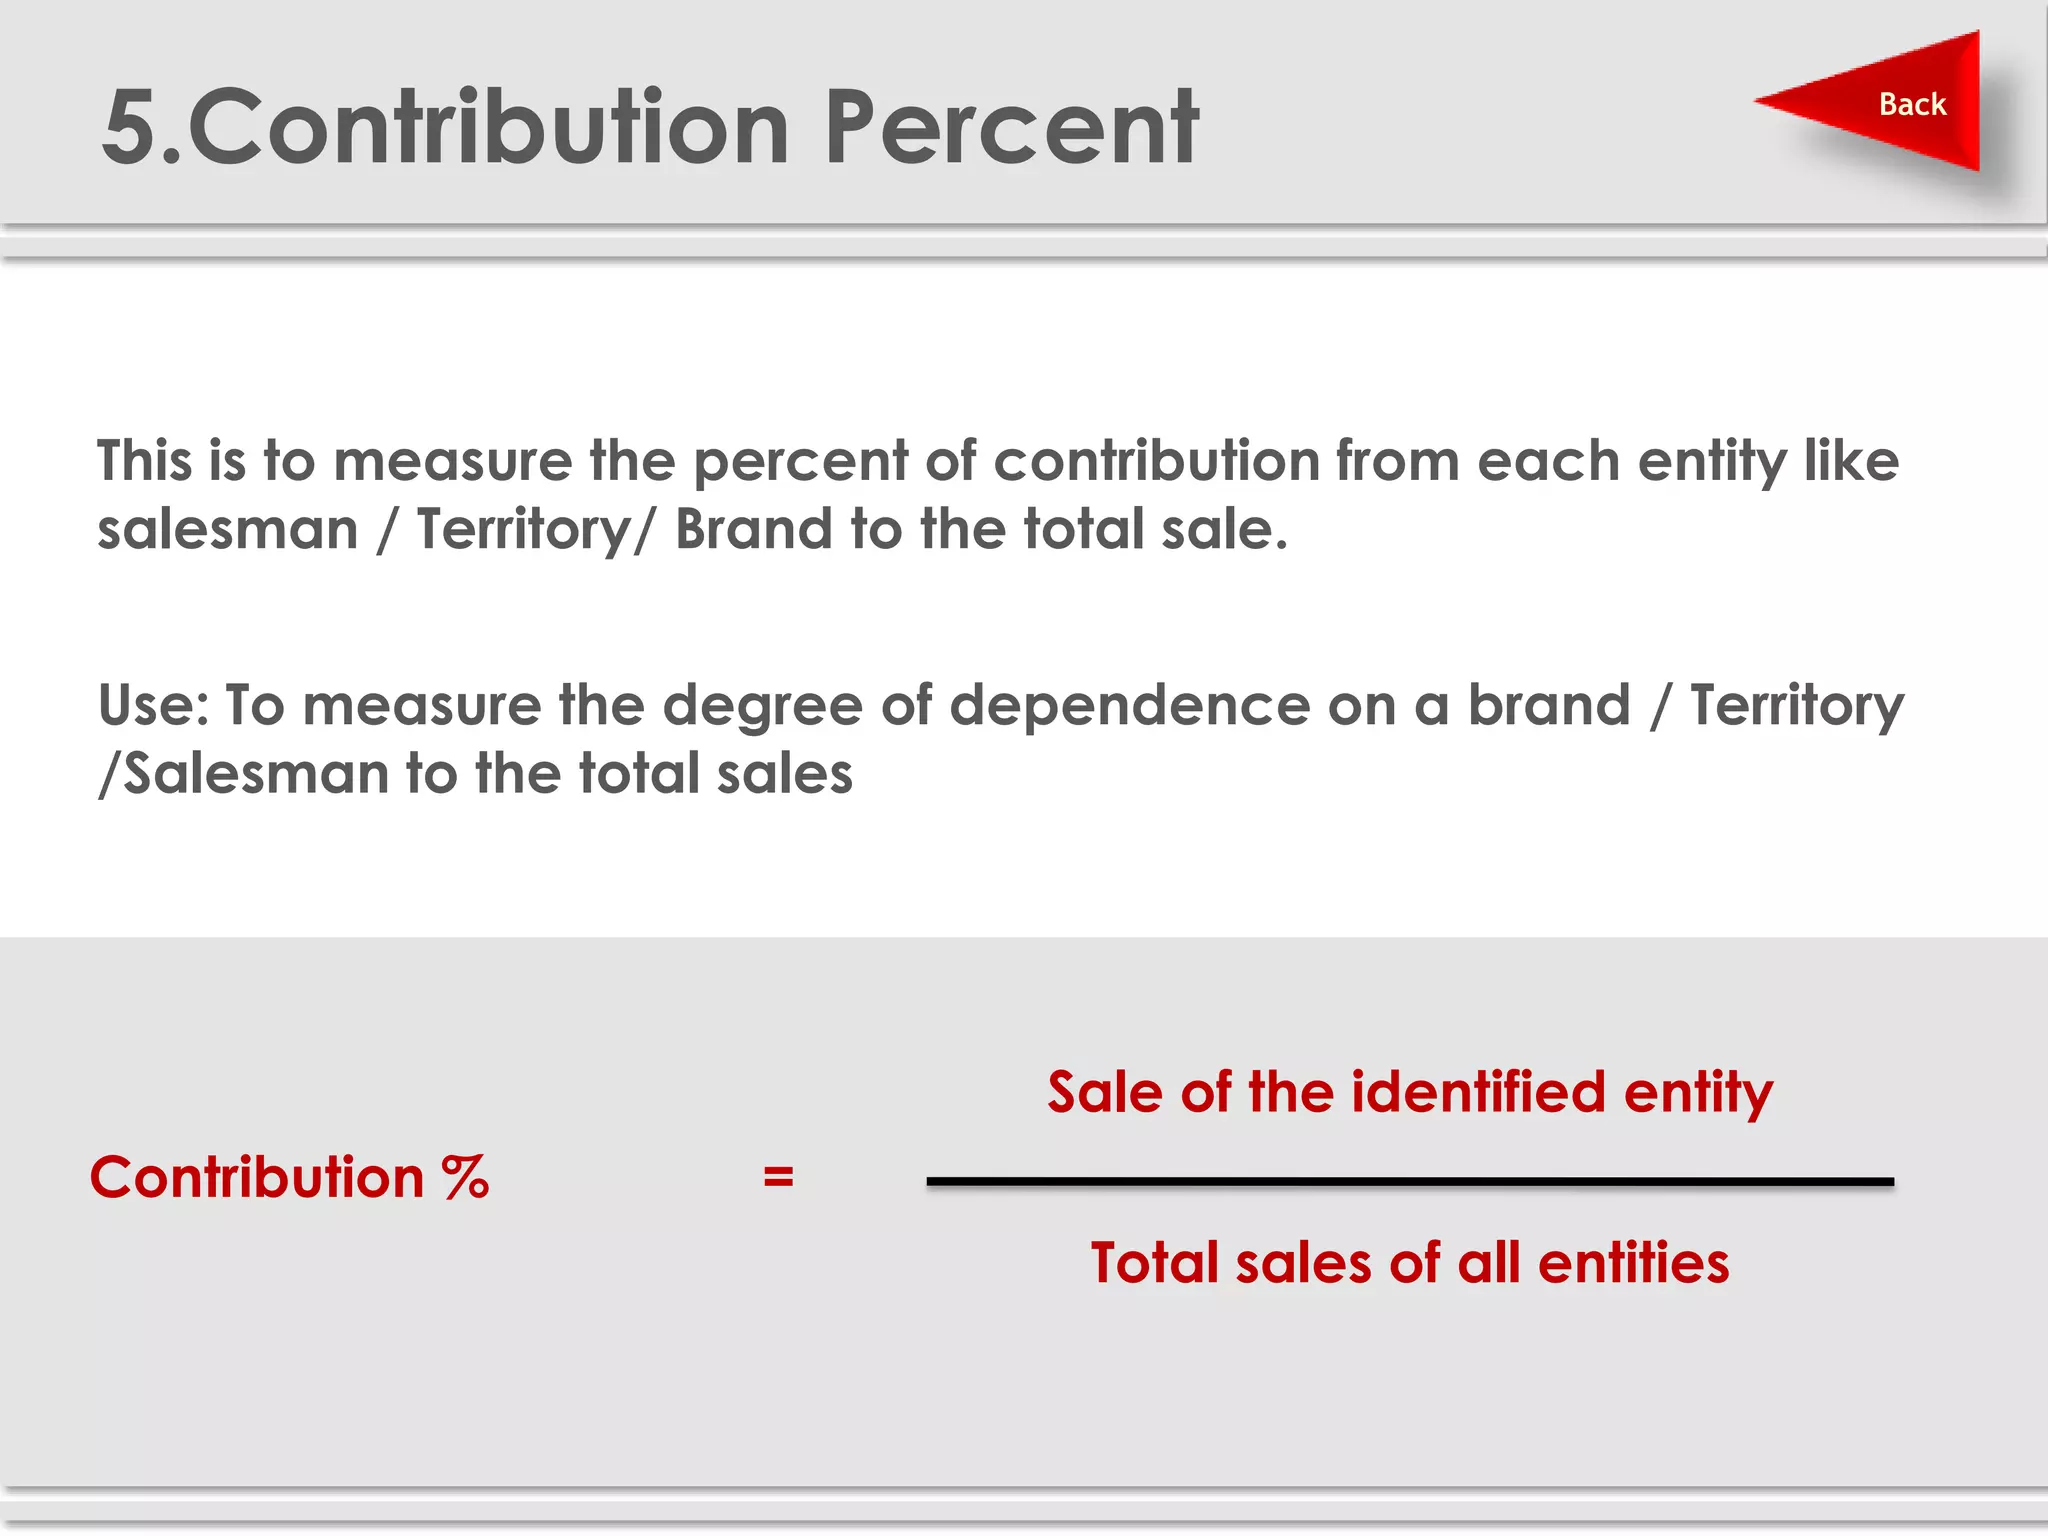
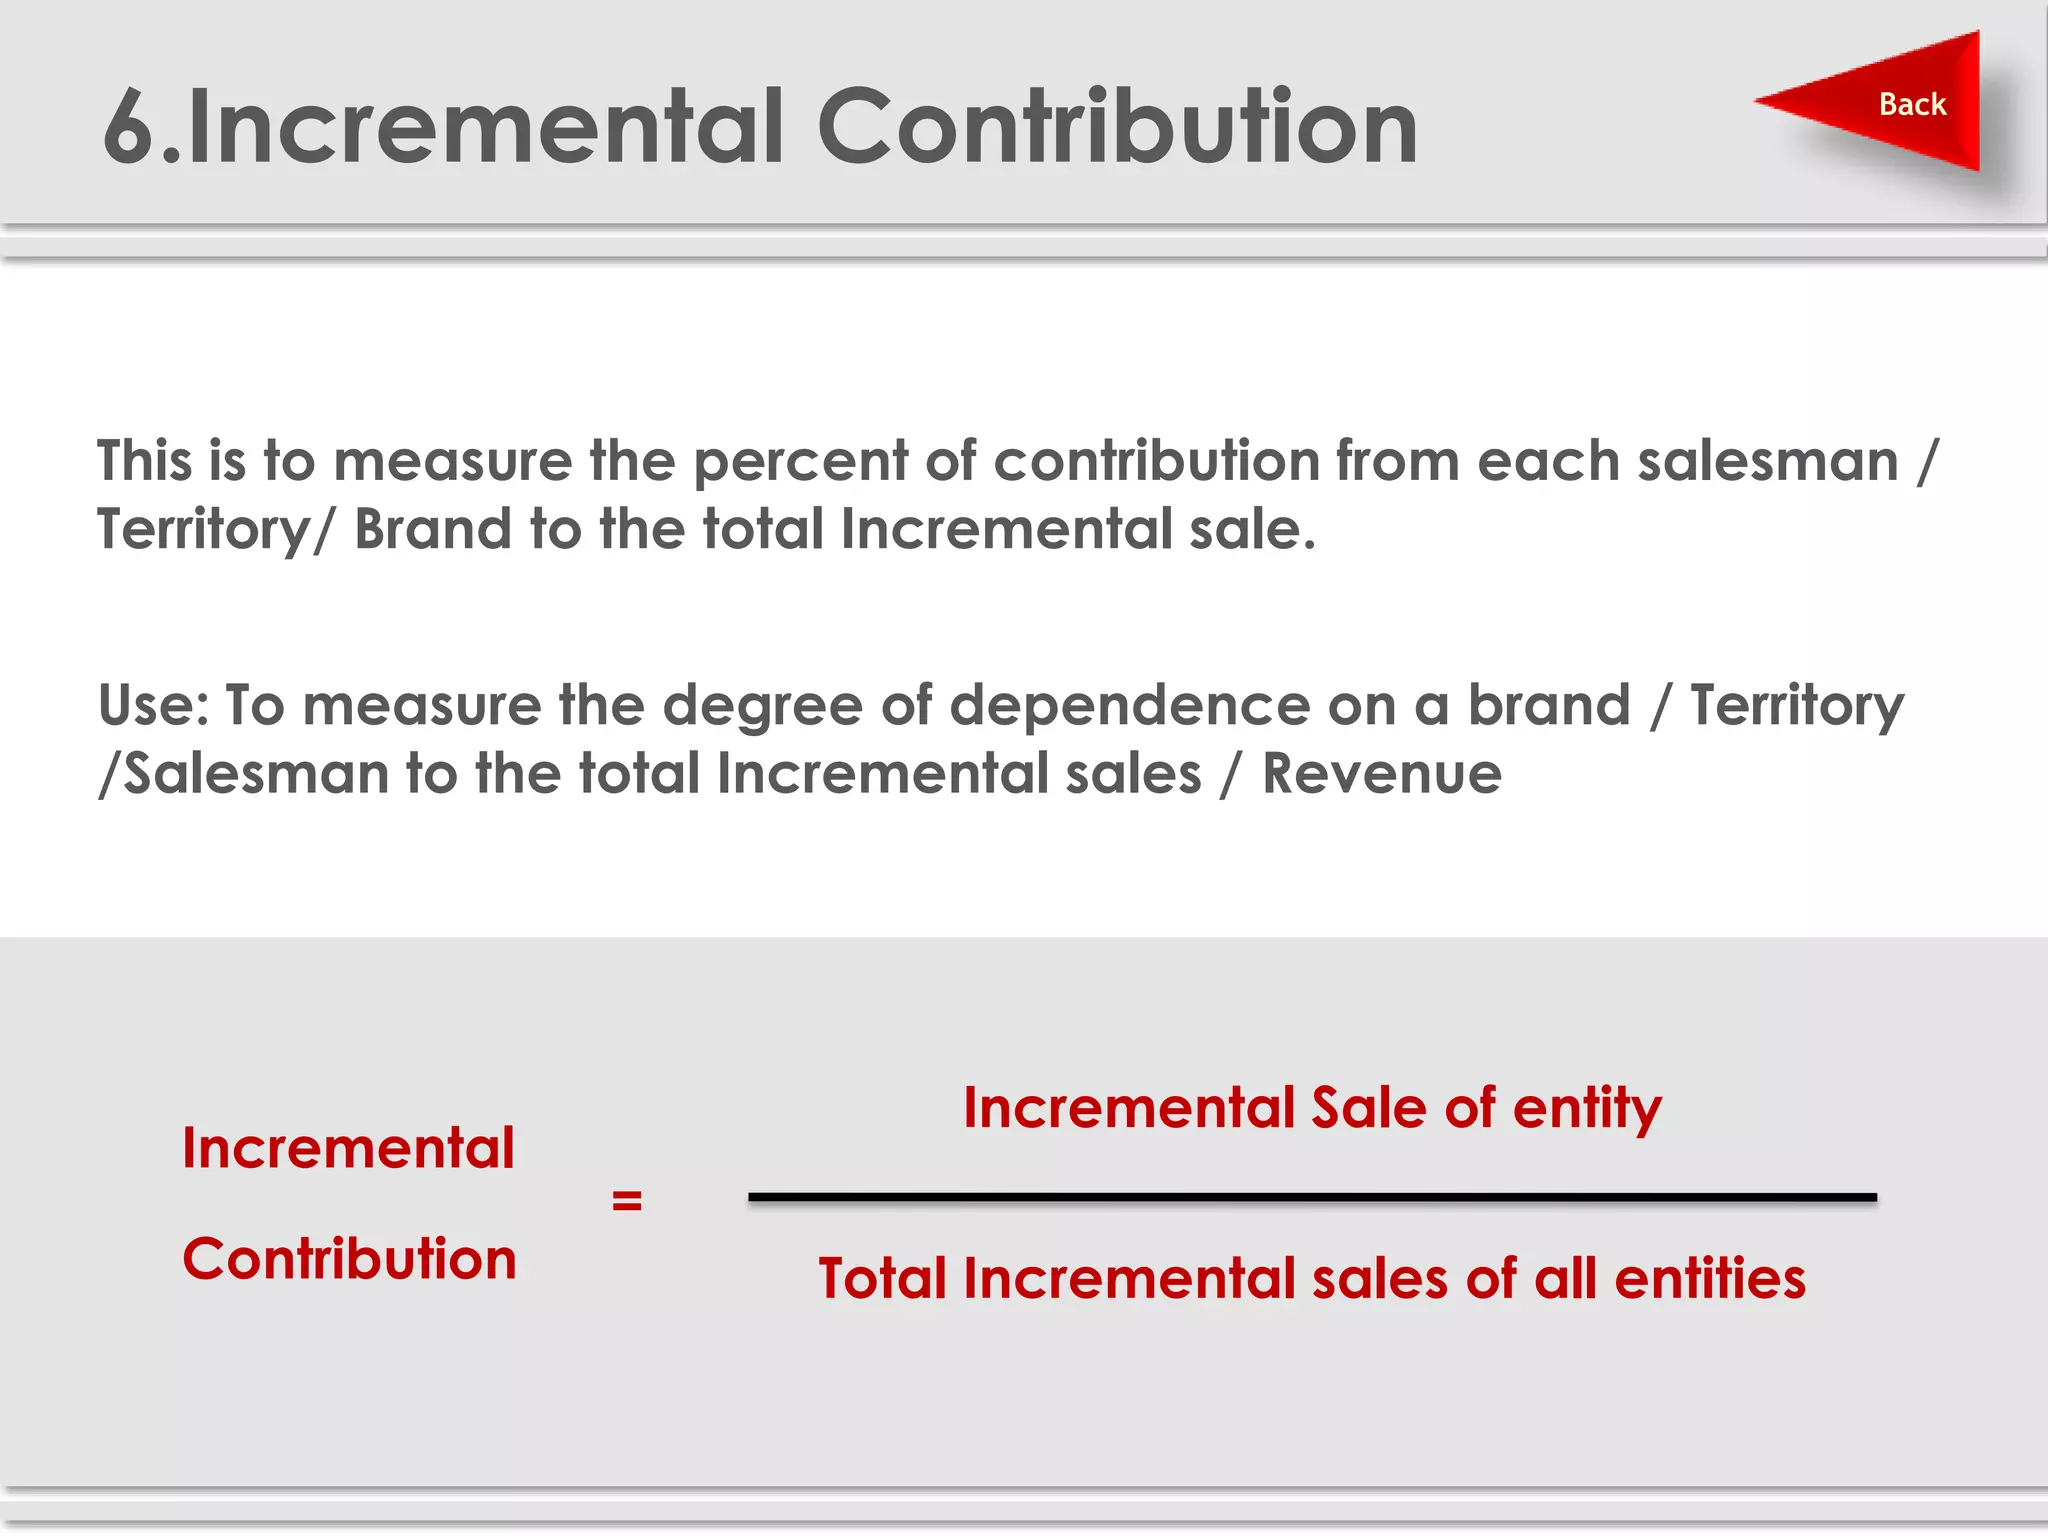
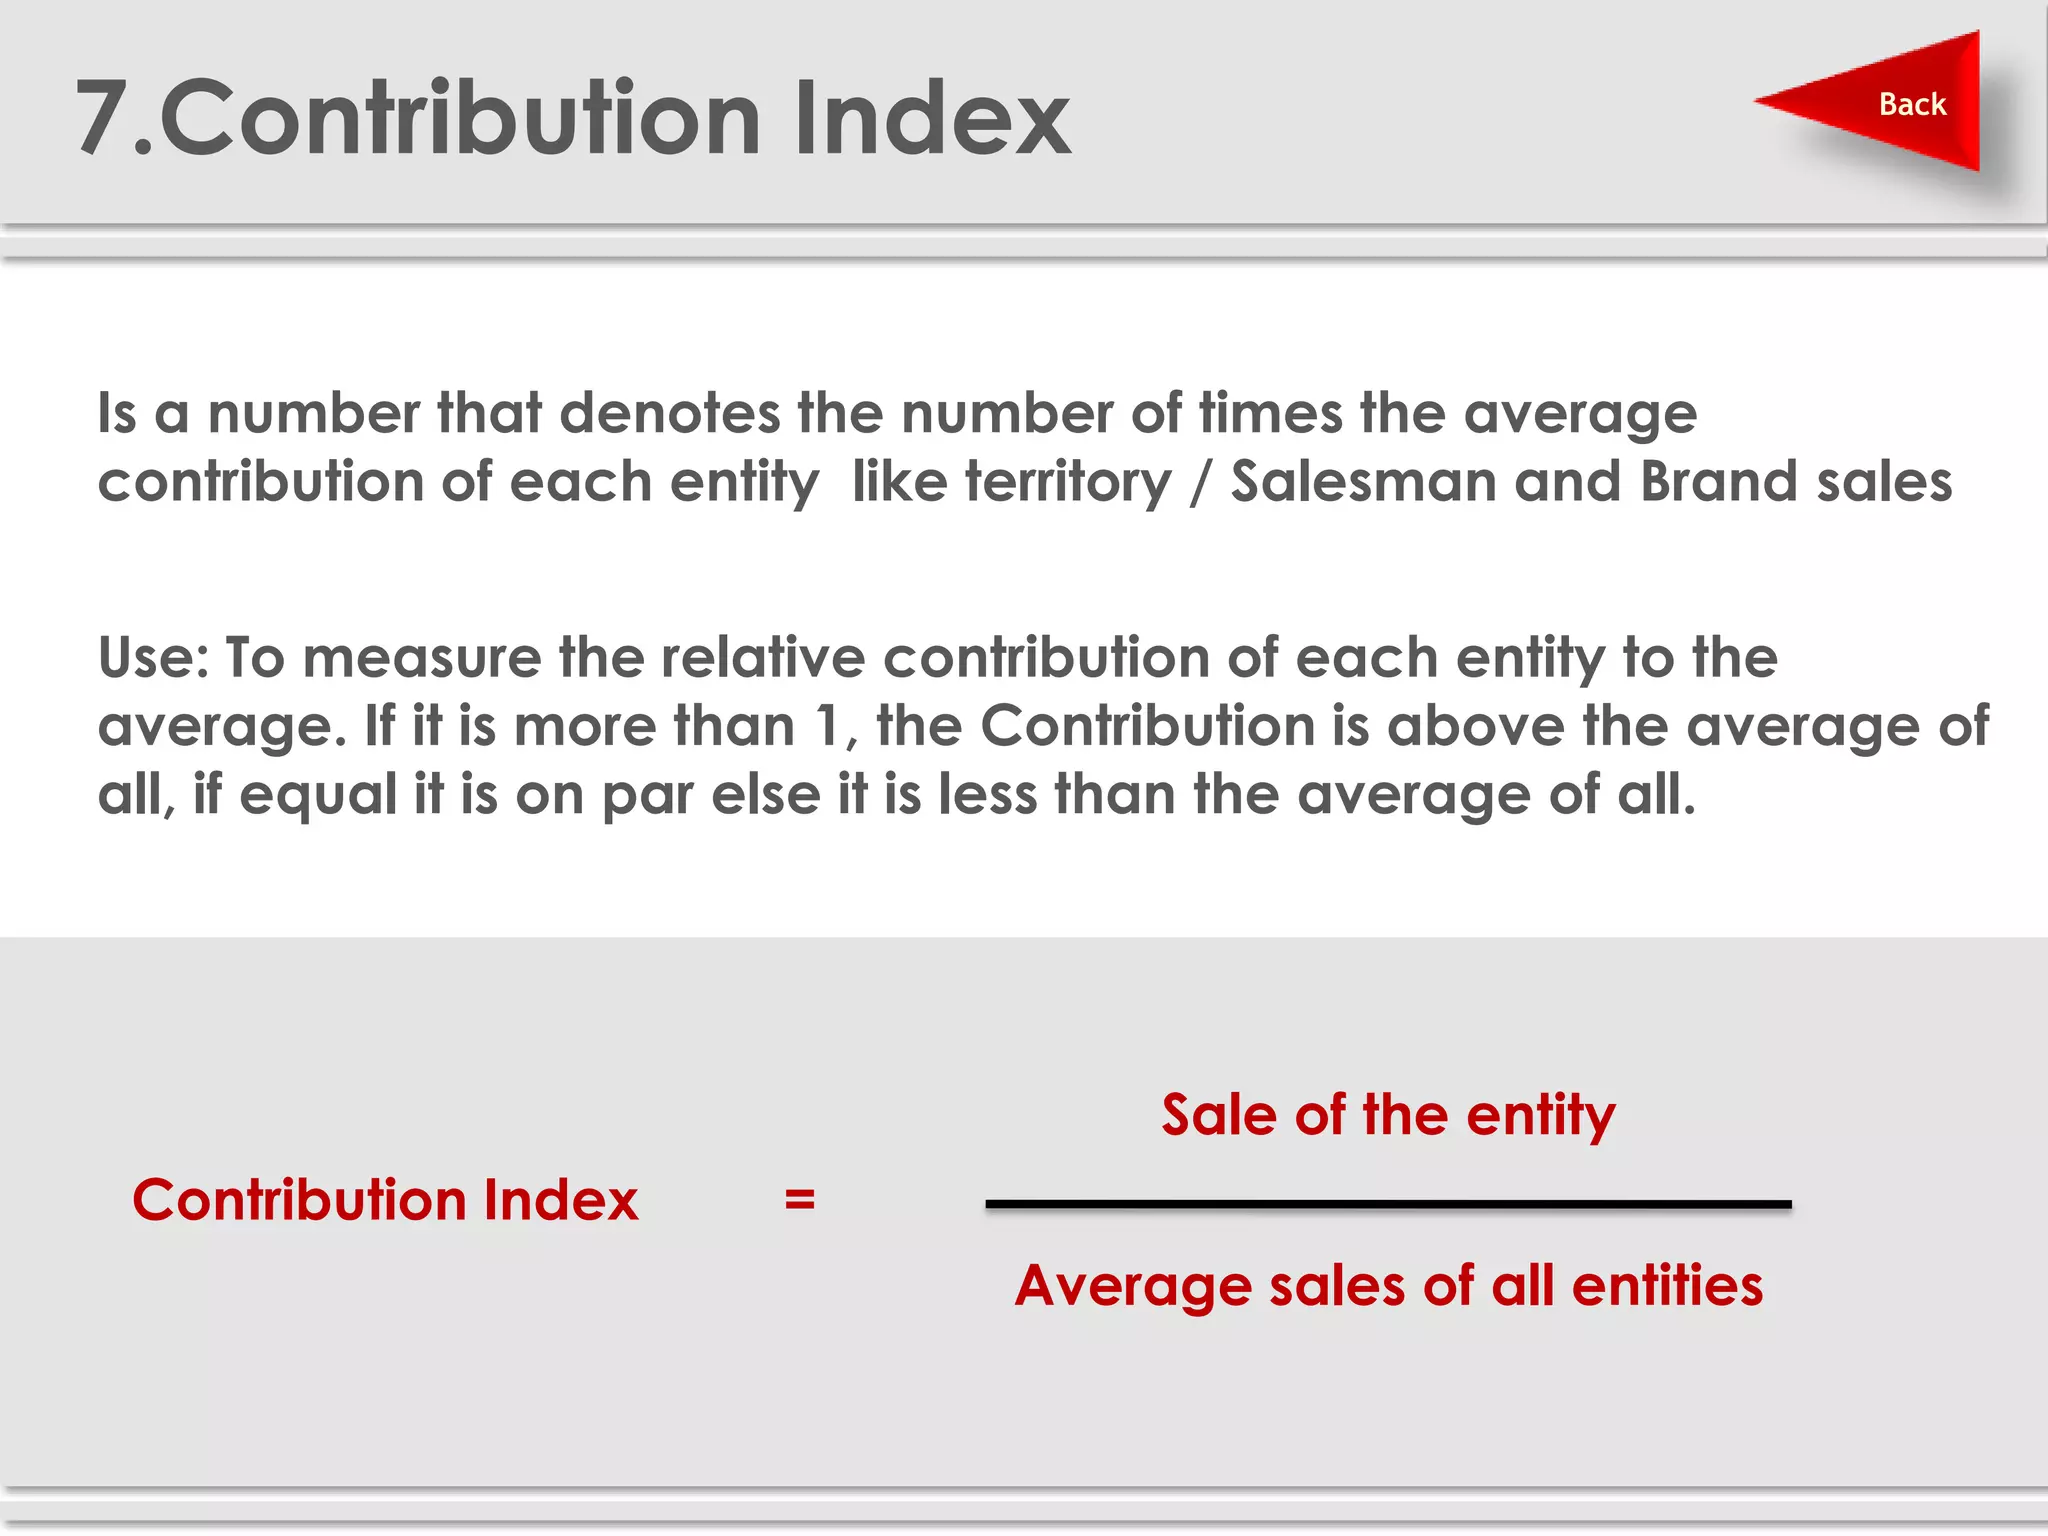
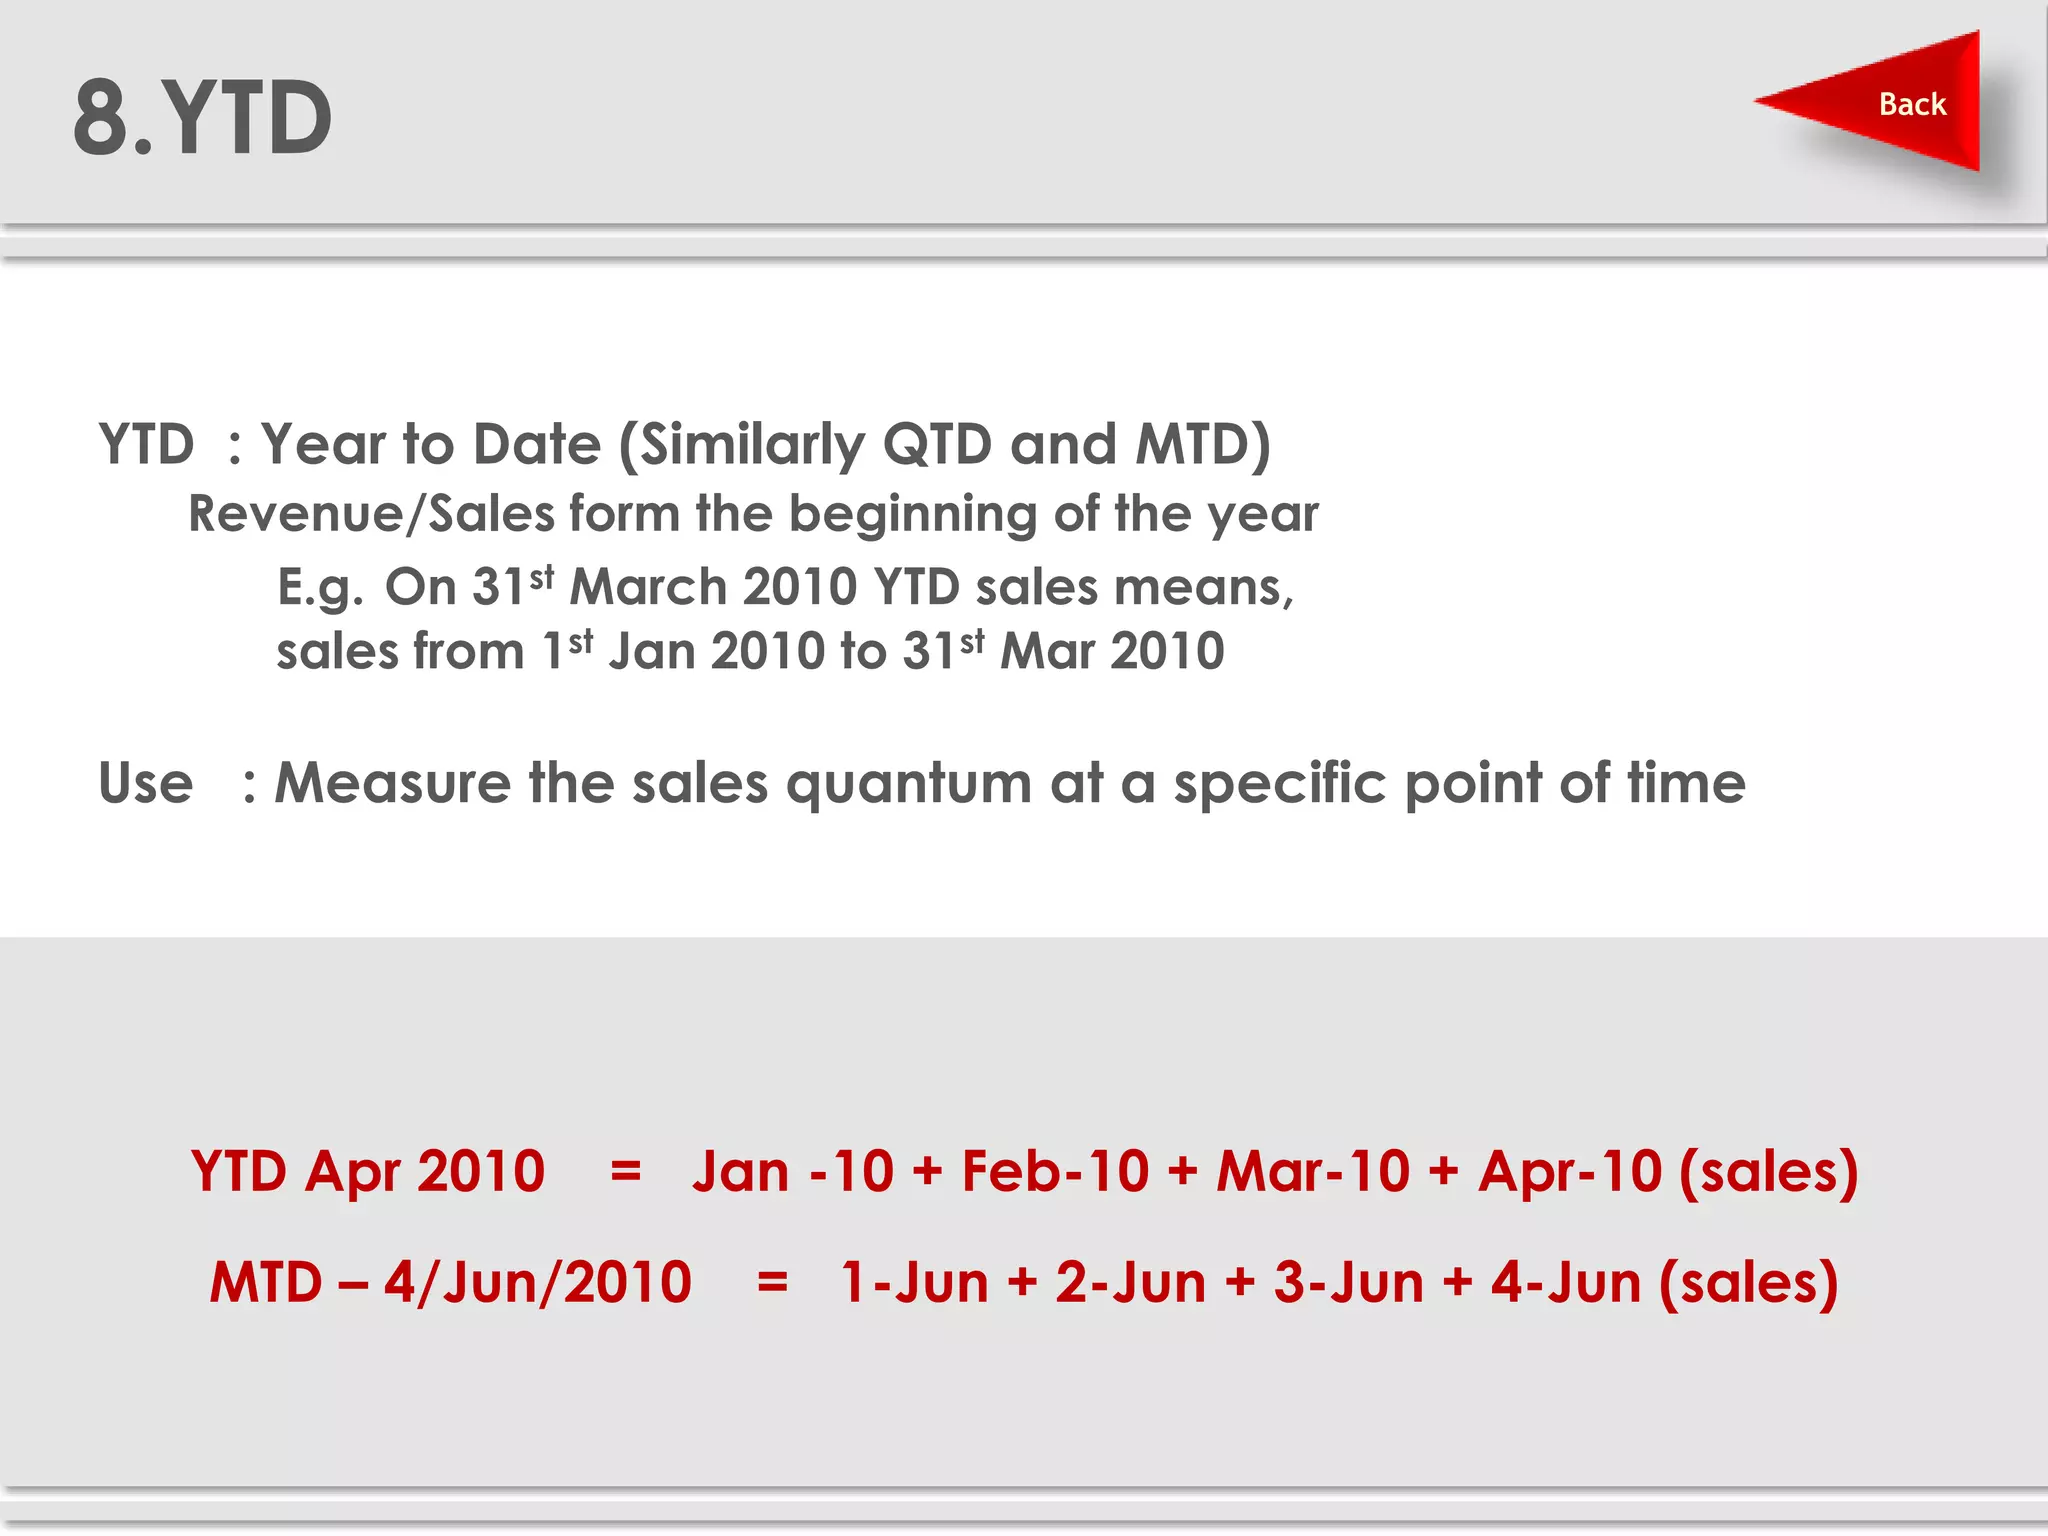
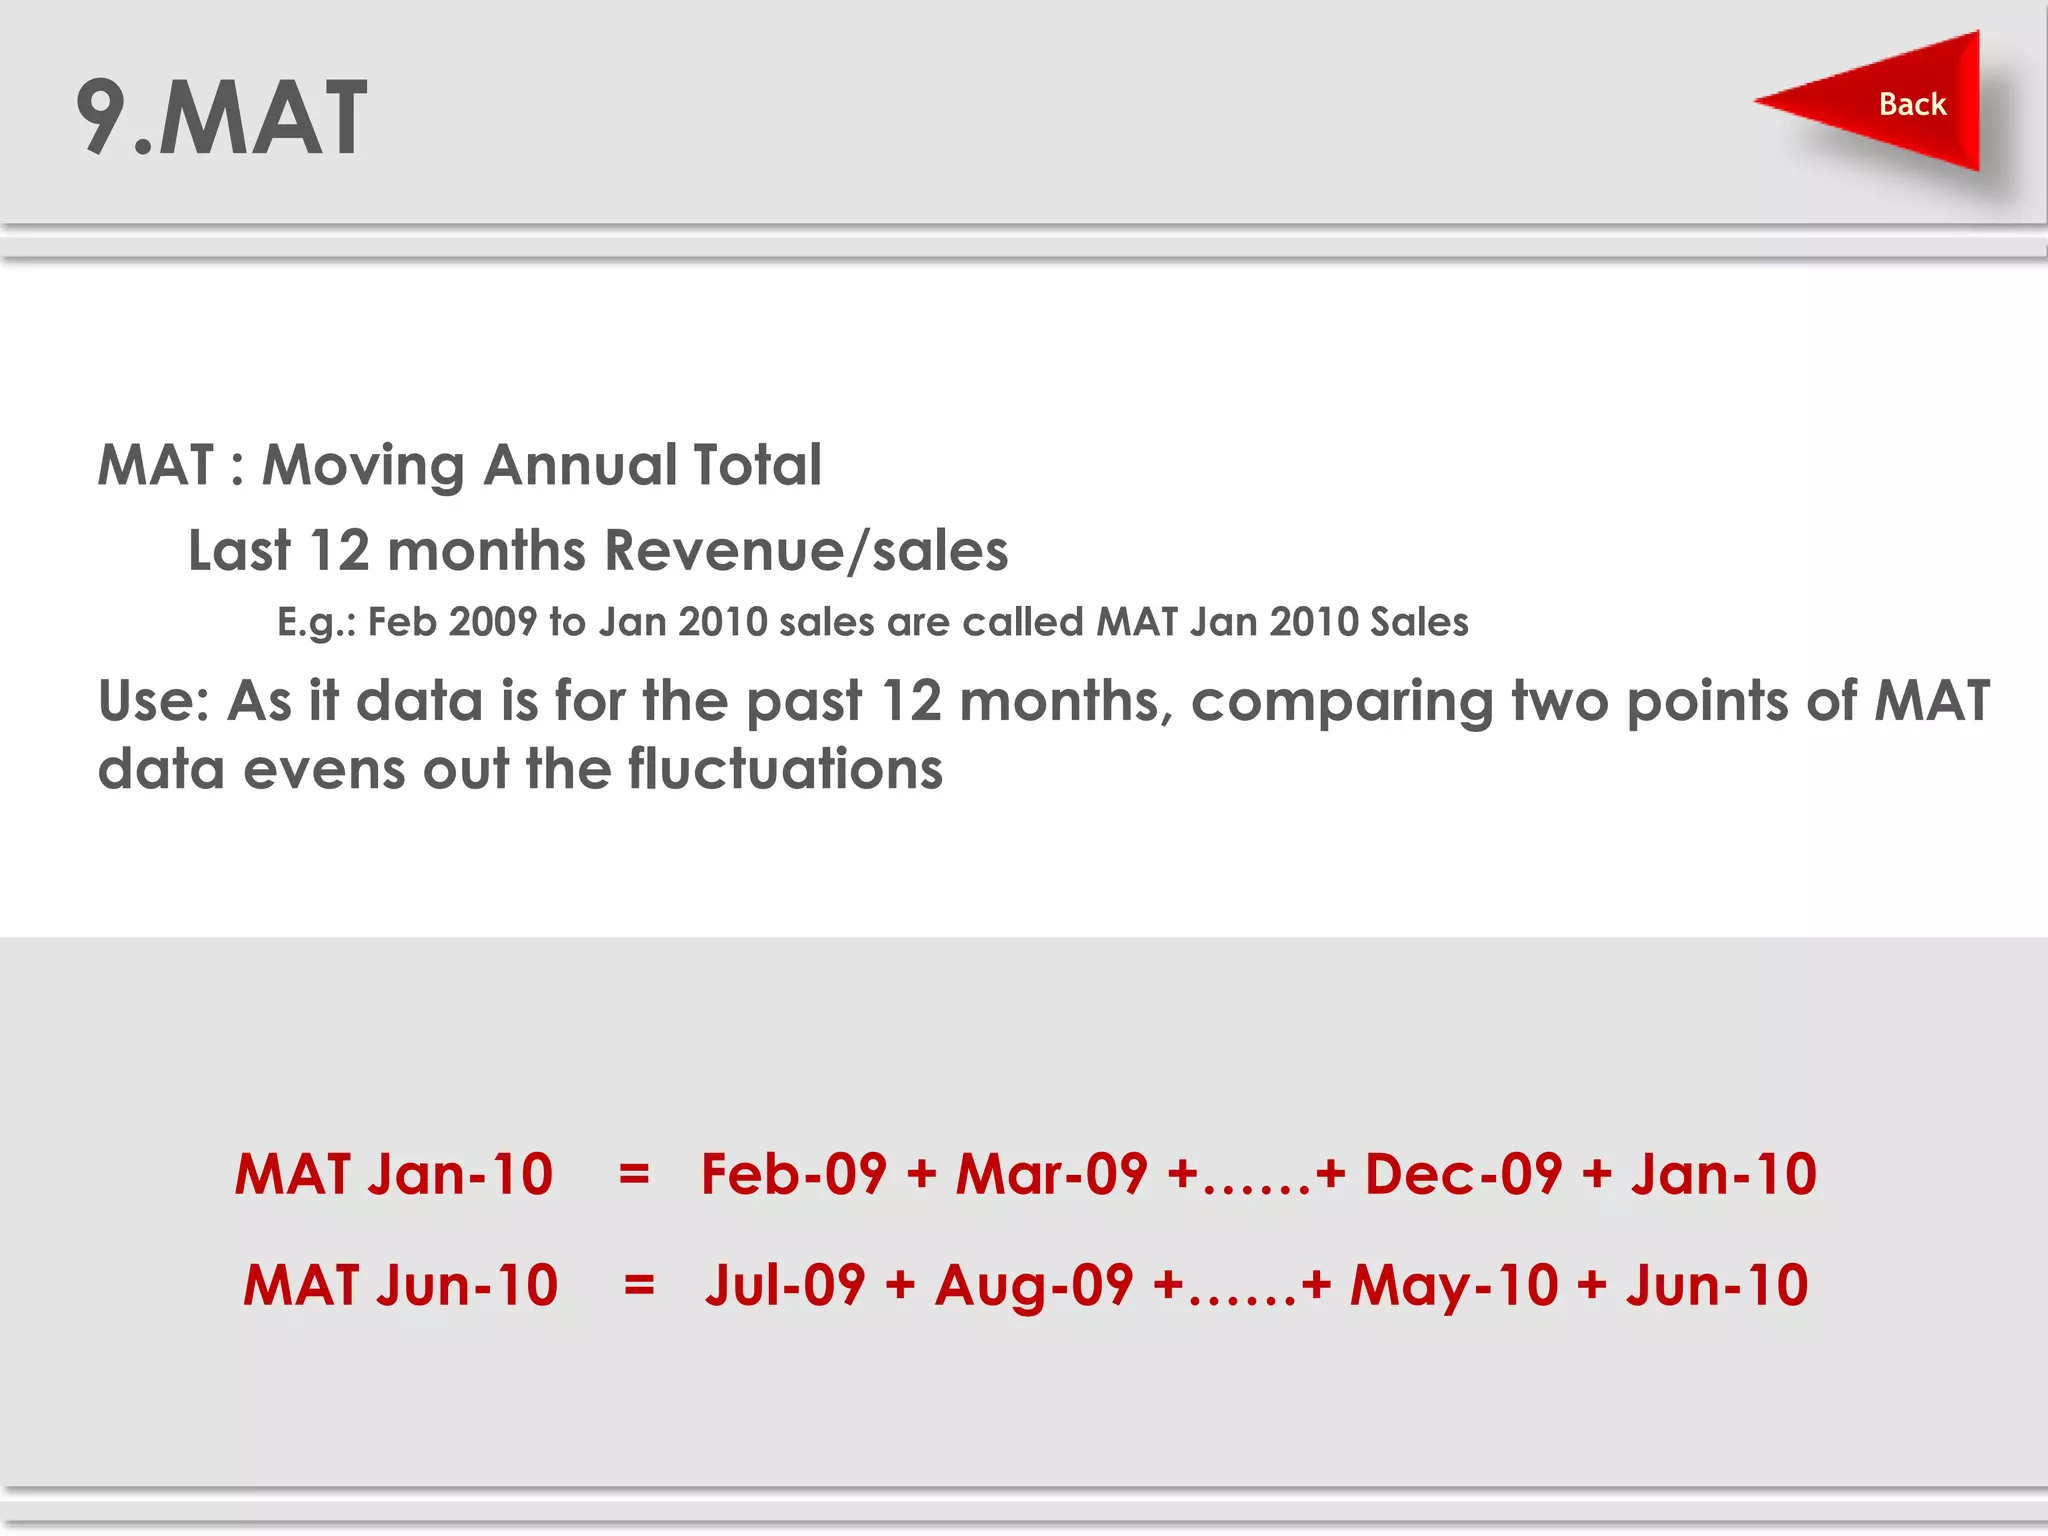
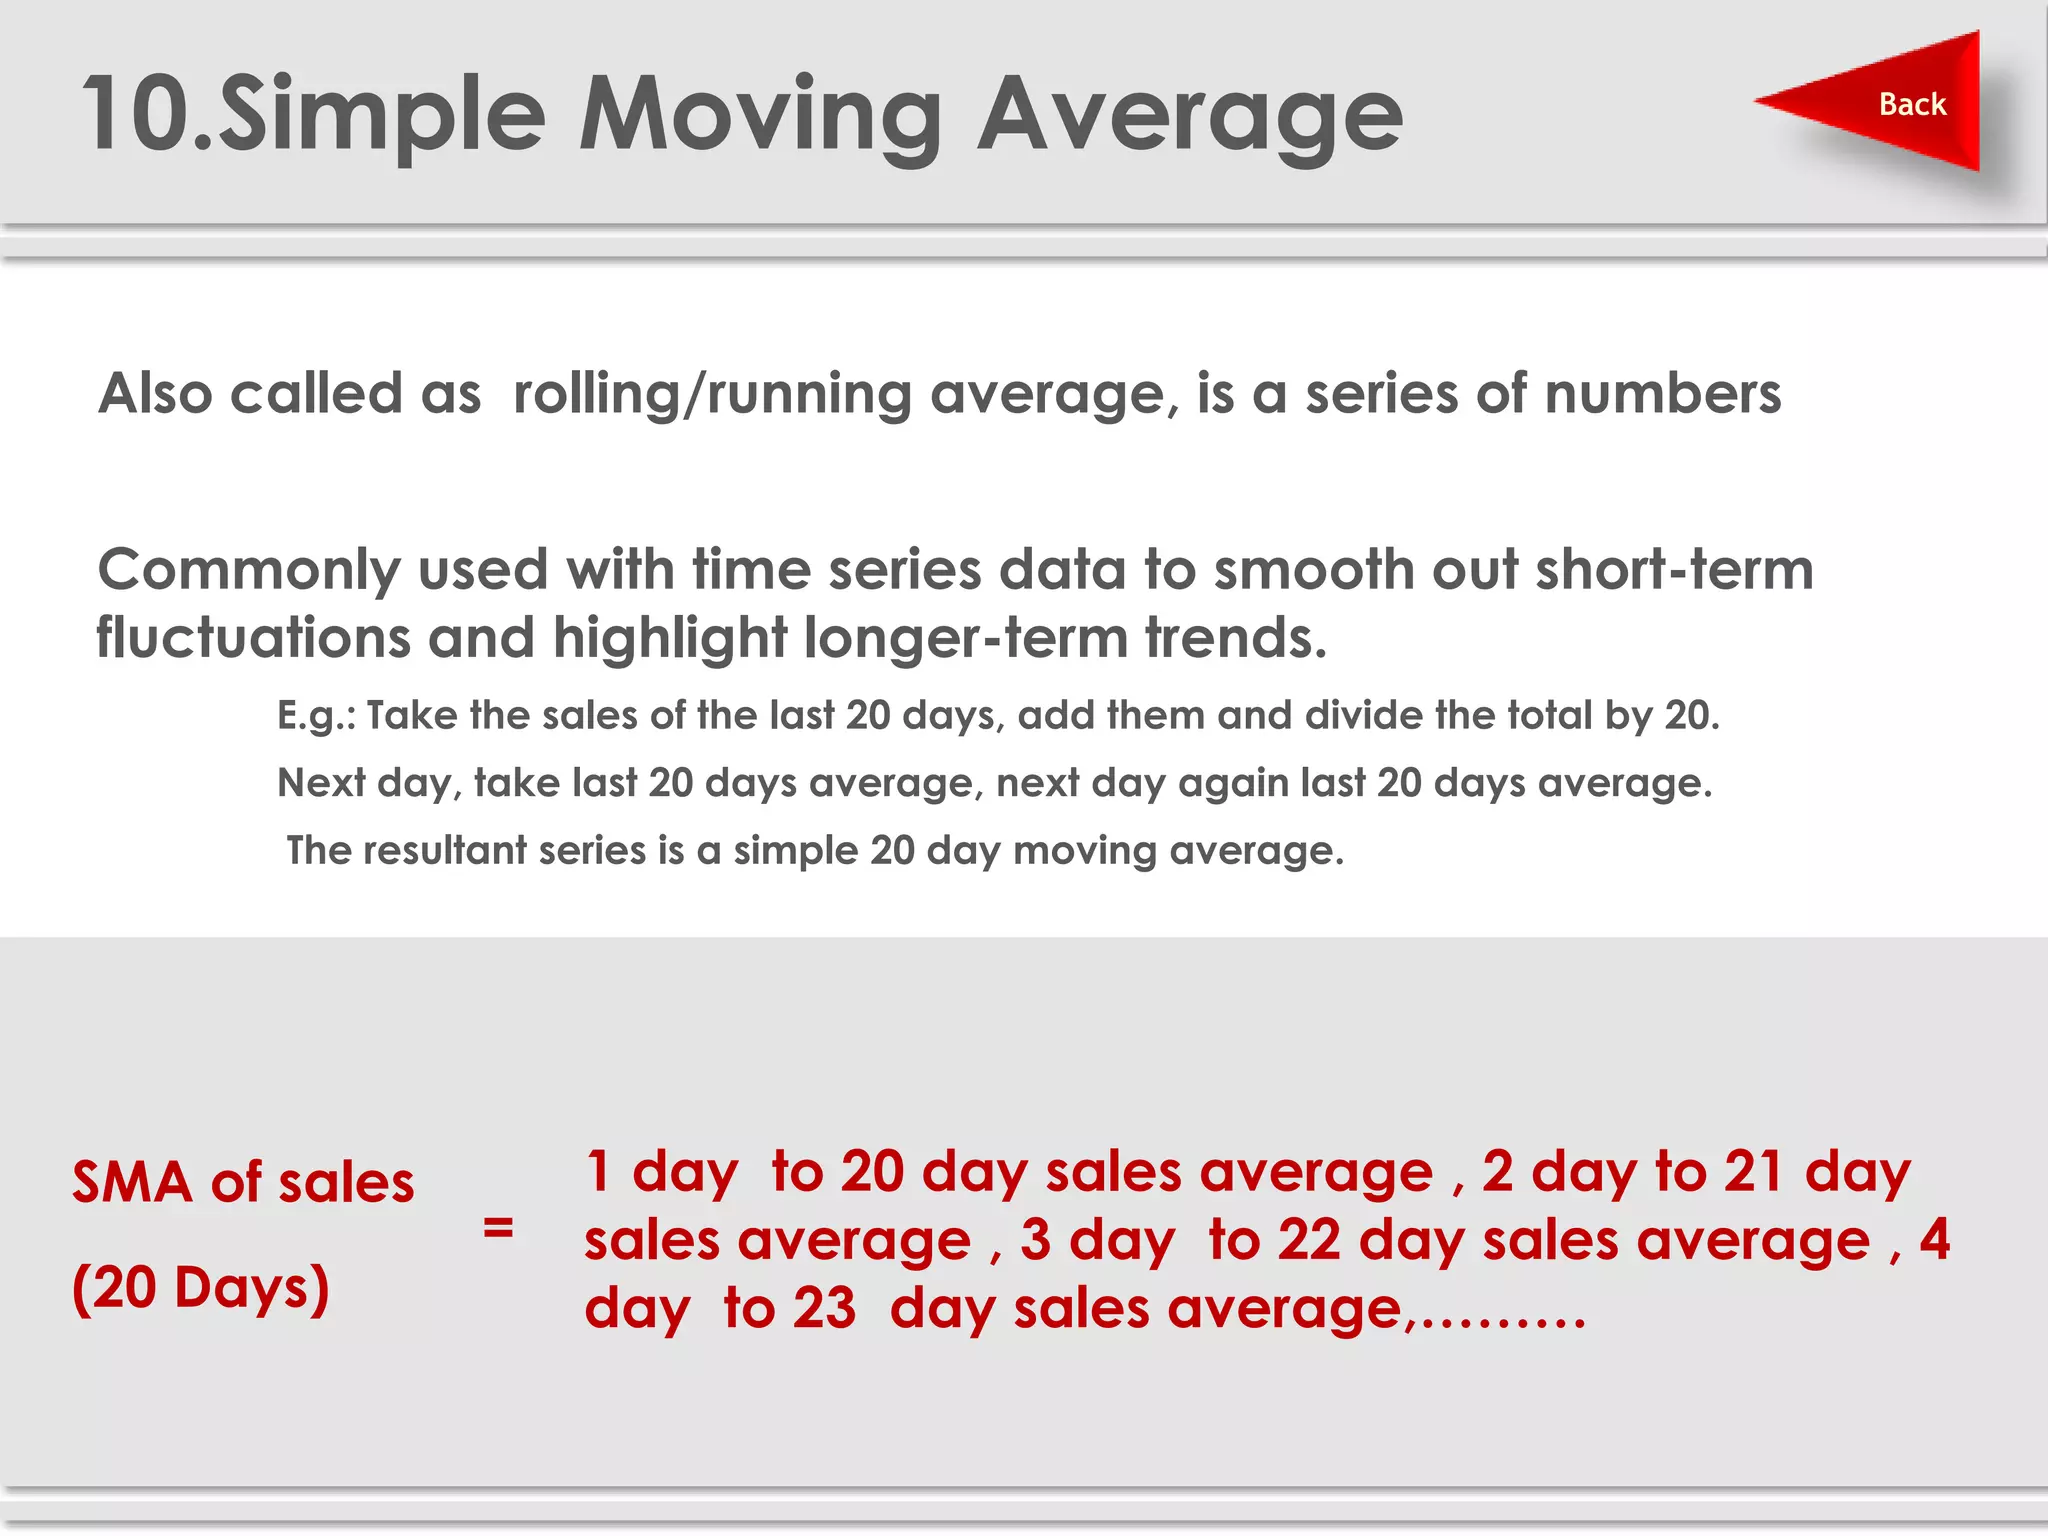
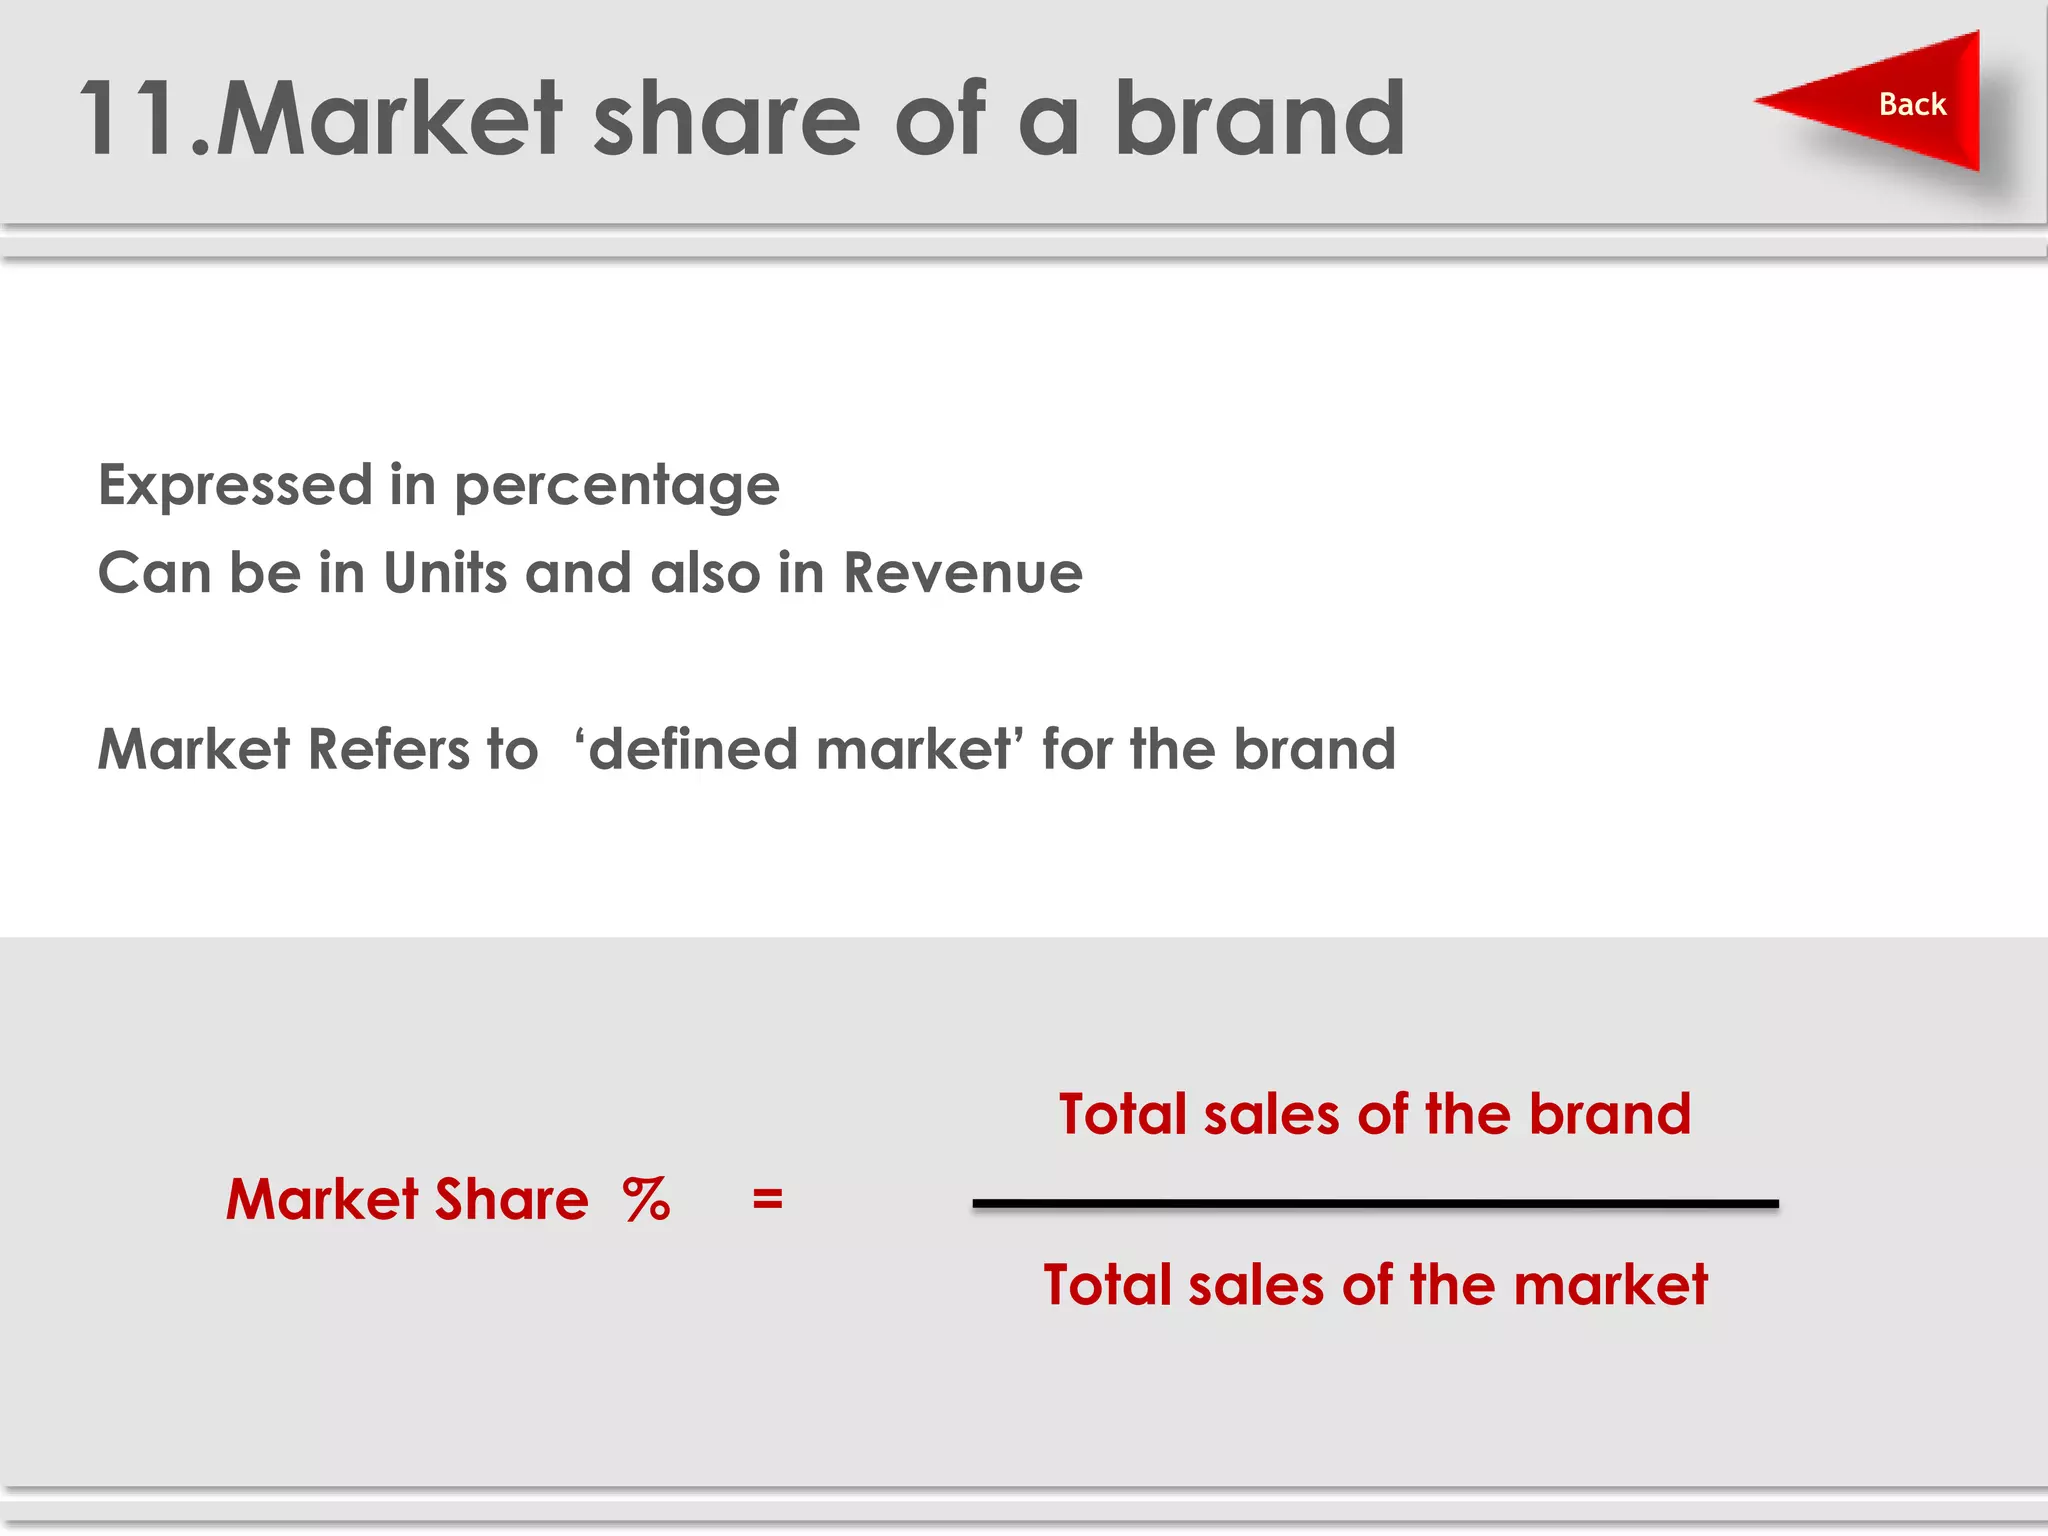
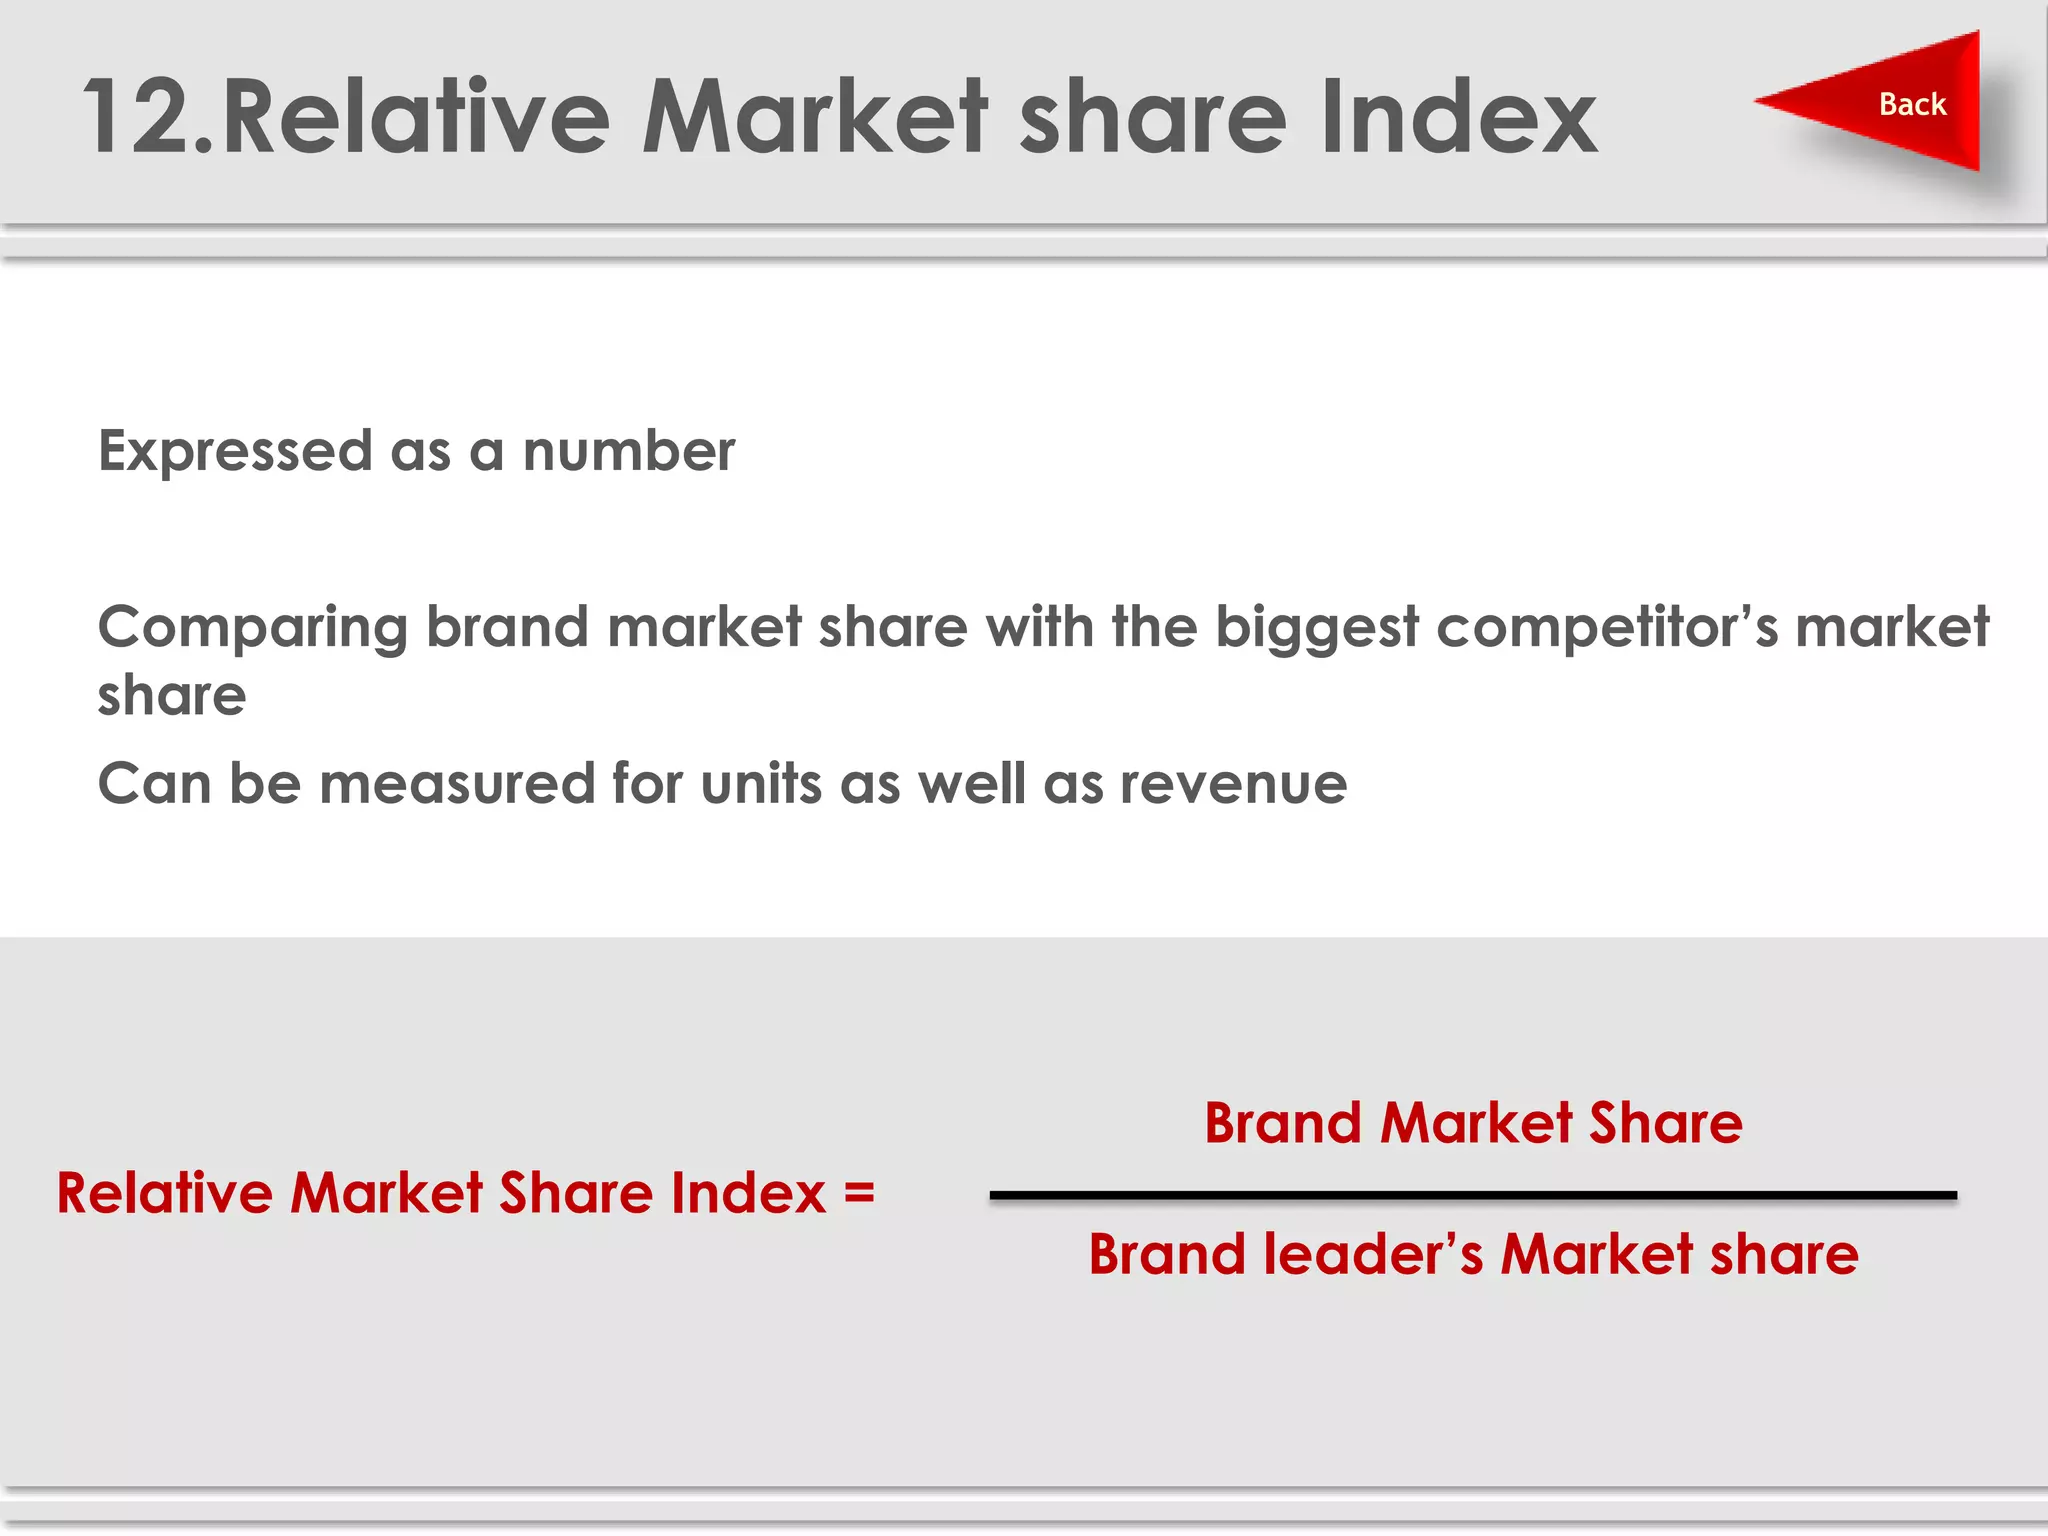
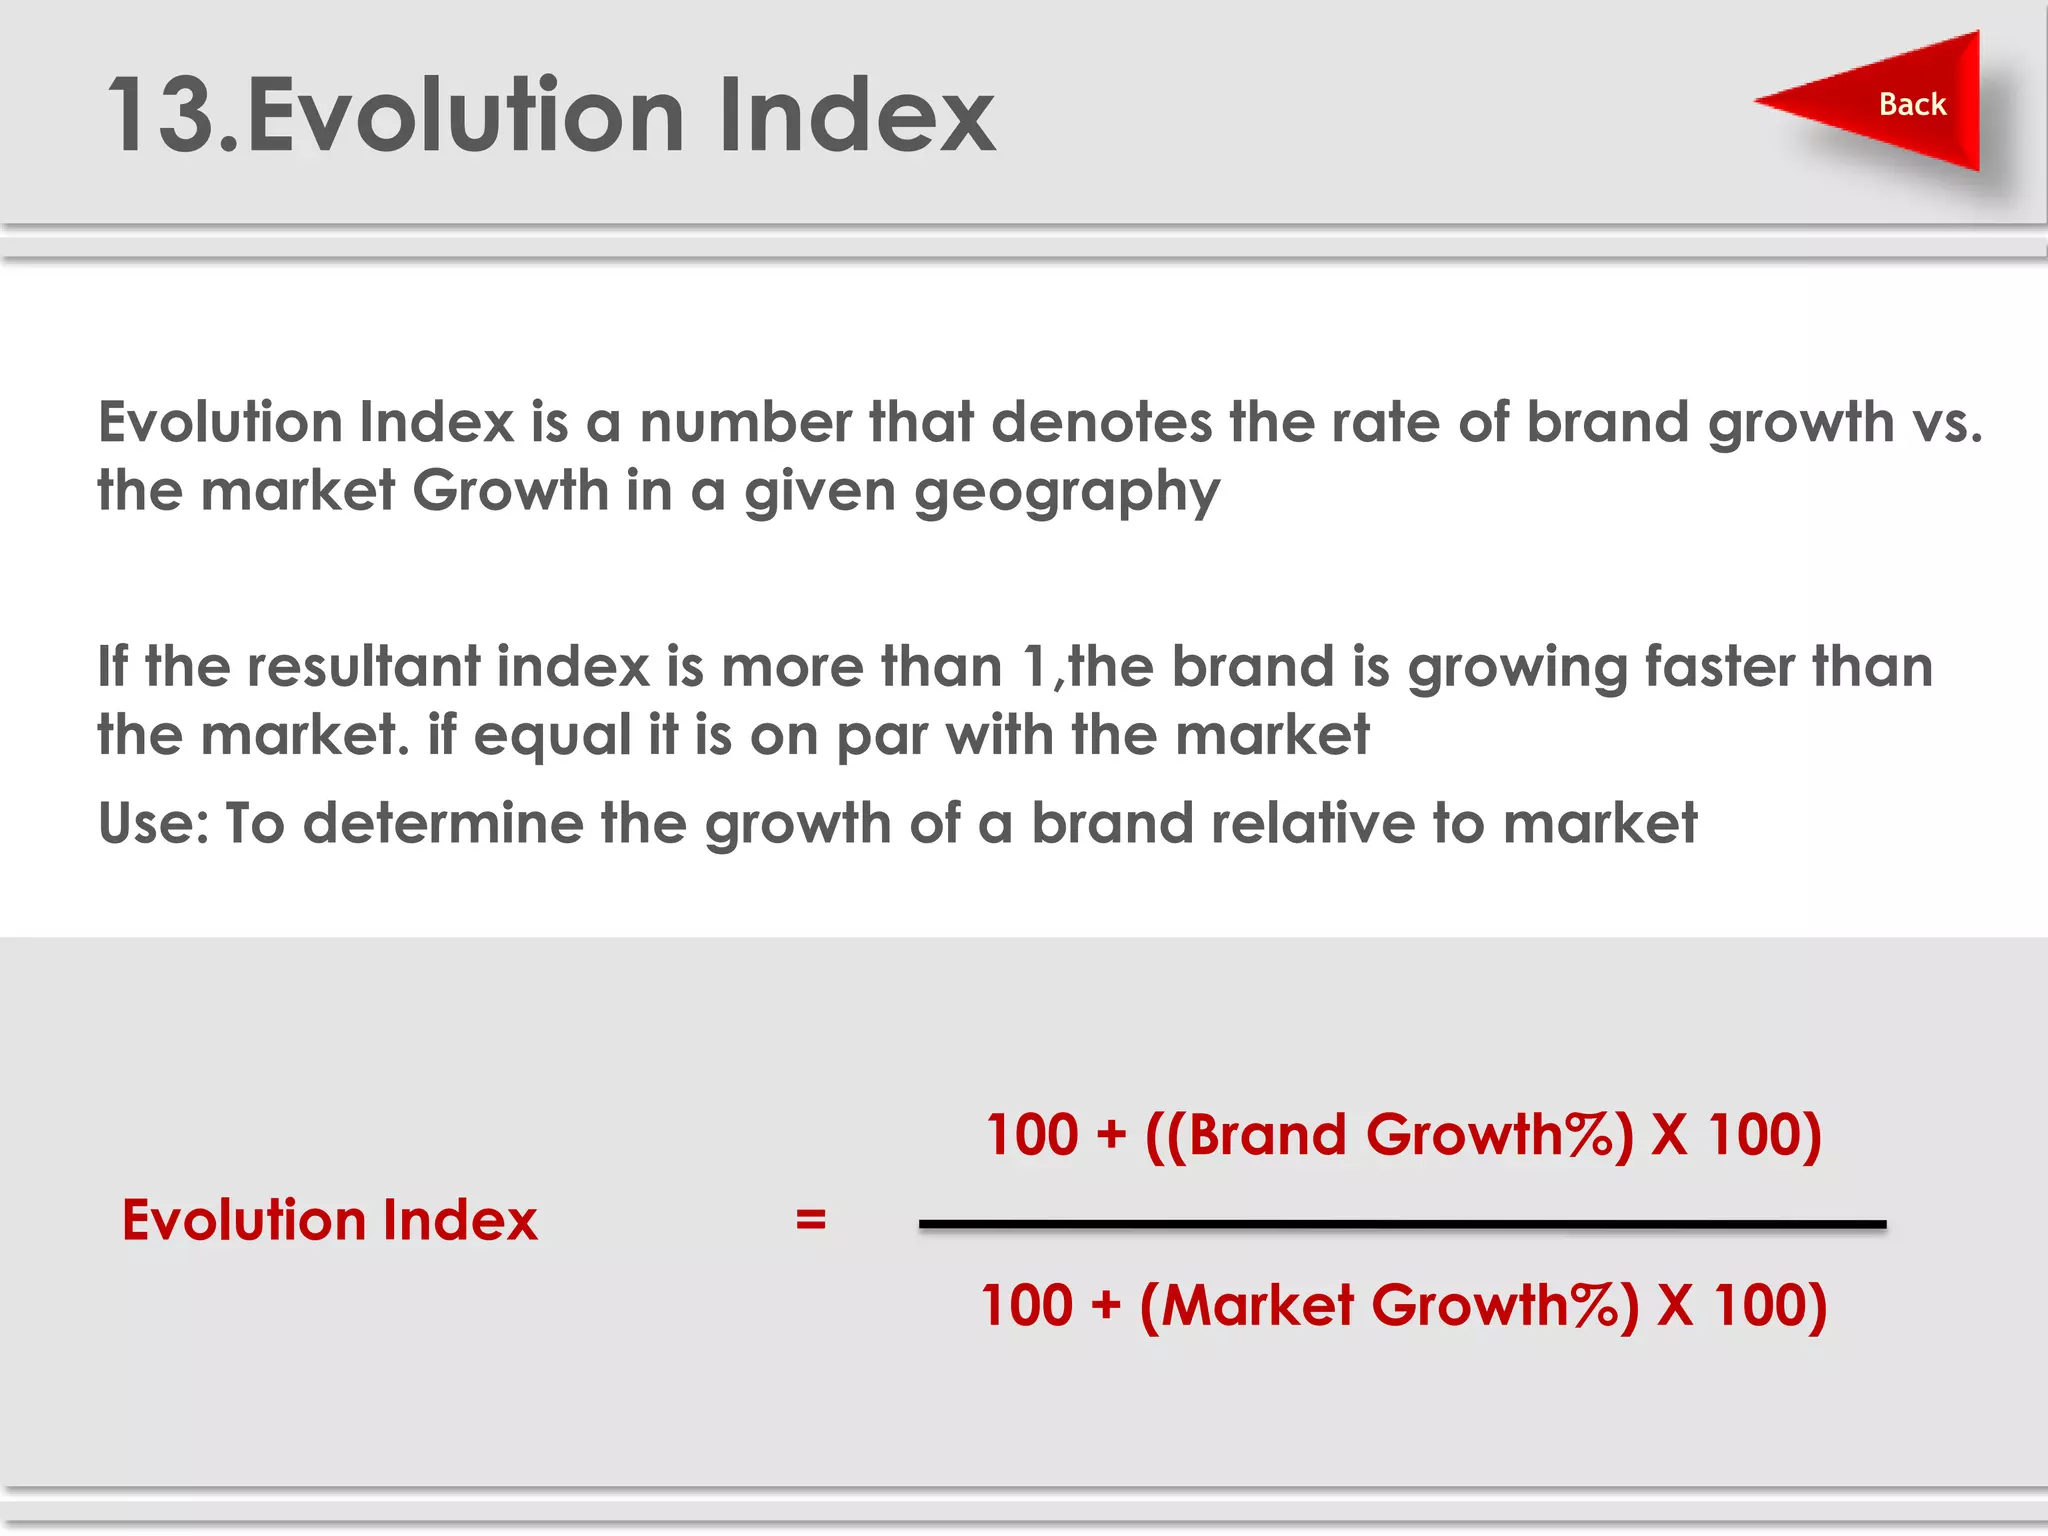
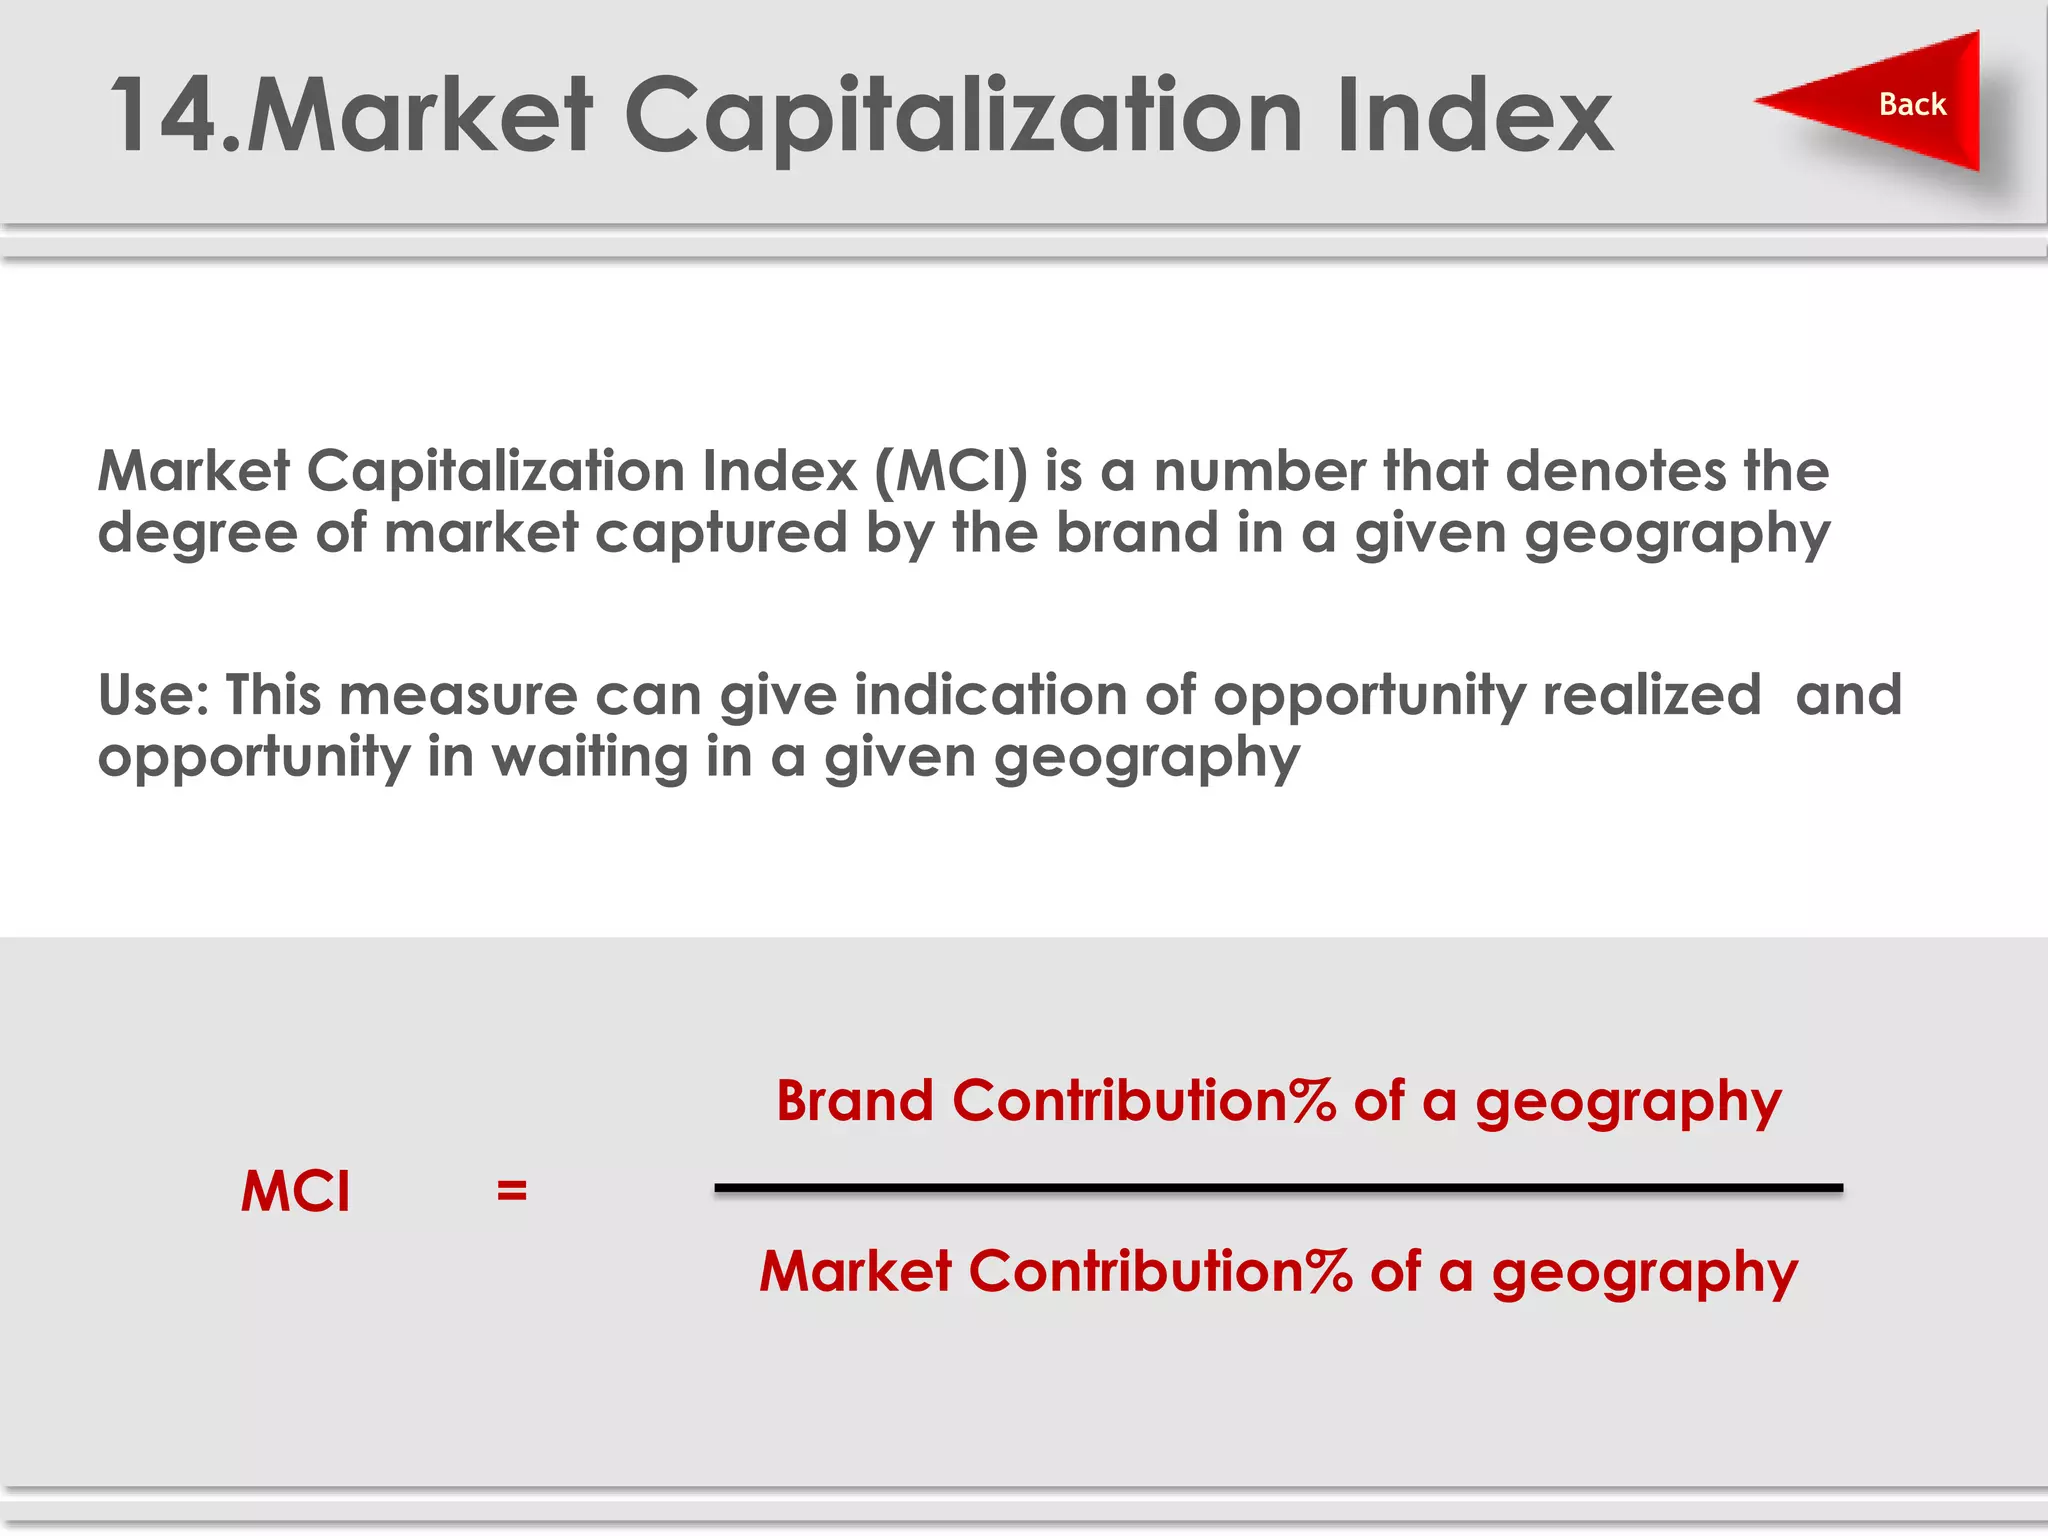
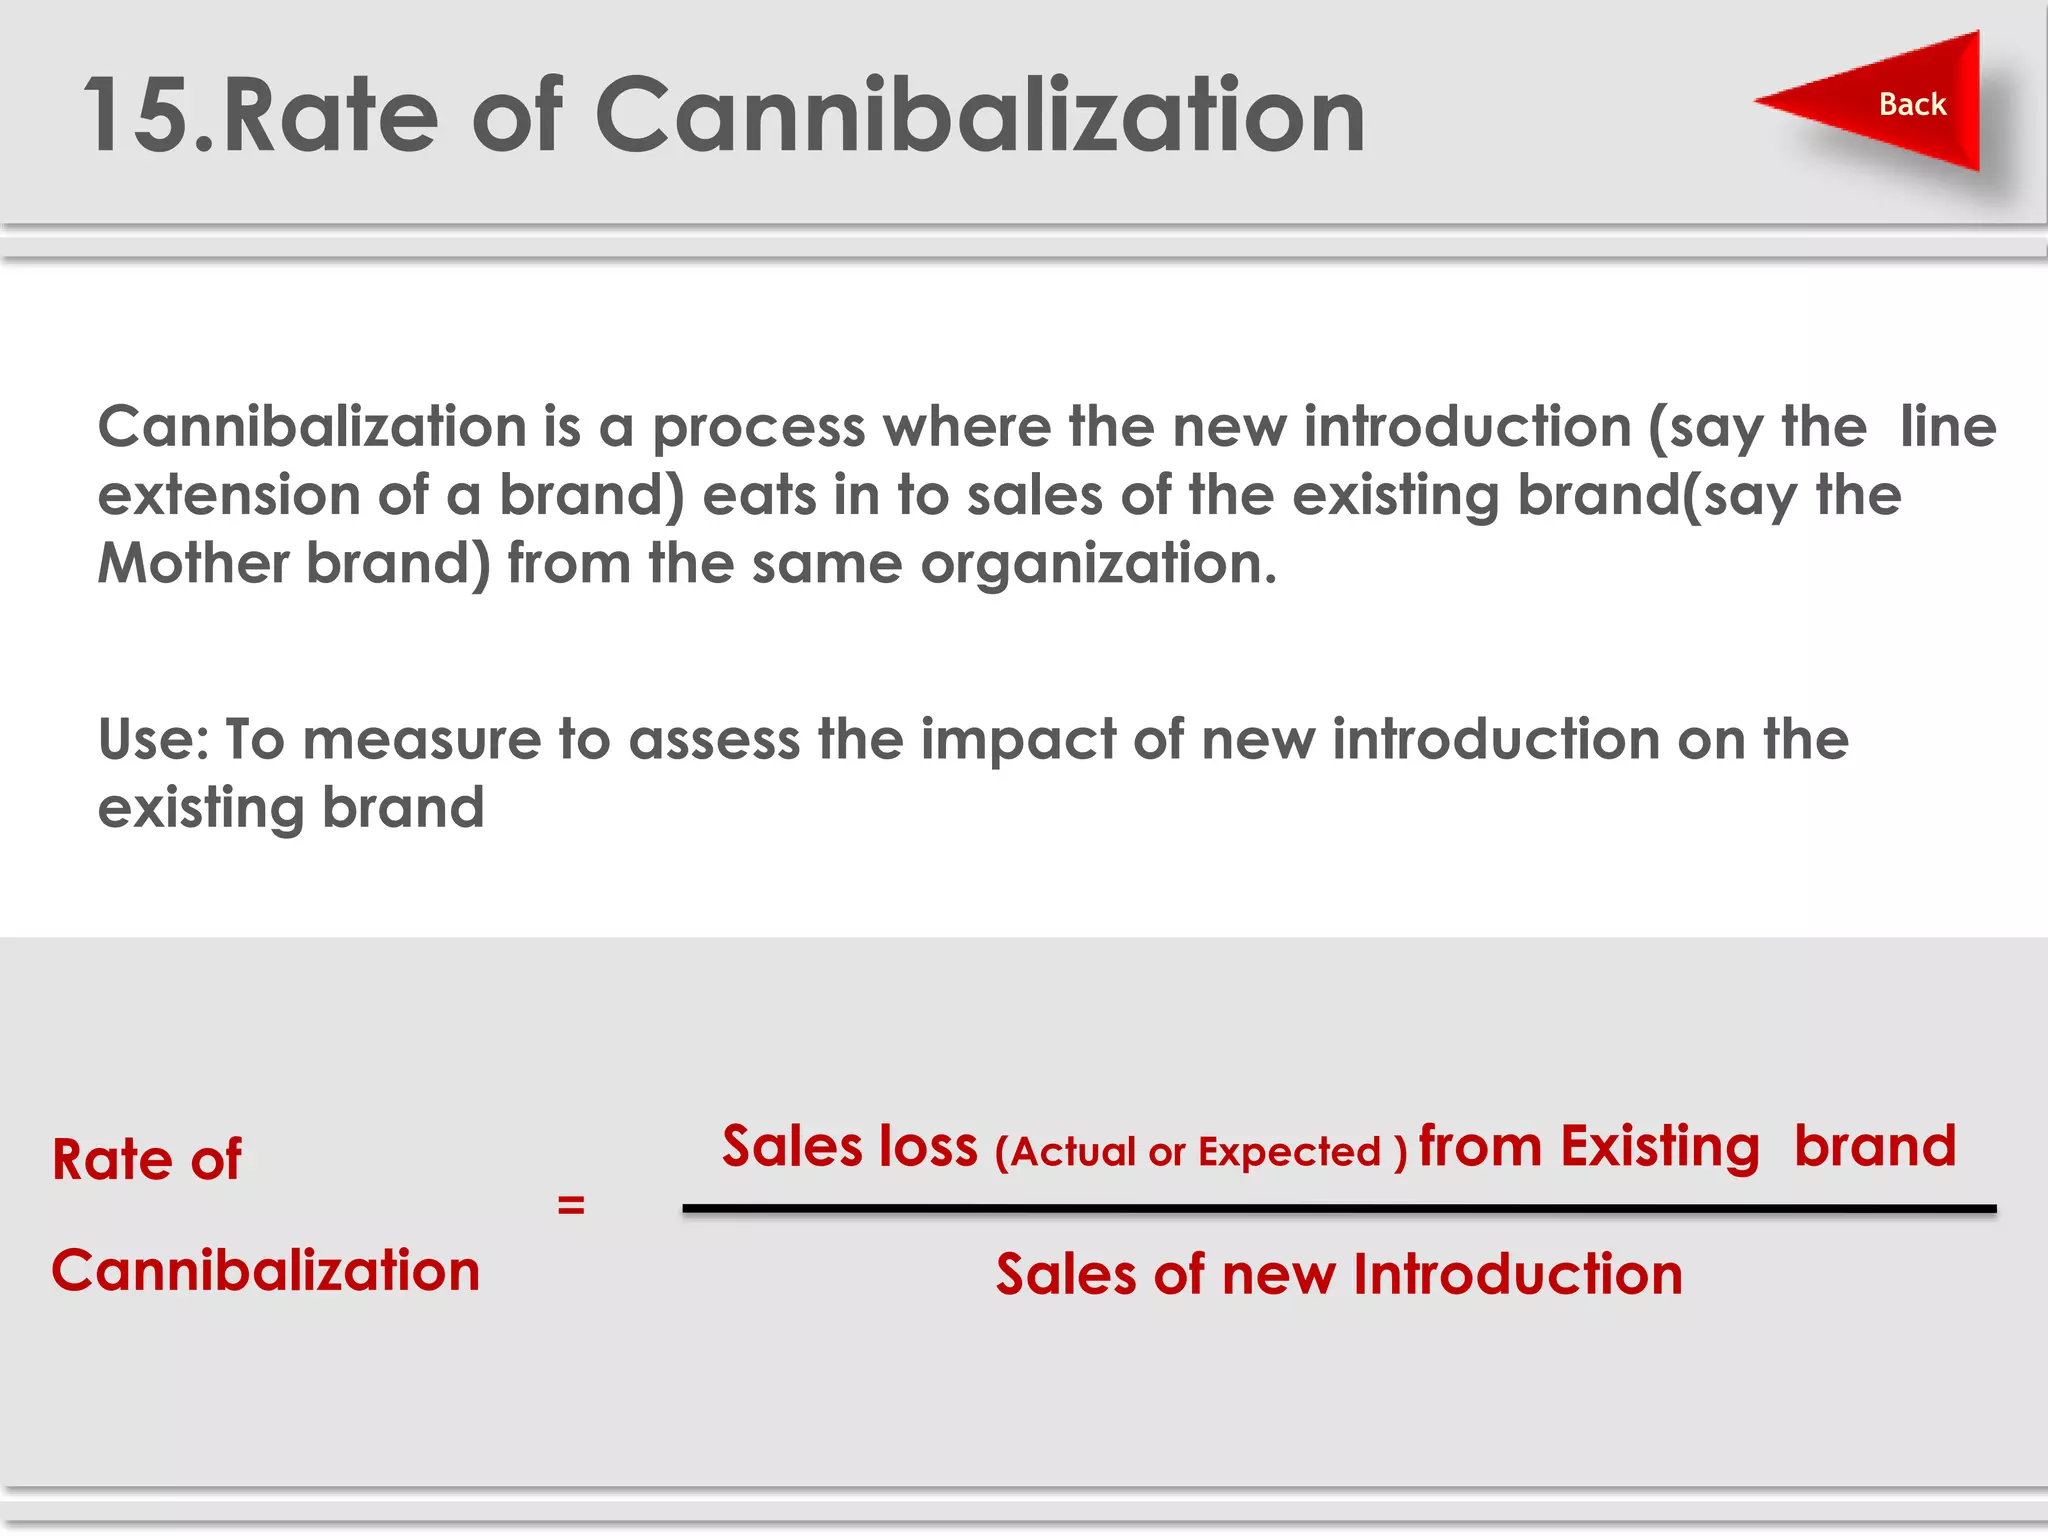
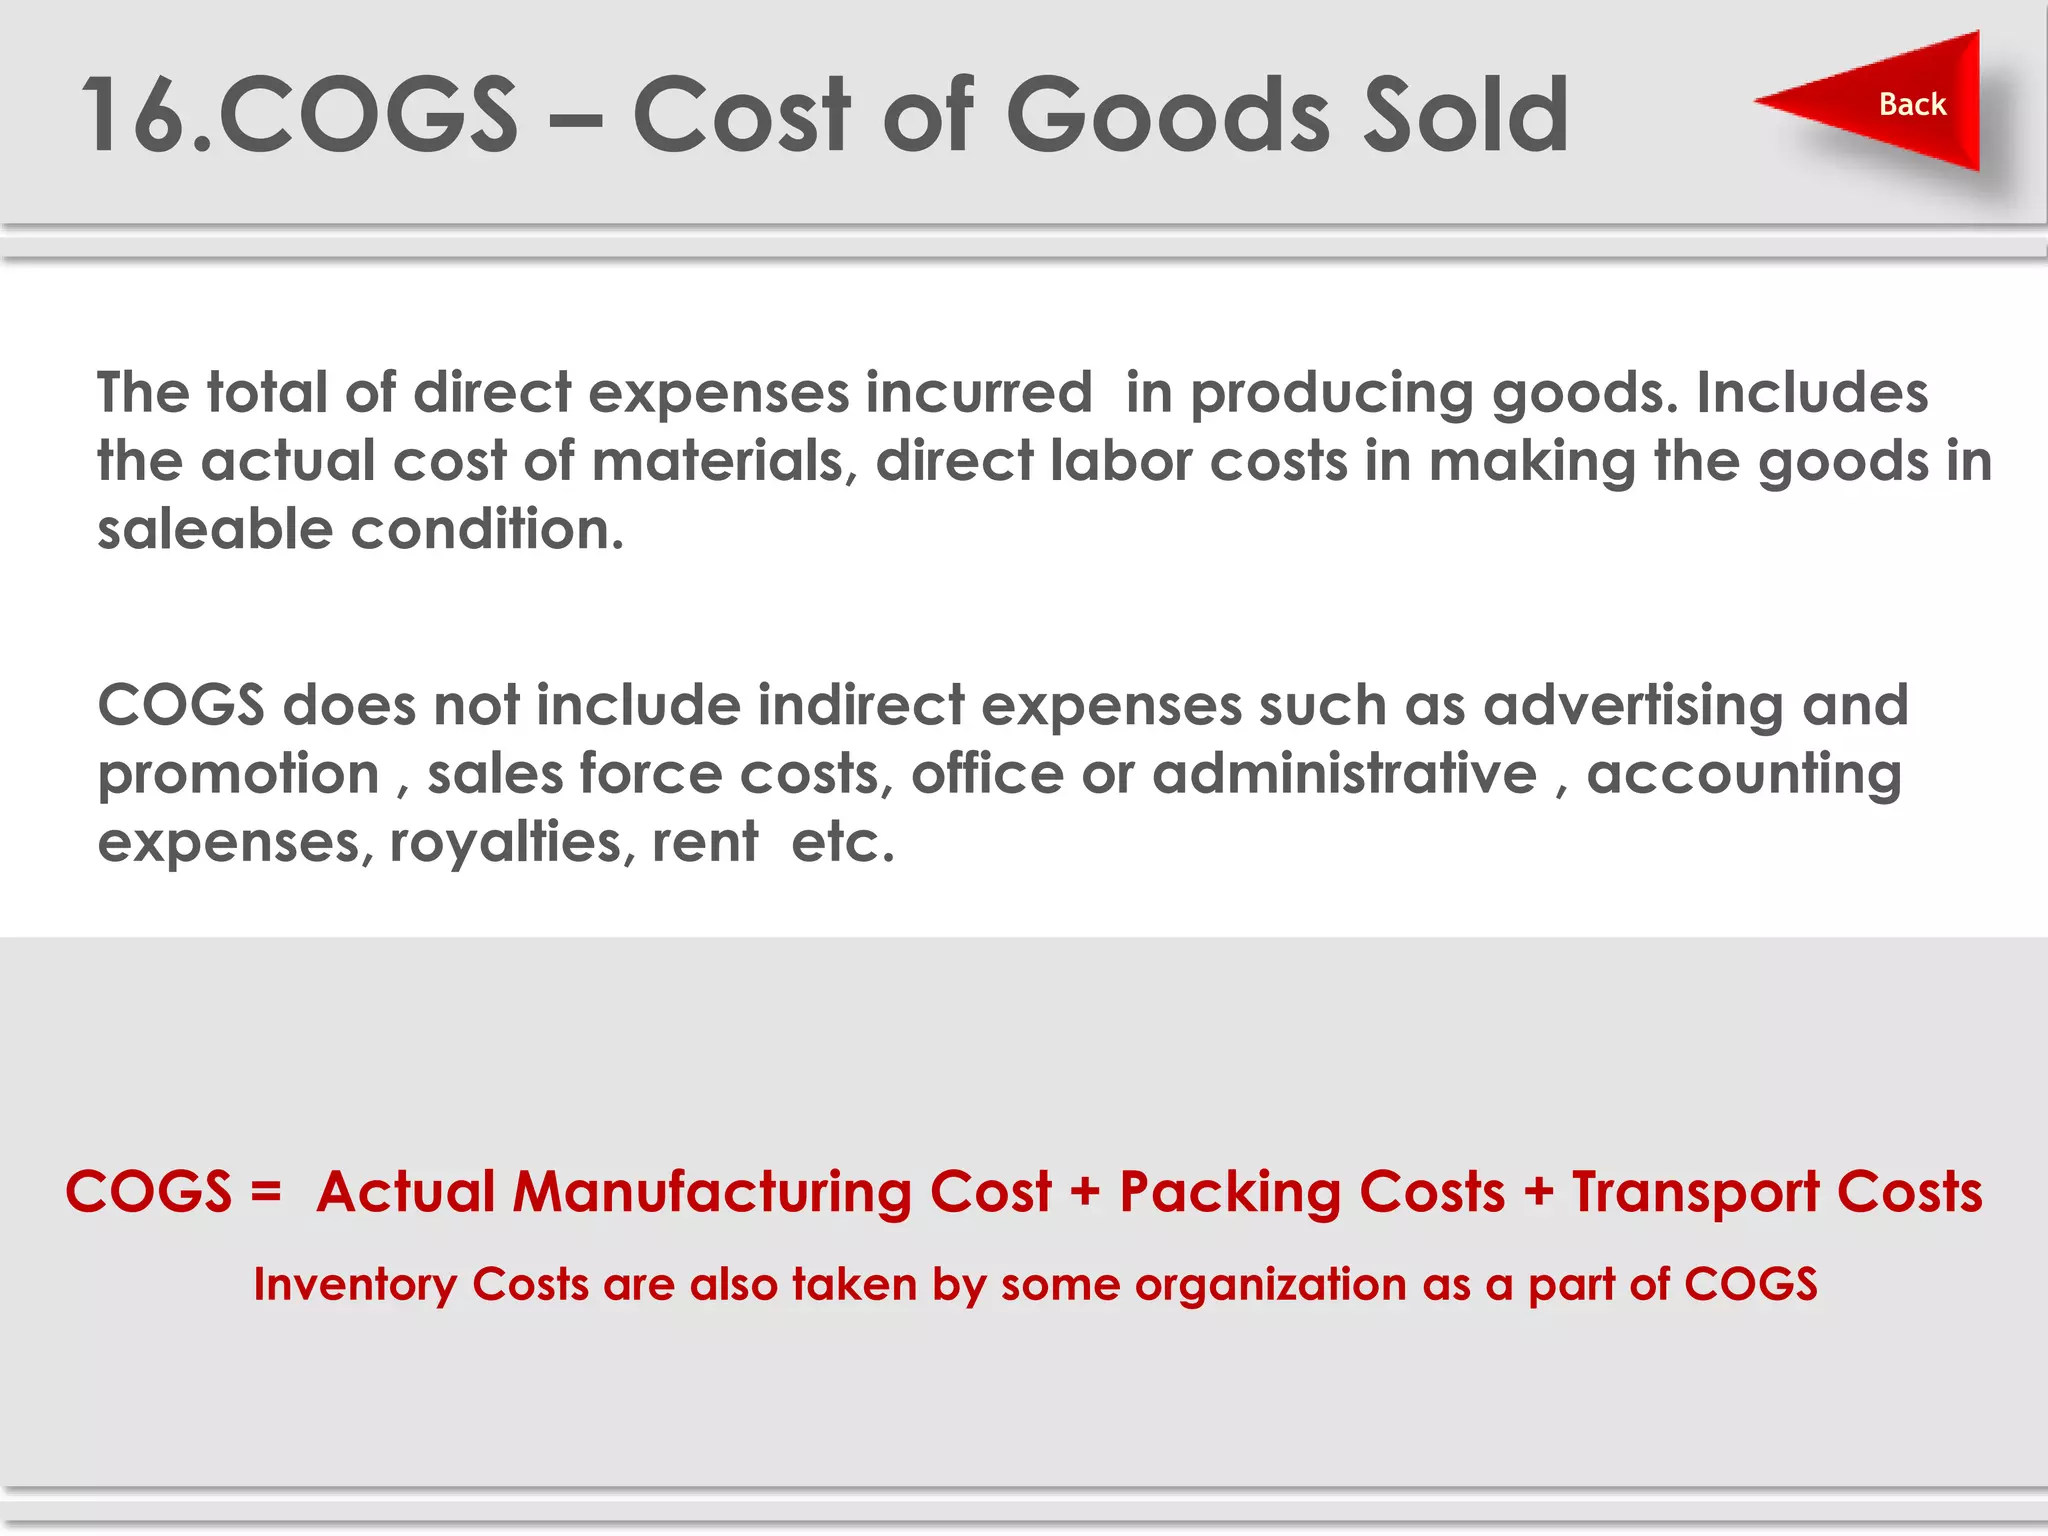
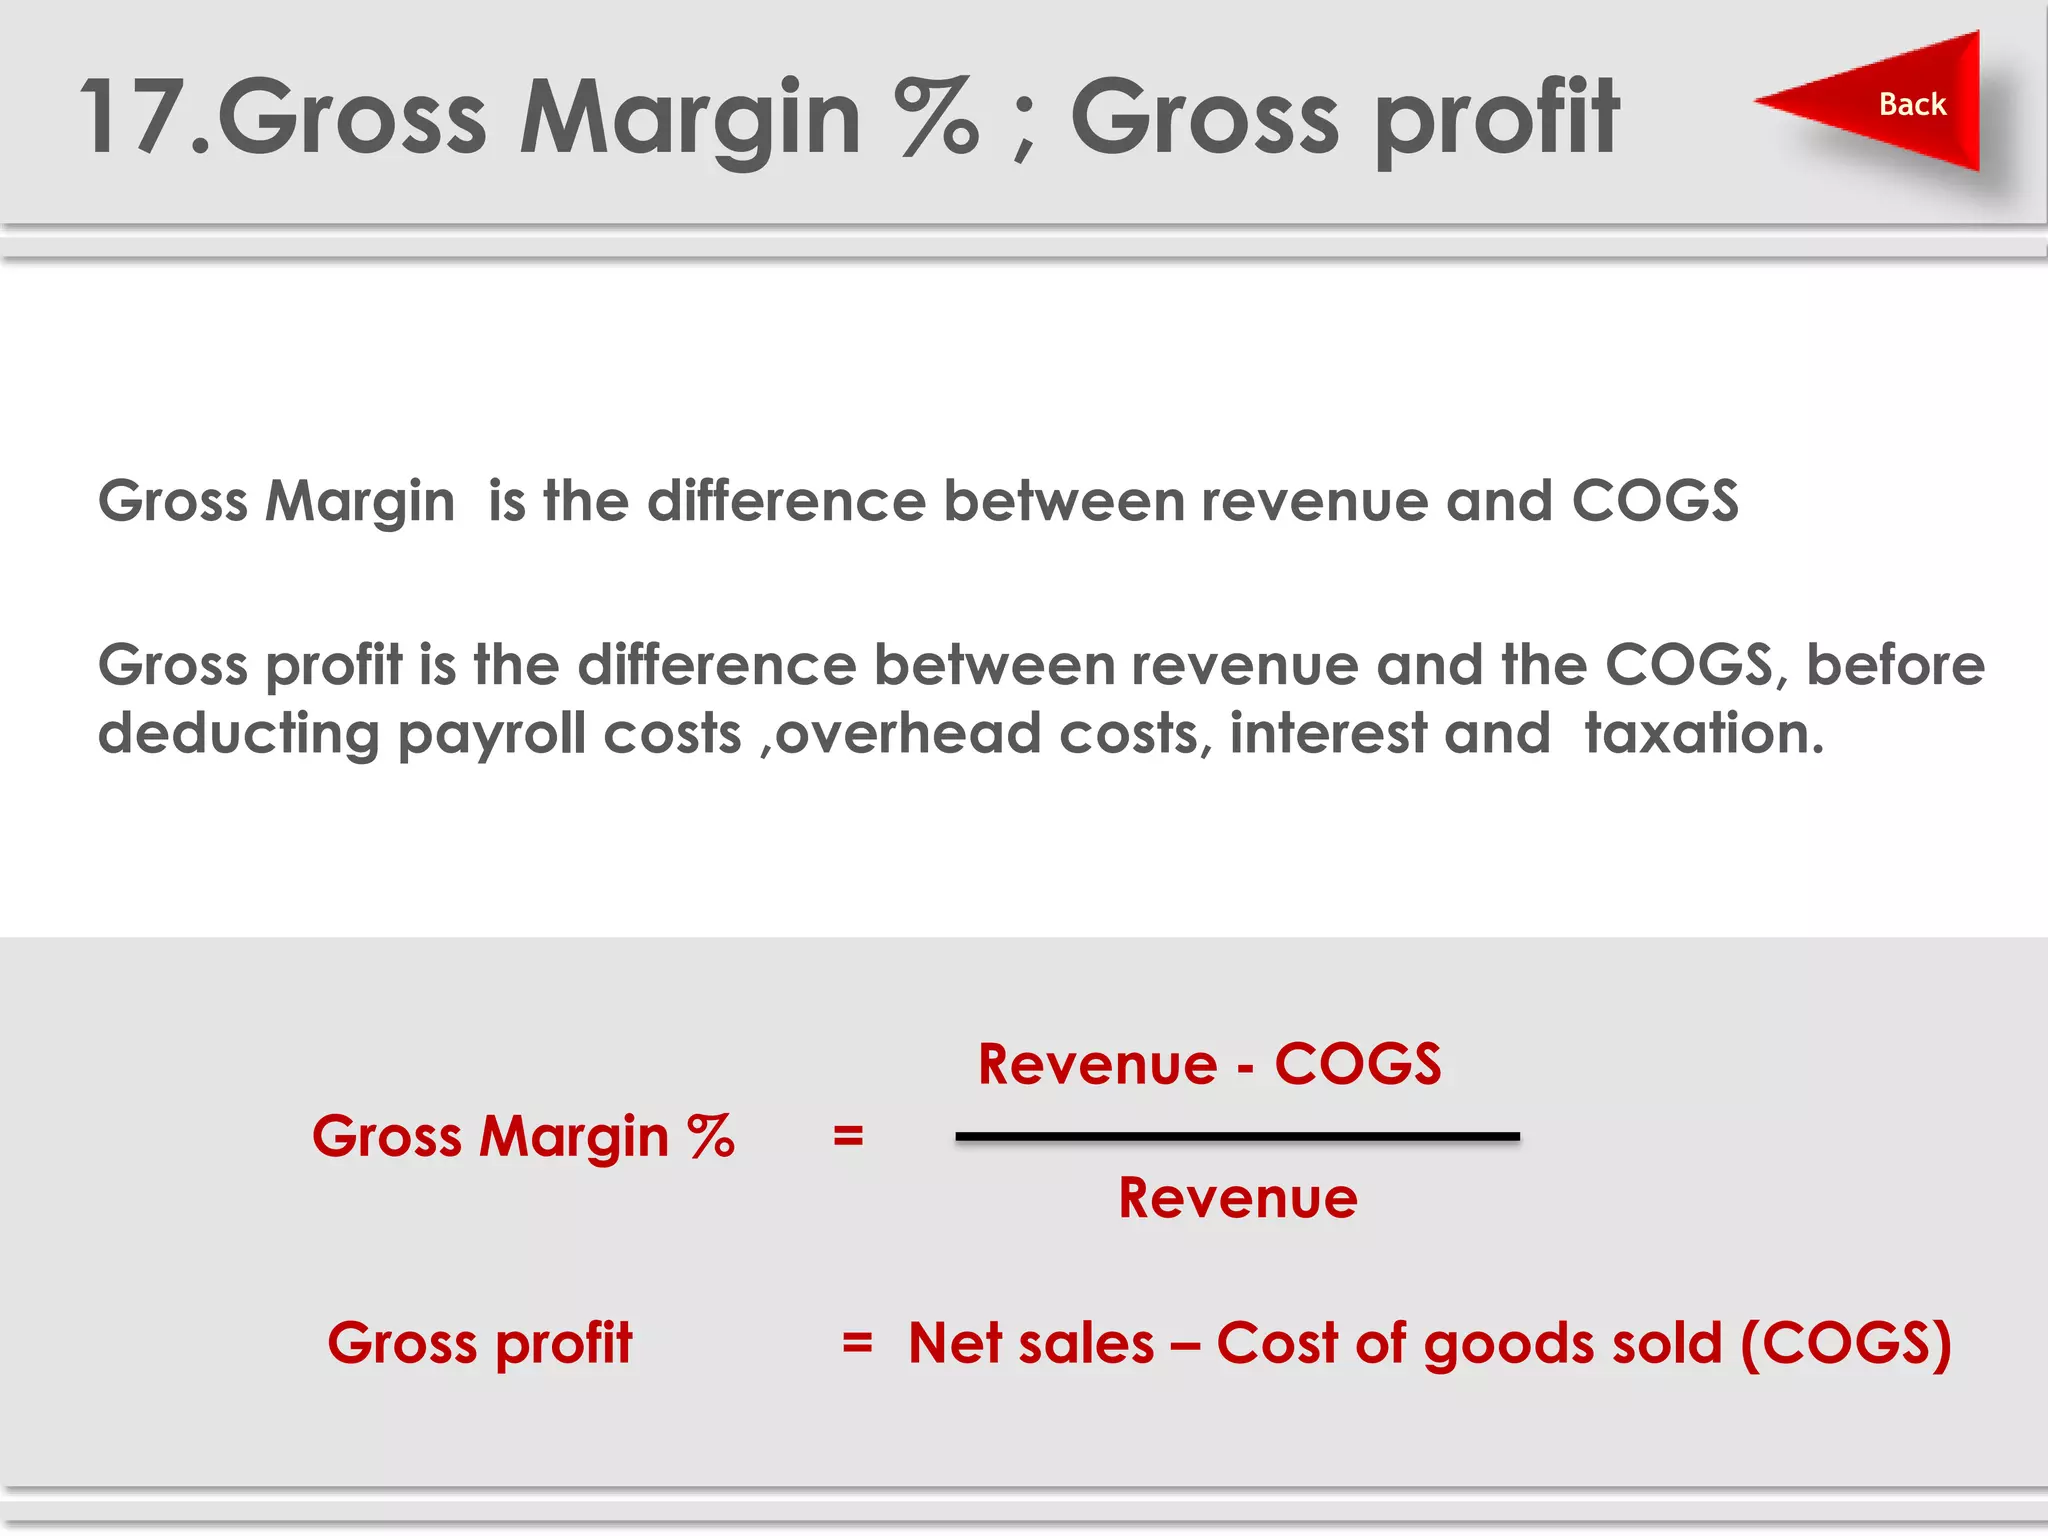
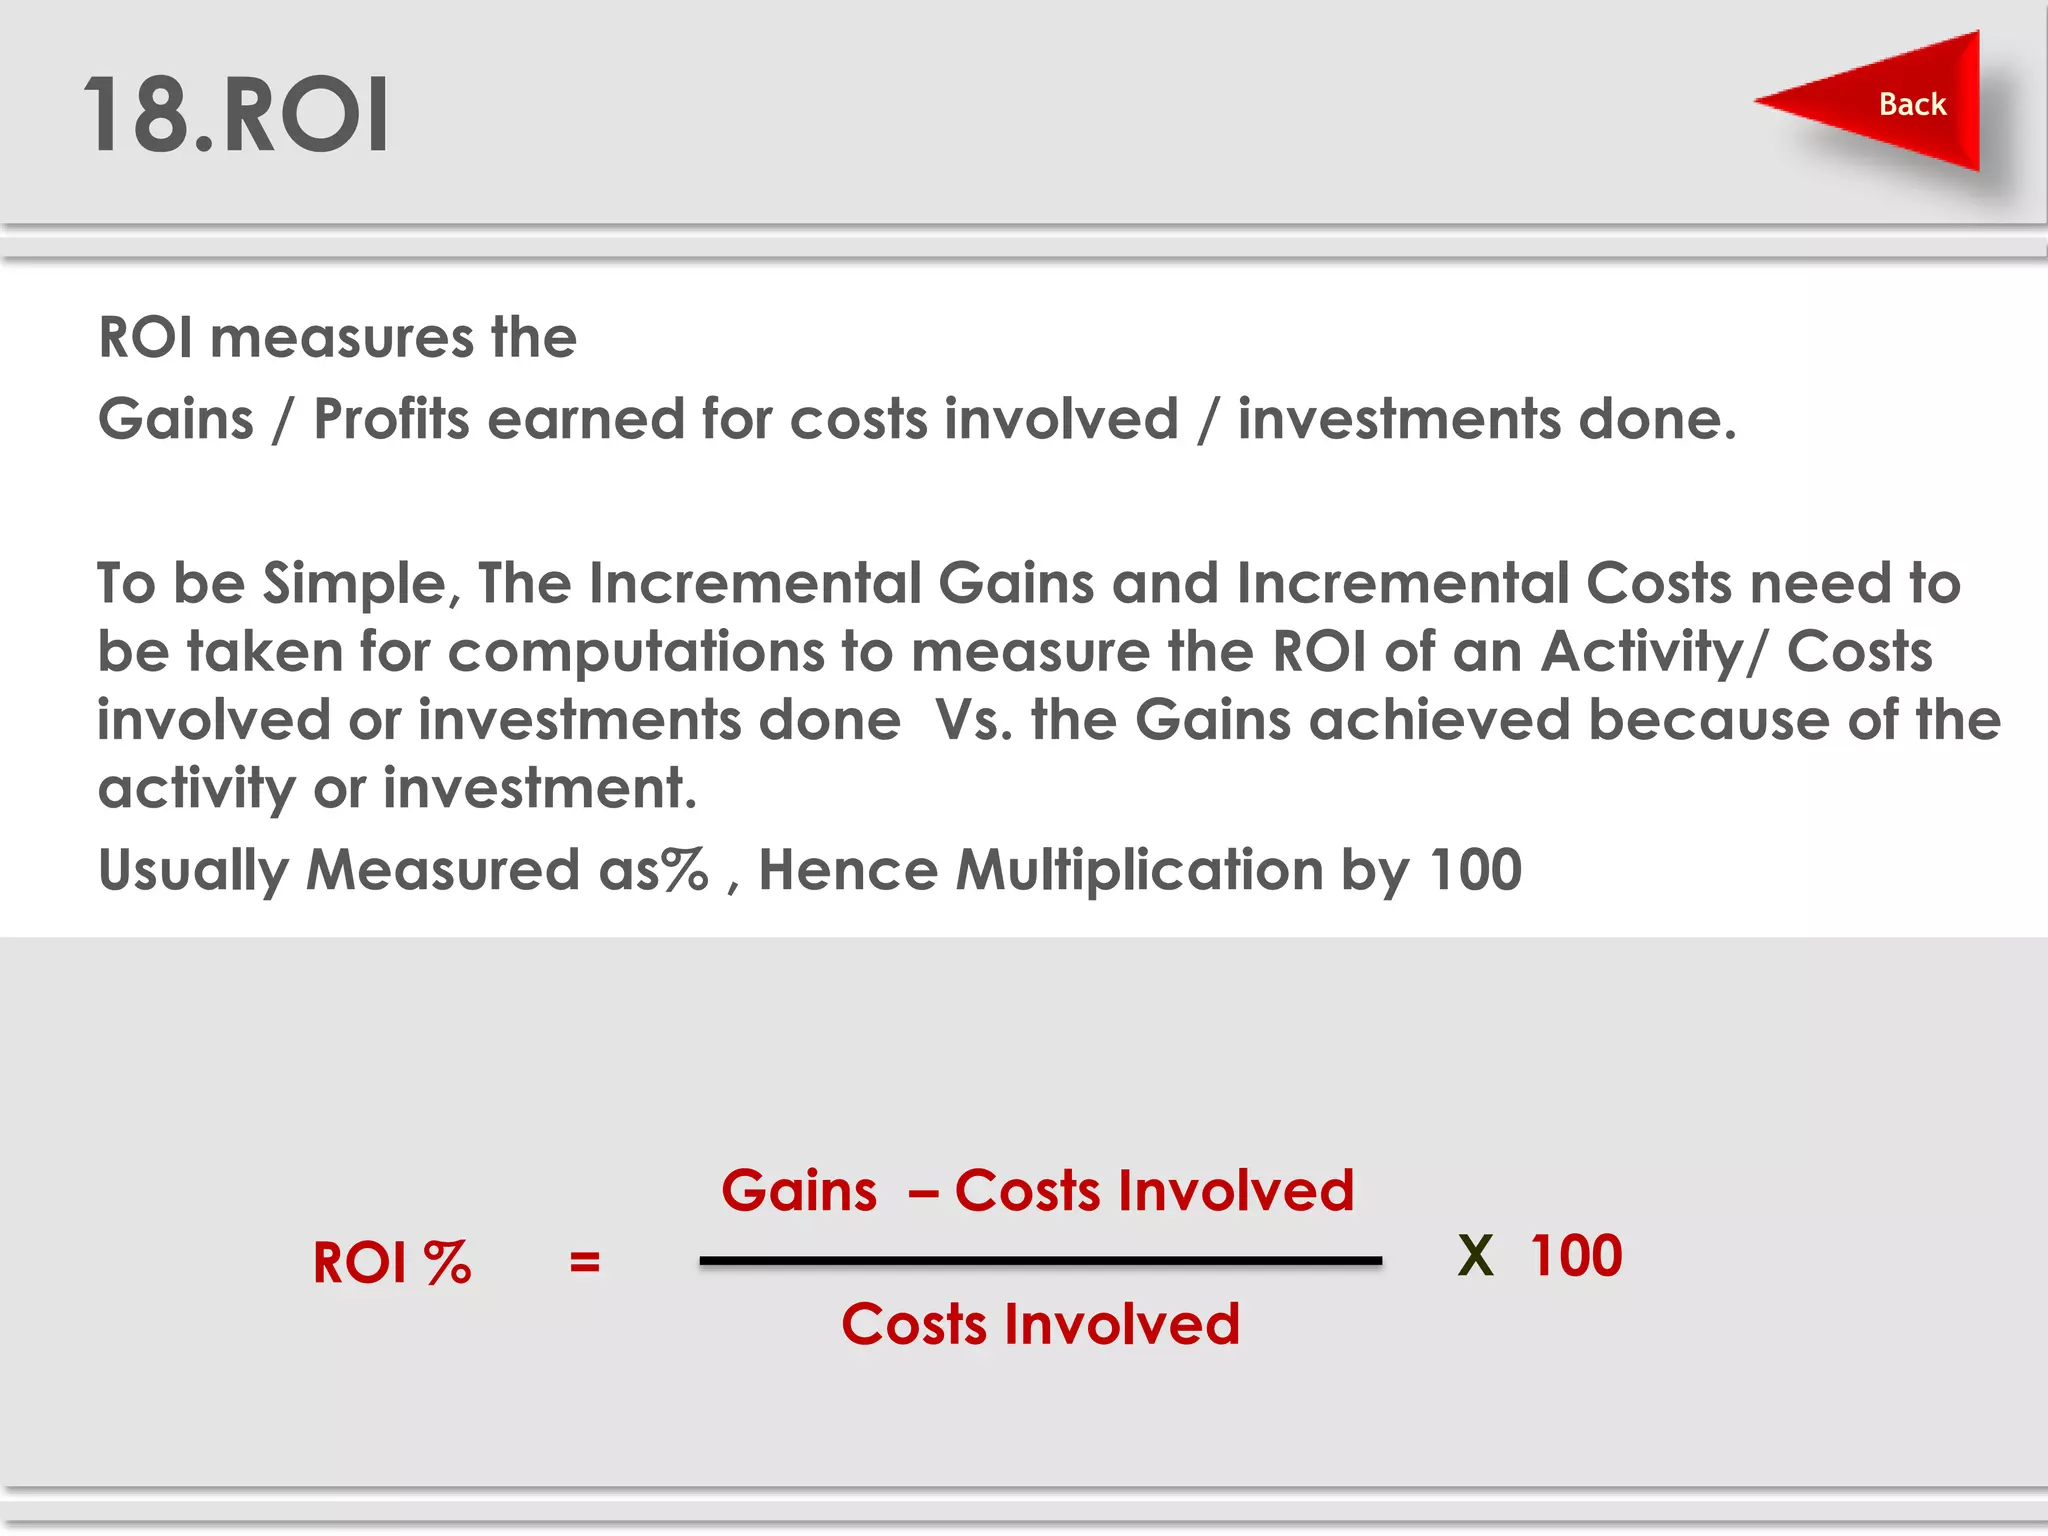
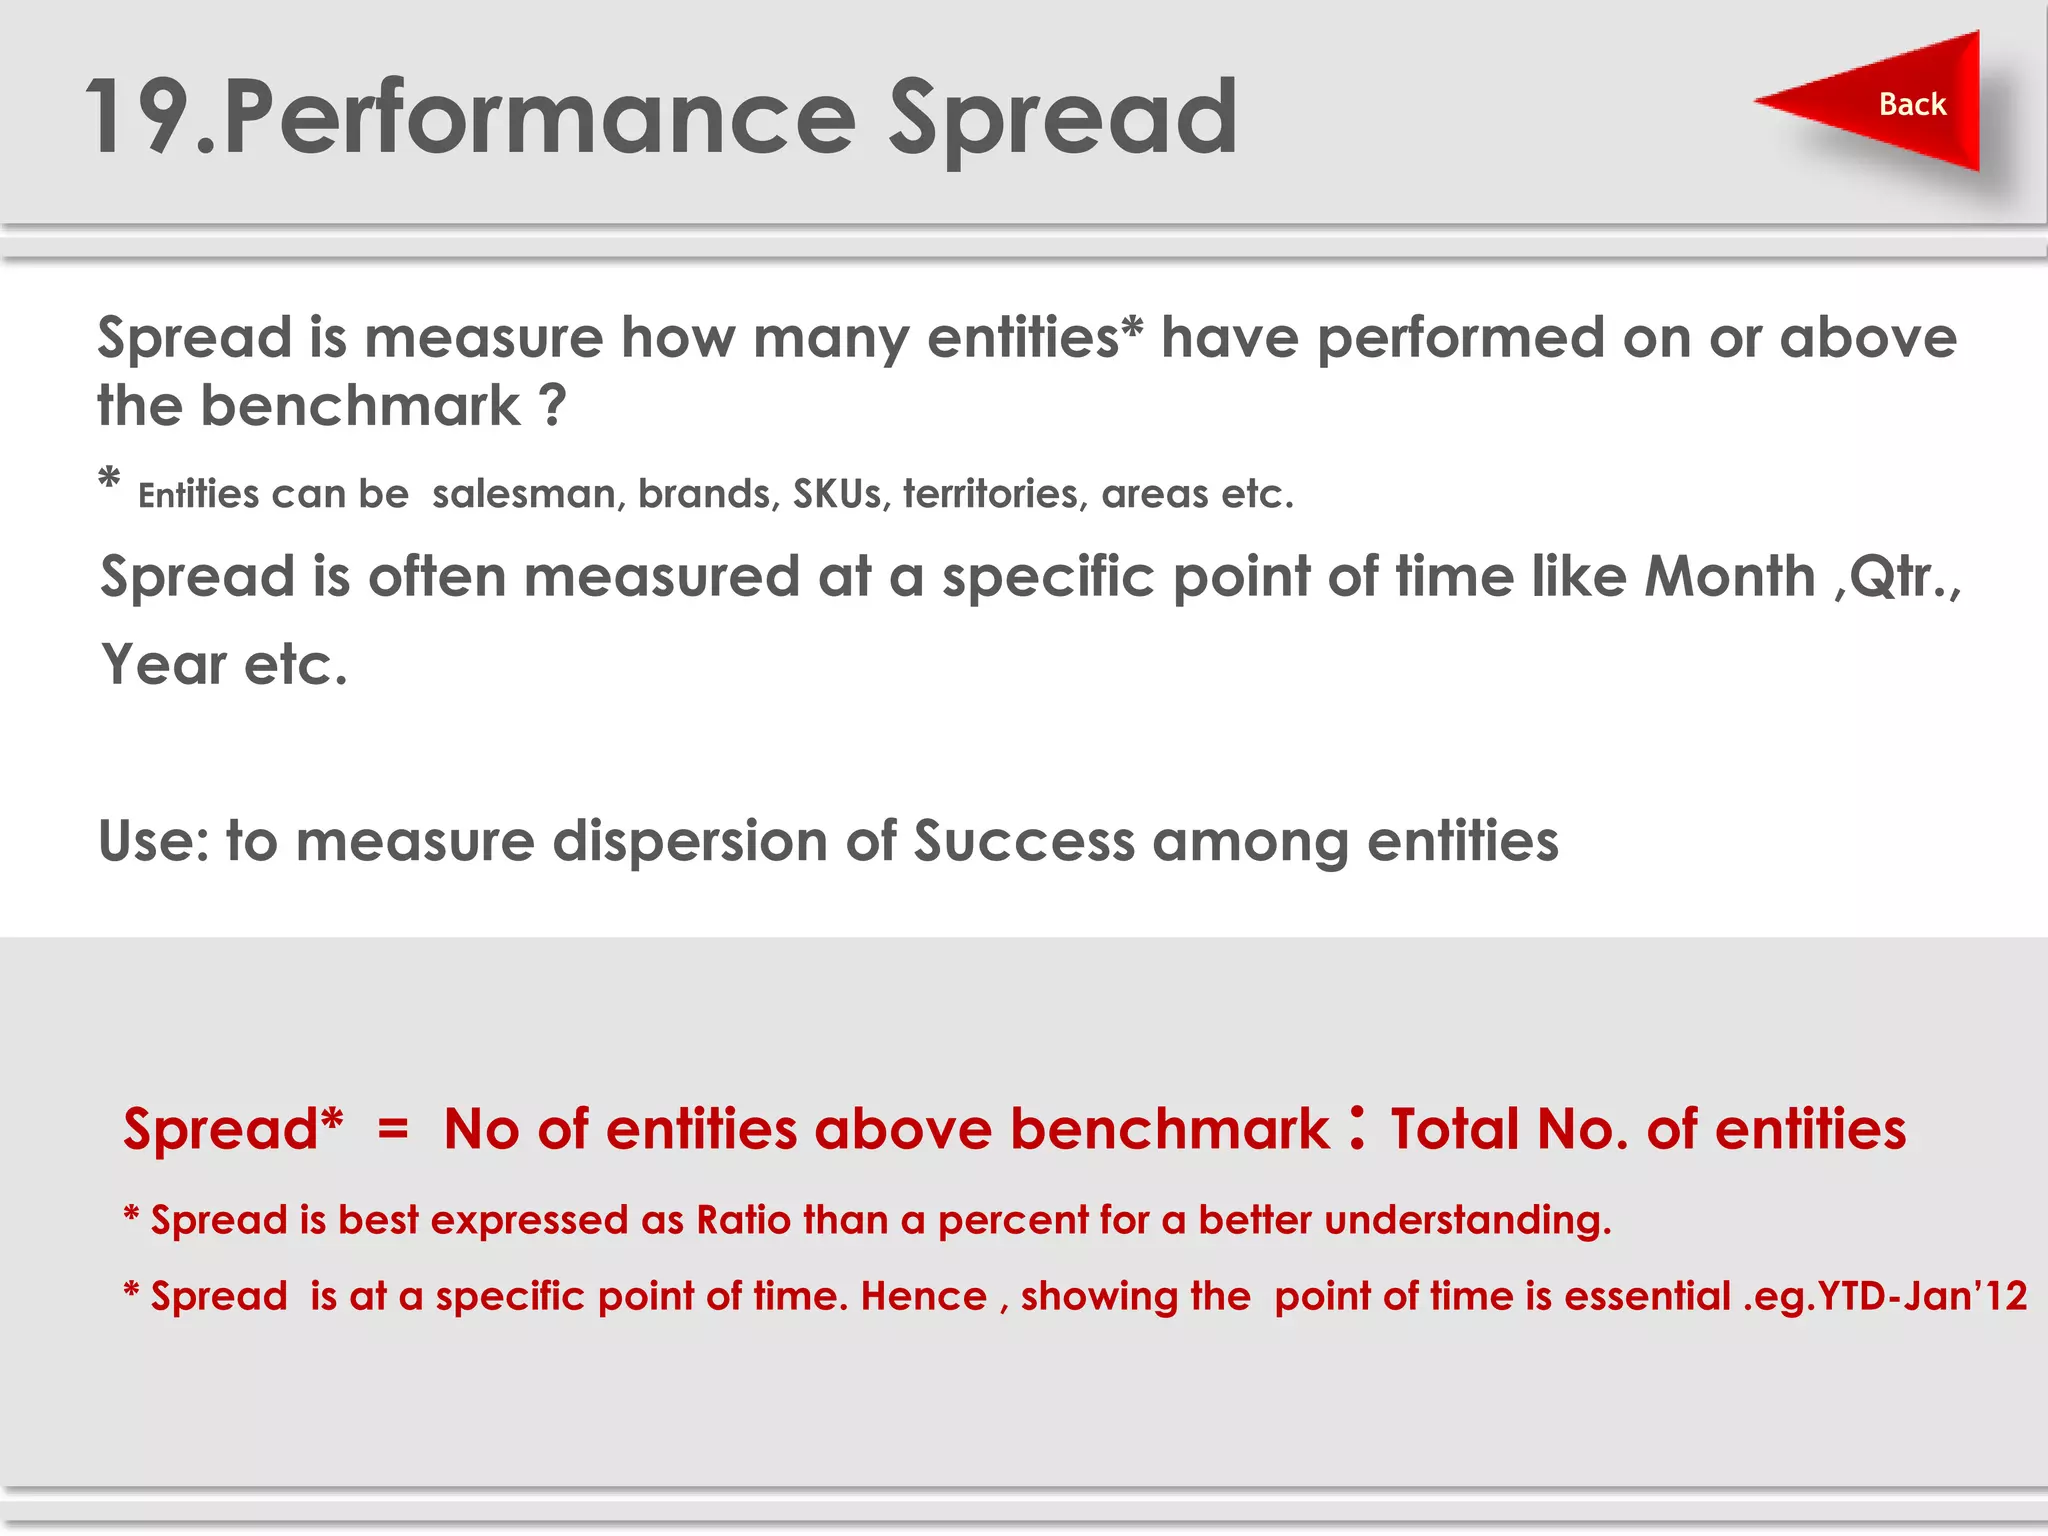


The document provides definitions and explanations of 20 key sales and marketing metrics. Some of the most important metrics discussed include target achievement, incremental and growth rates, CAGR, market share, contribution percent, ROI, performance spread, and performance span. Collectively, these metrics can help sales and marketing managers better measure, analyze, and improve their performance.


