Downloaded 57 times


![Contact us to help get your business On Target for success in 2010! Advisors On Target Linnea Blair Office: 619.291.3700 Email: [email_address] Web: AdvisorsOnTarget.com Twitter: AdvisorOnTarget Facebook:facebook.com/AdvisorsOnTarget LinkedIn:linkedin.com/in/linneablair](https://image.slidesharecdn.com/breakeven-100726141821-phpapp02/75/Break-Even-27-2048.jpg)

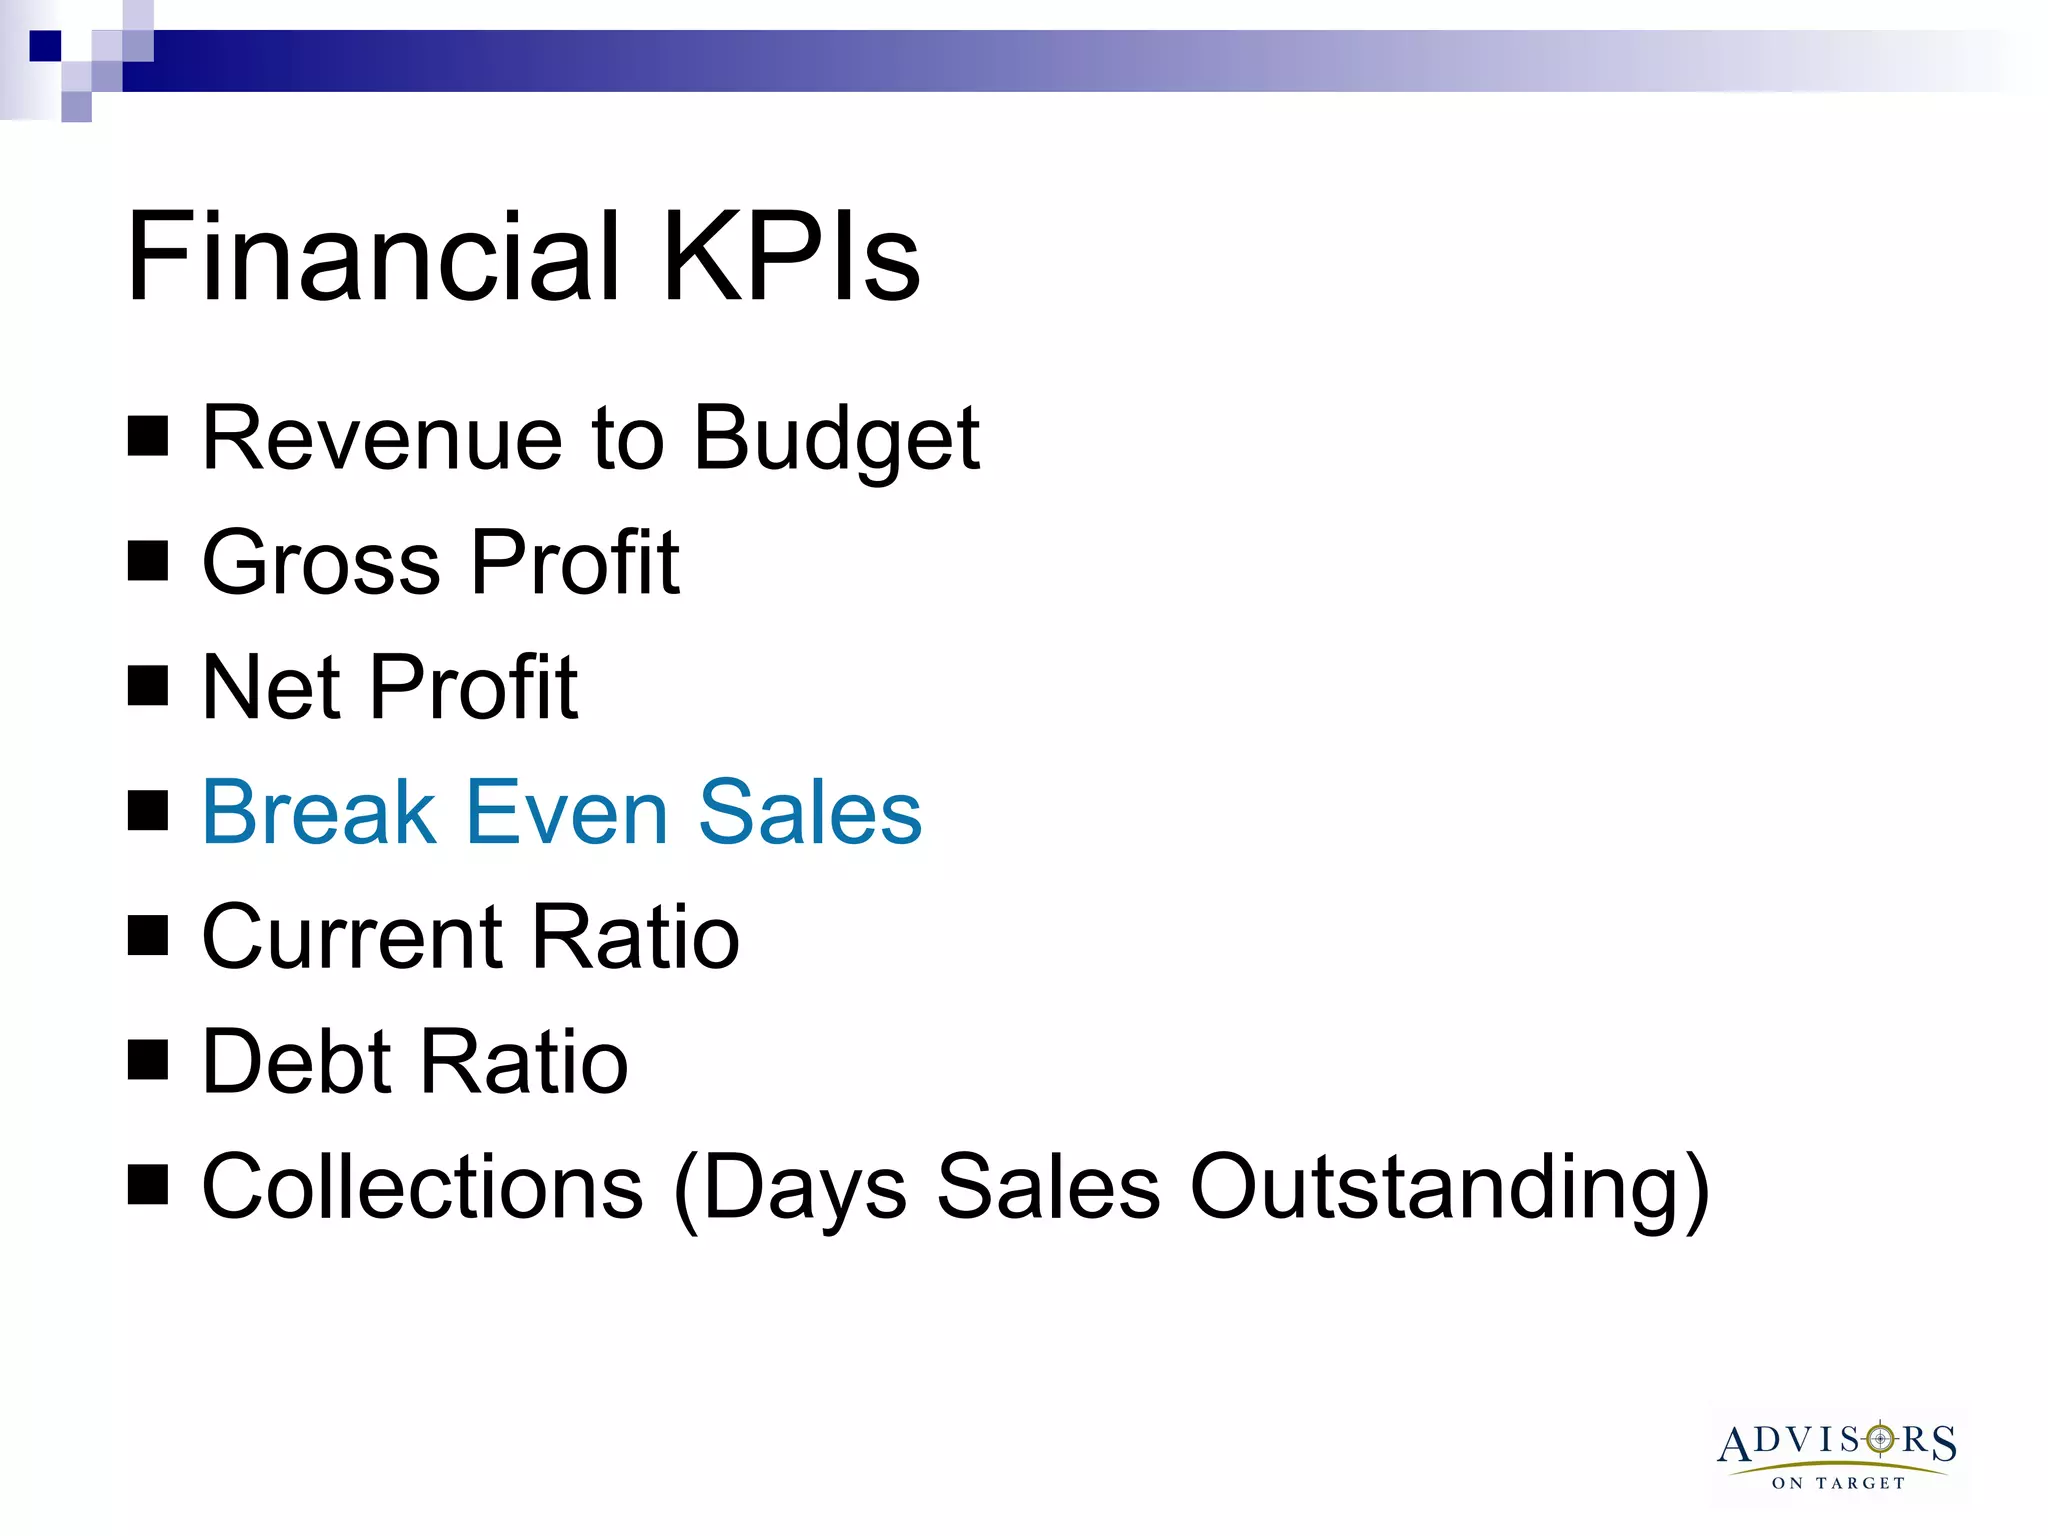
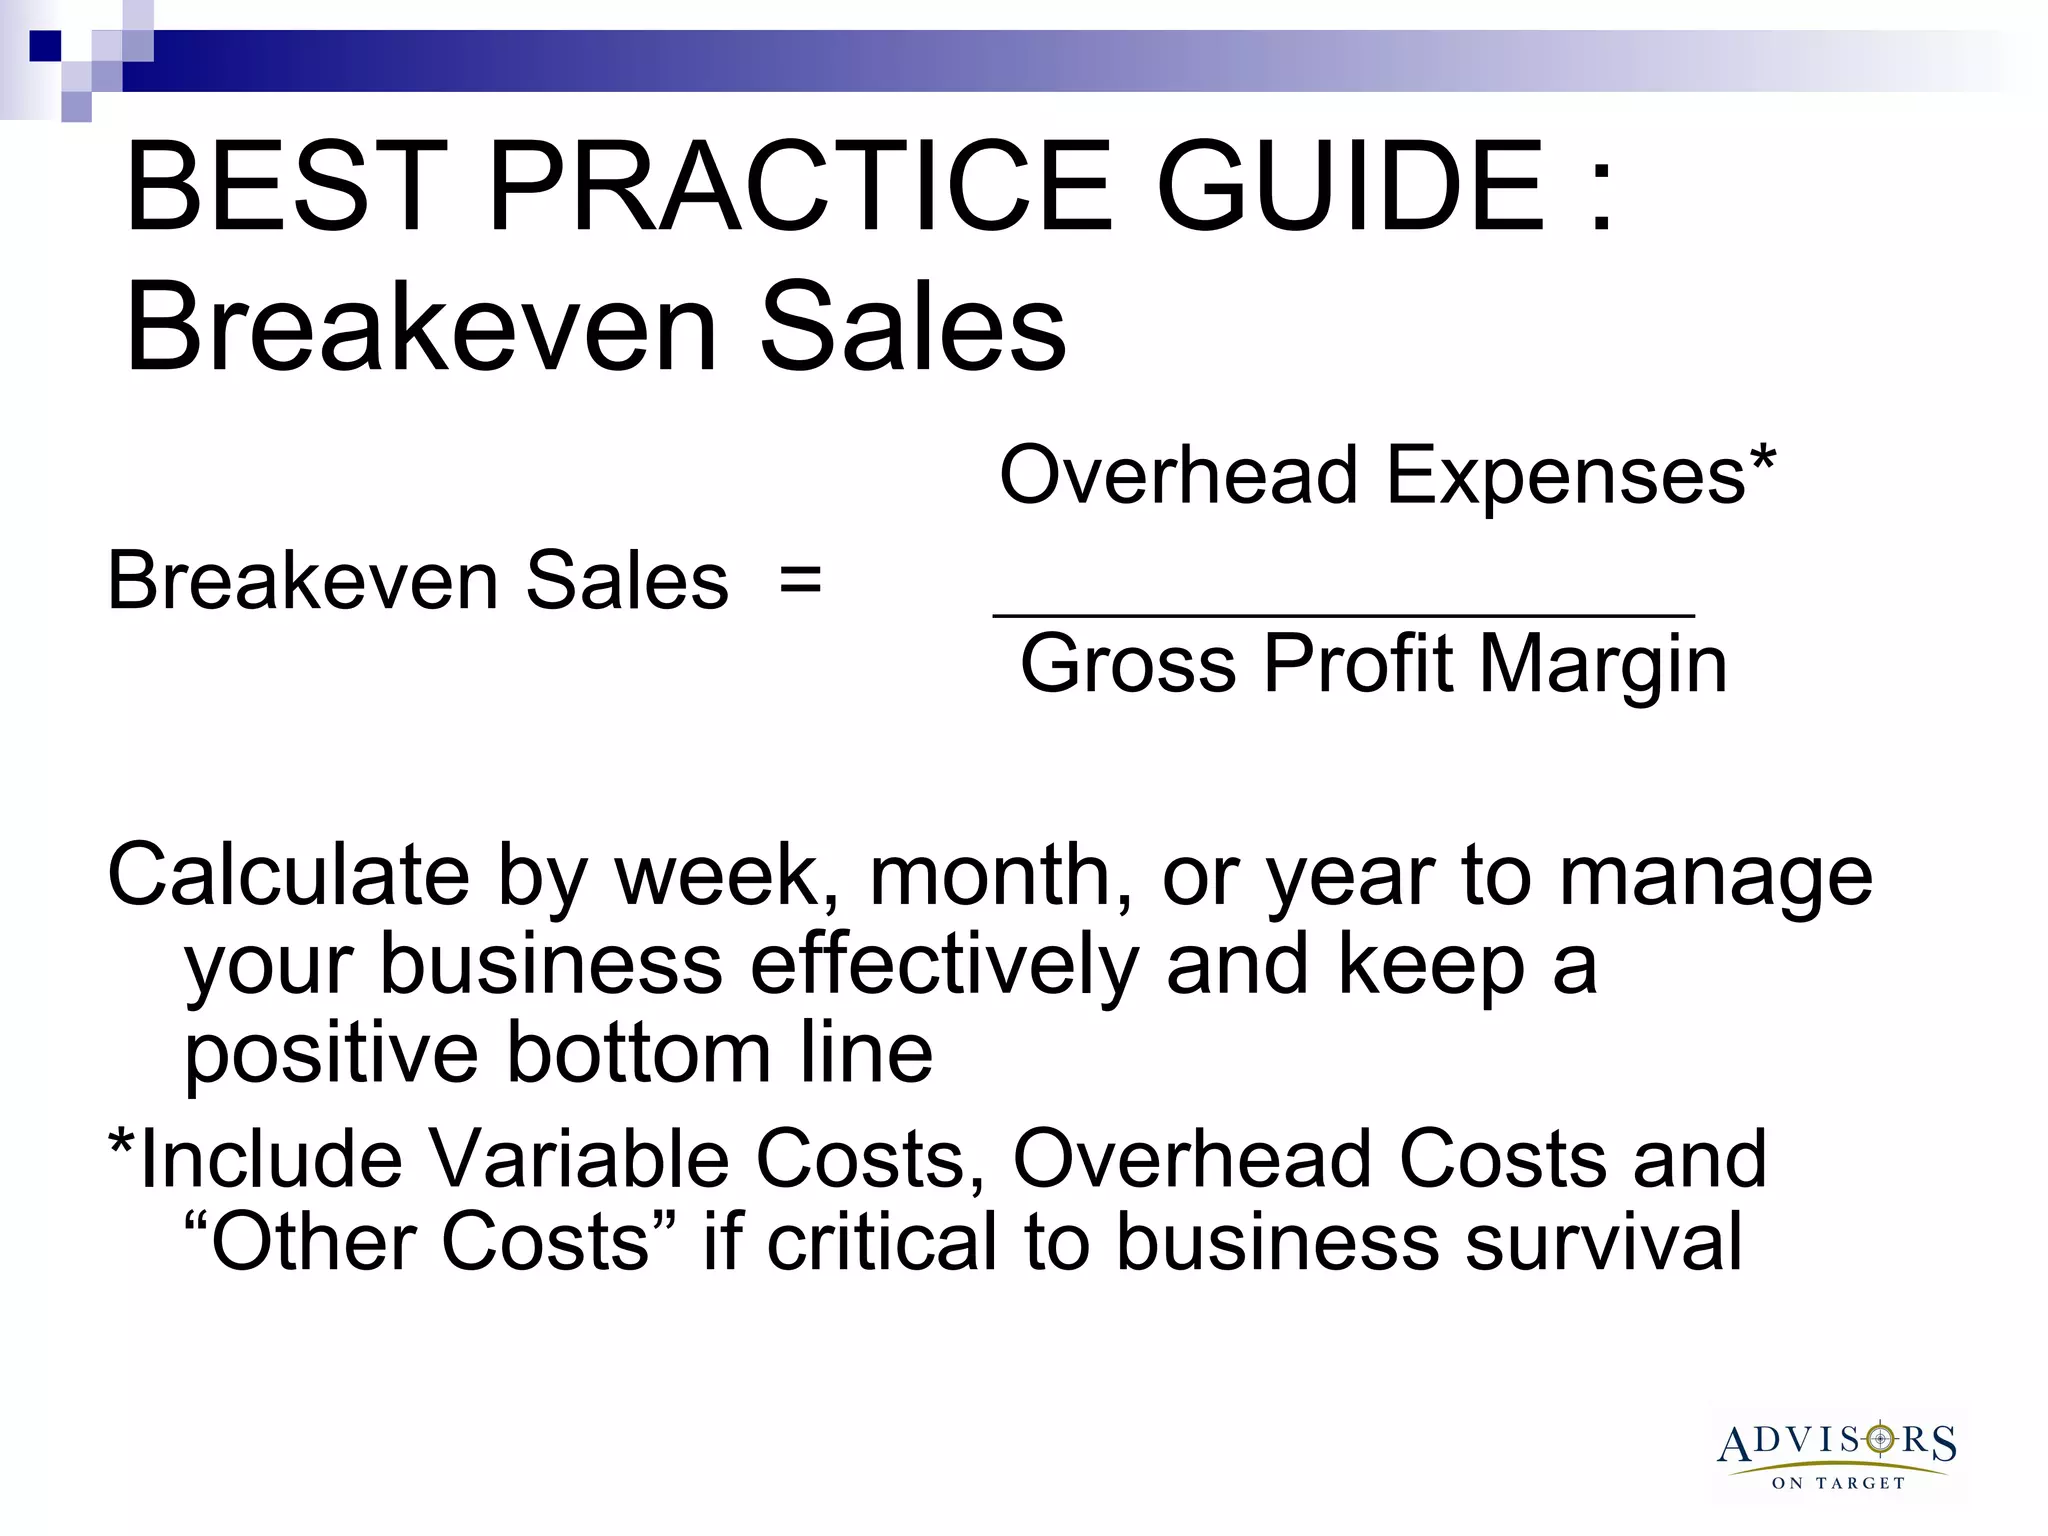
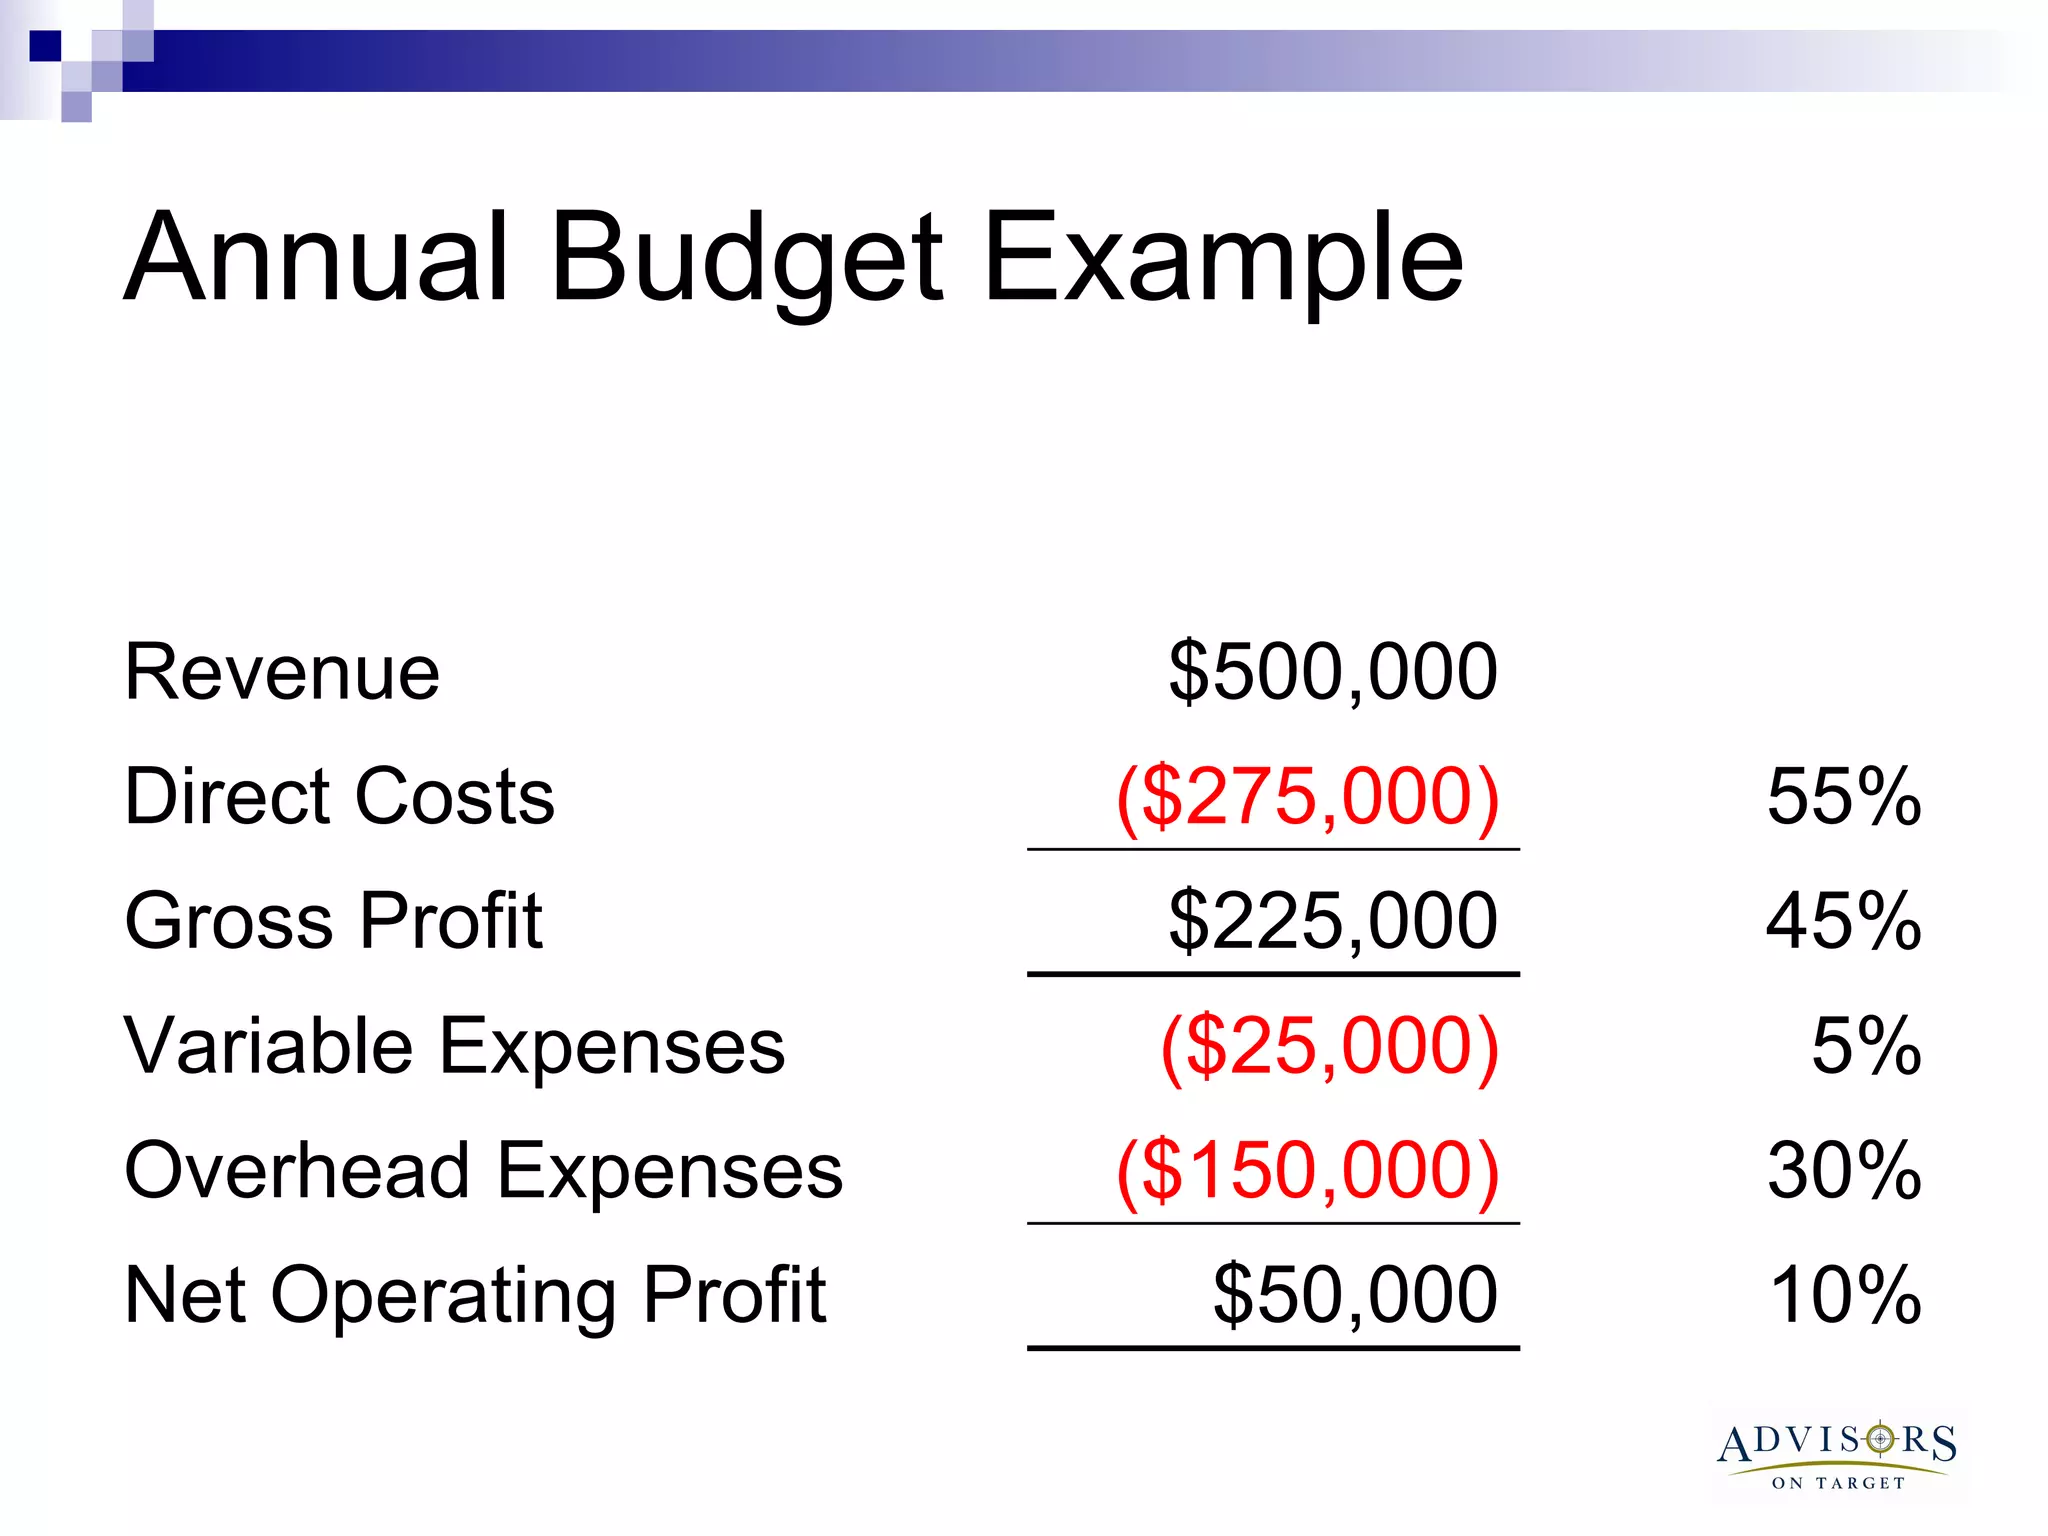
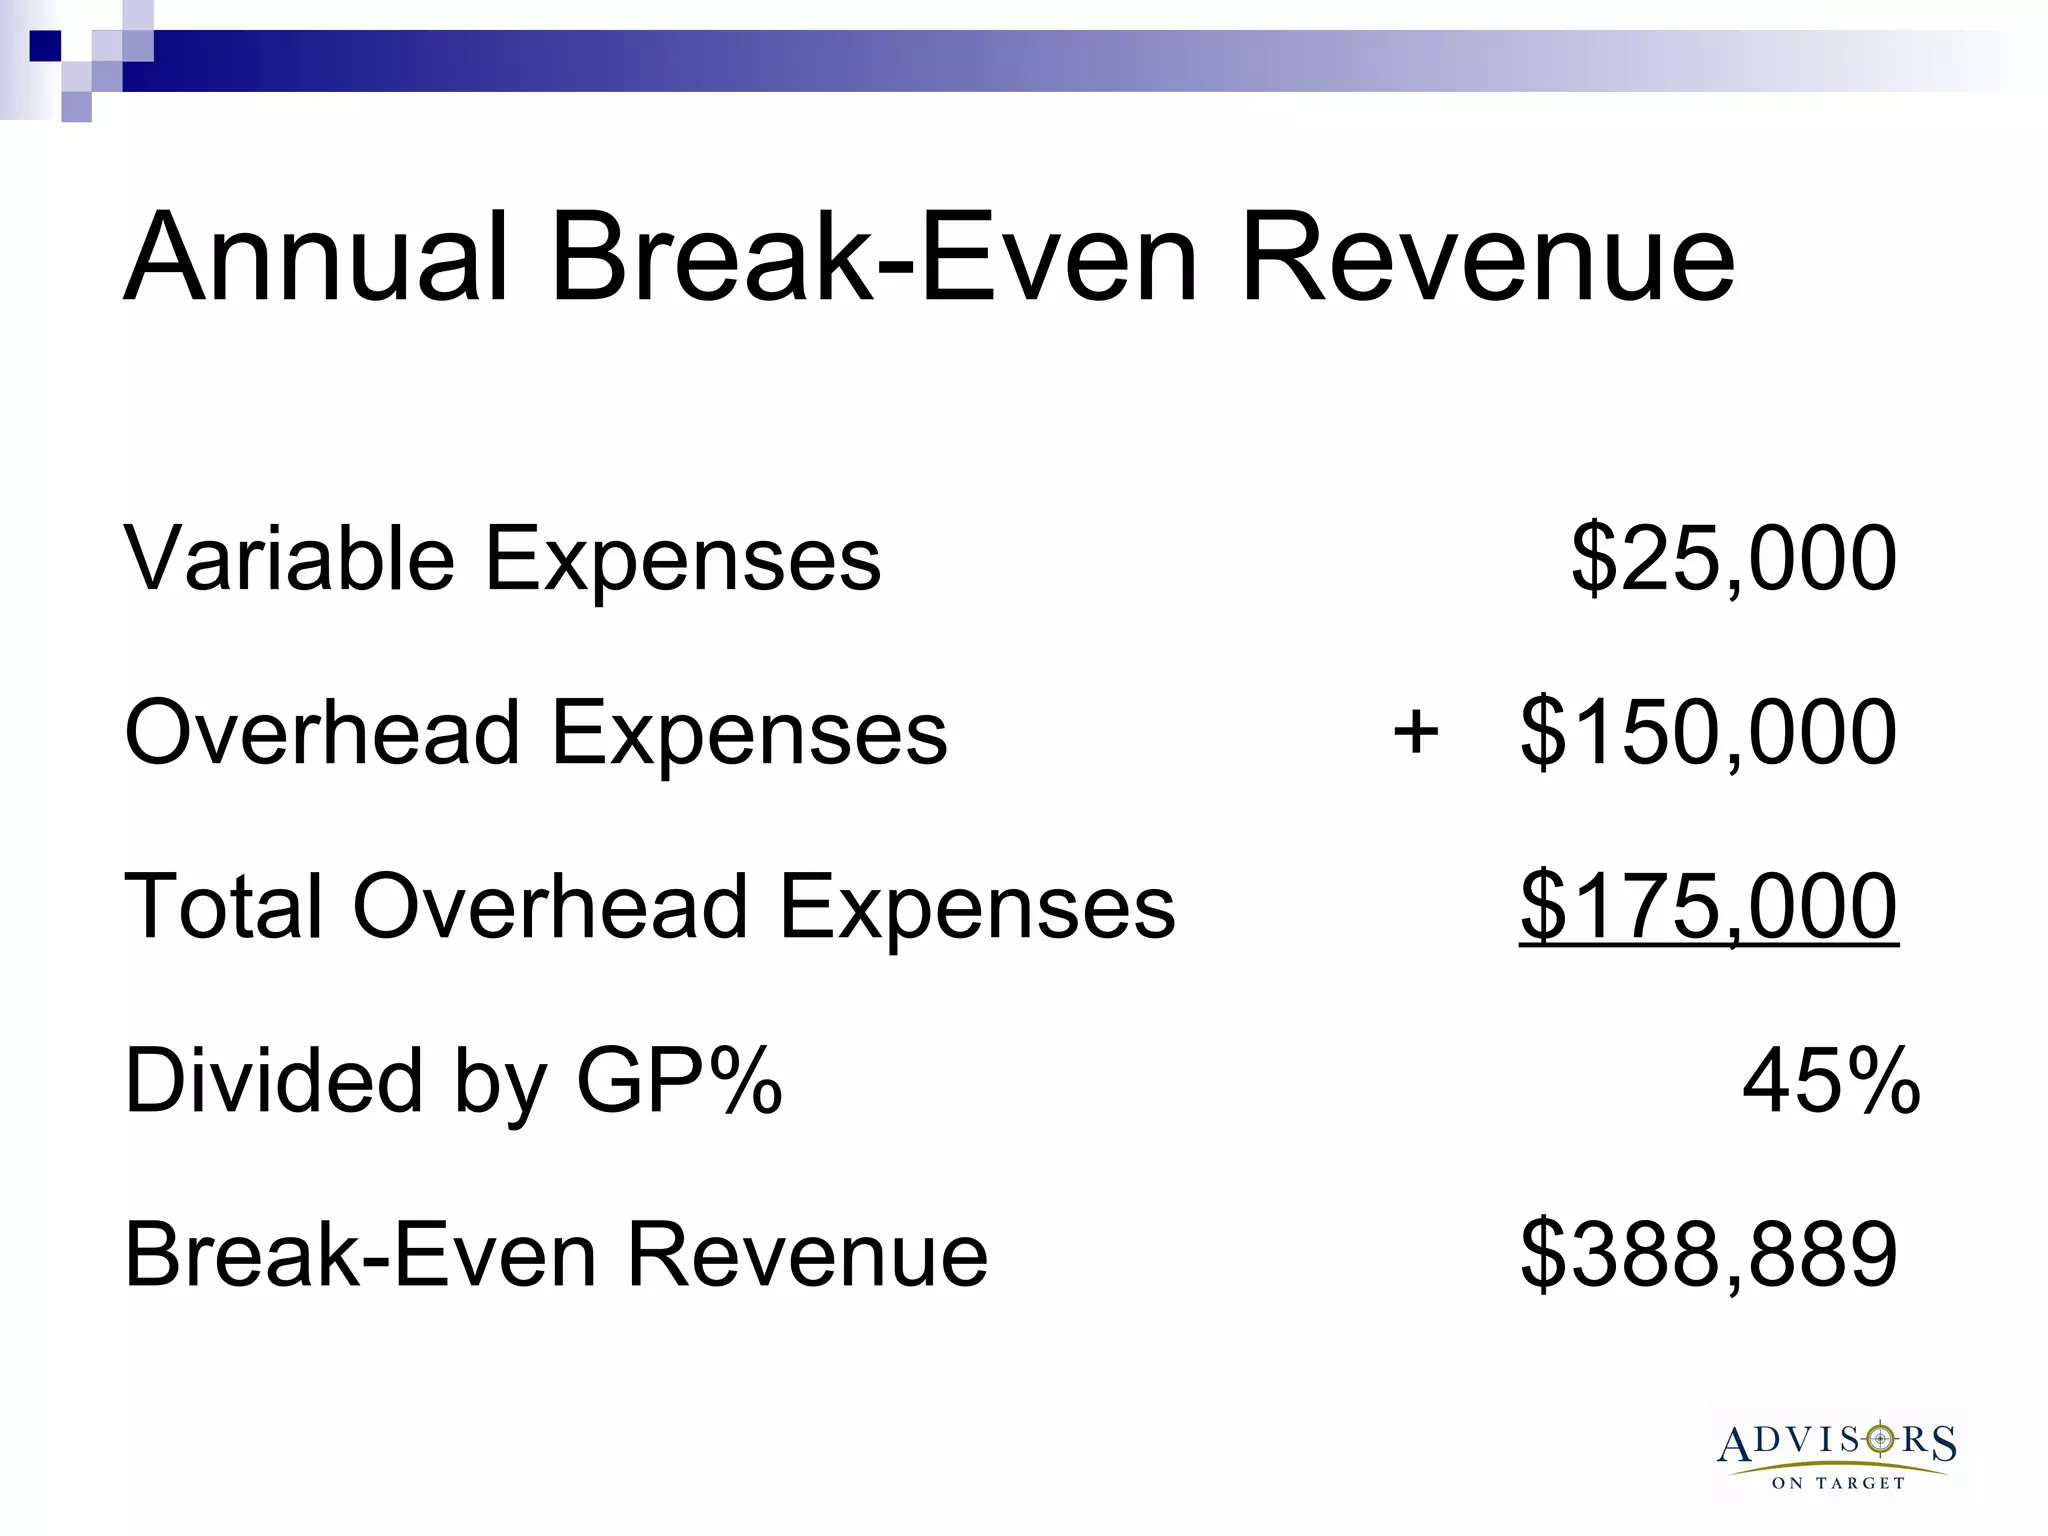
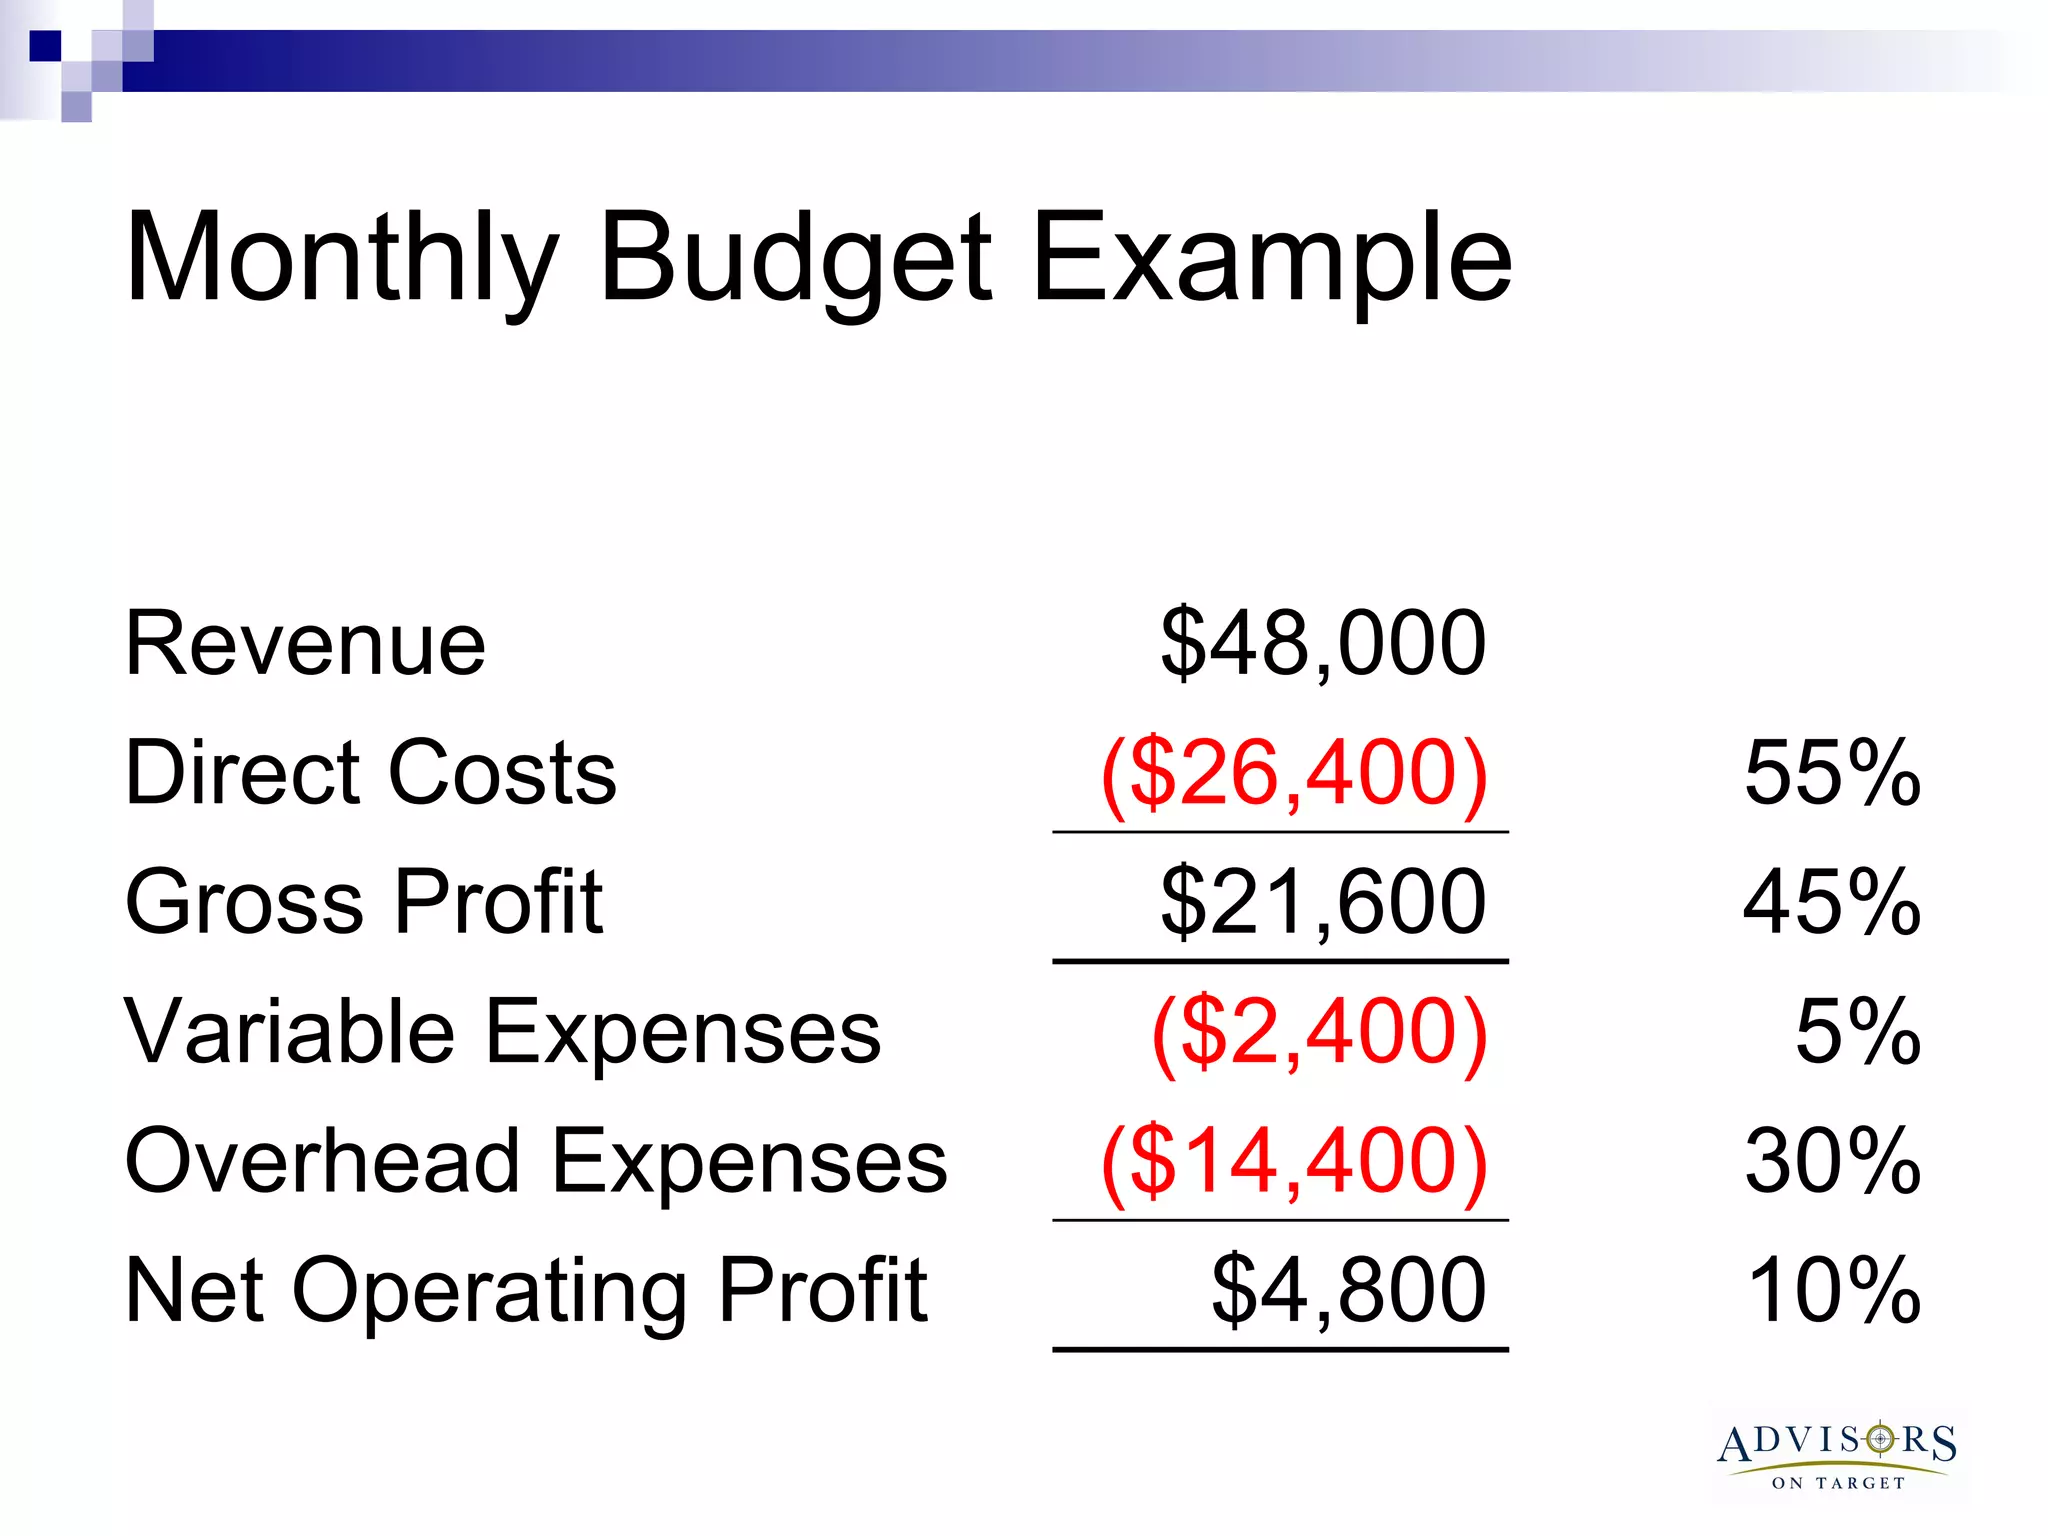
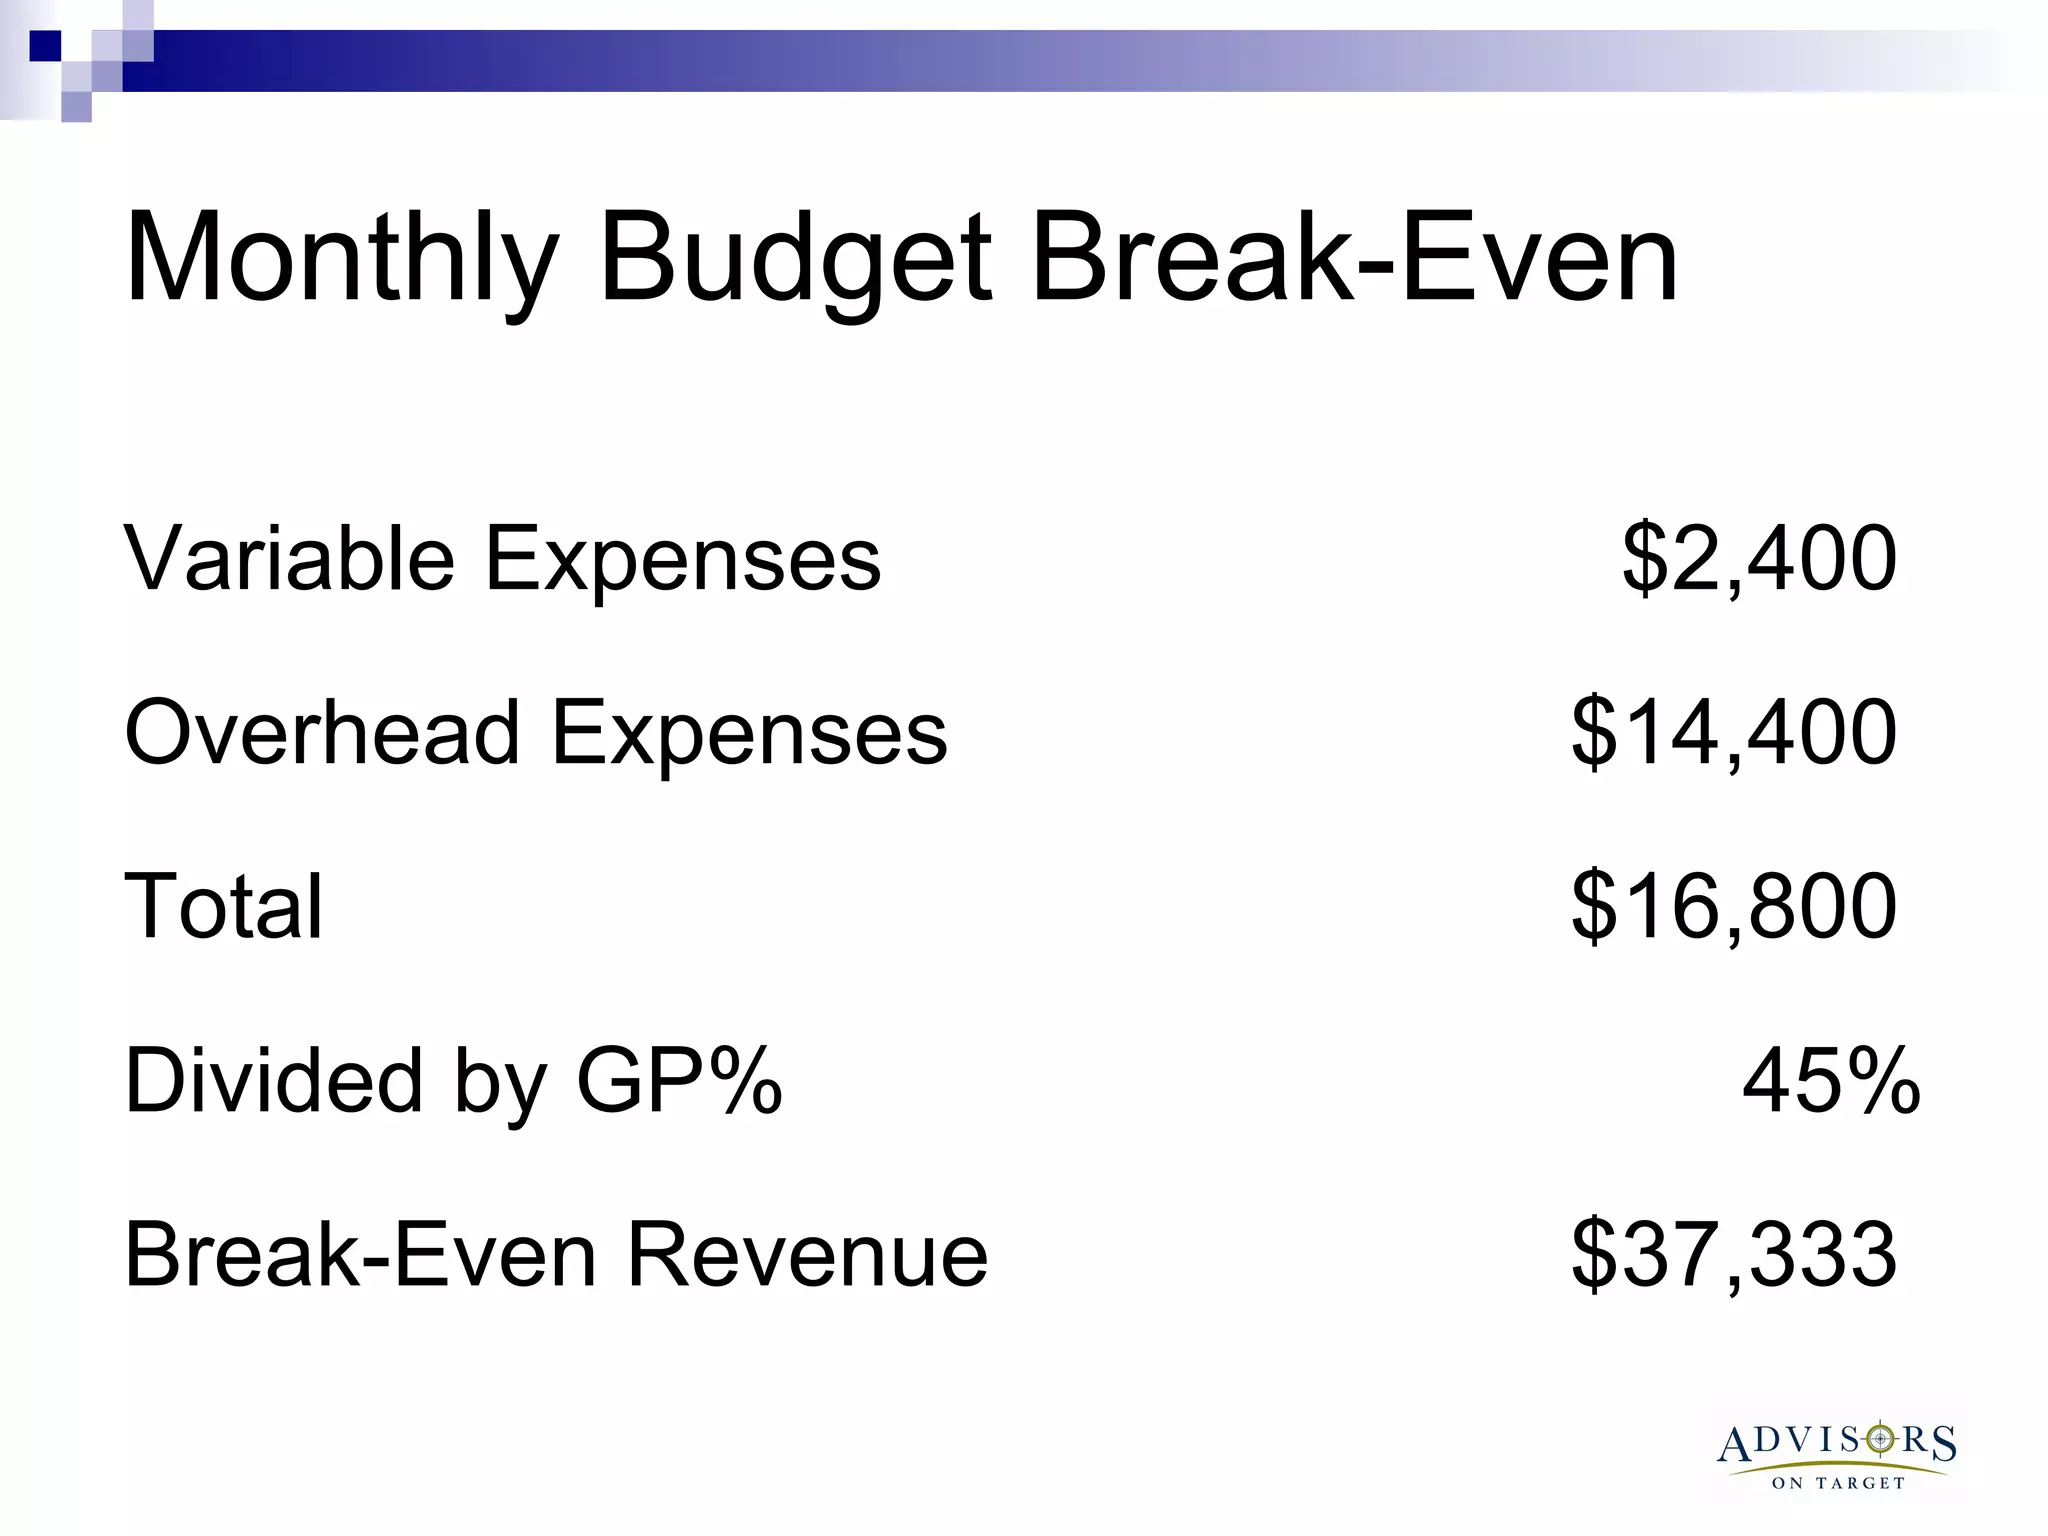
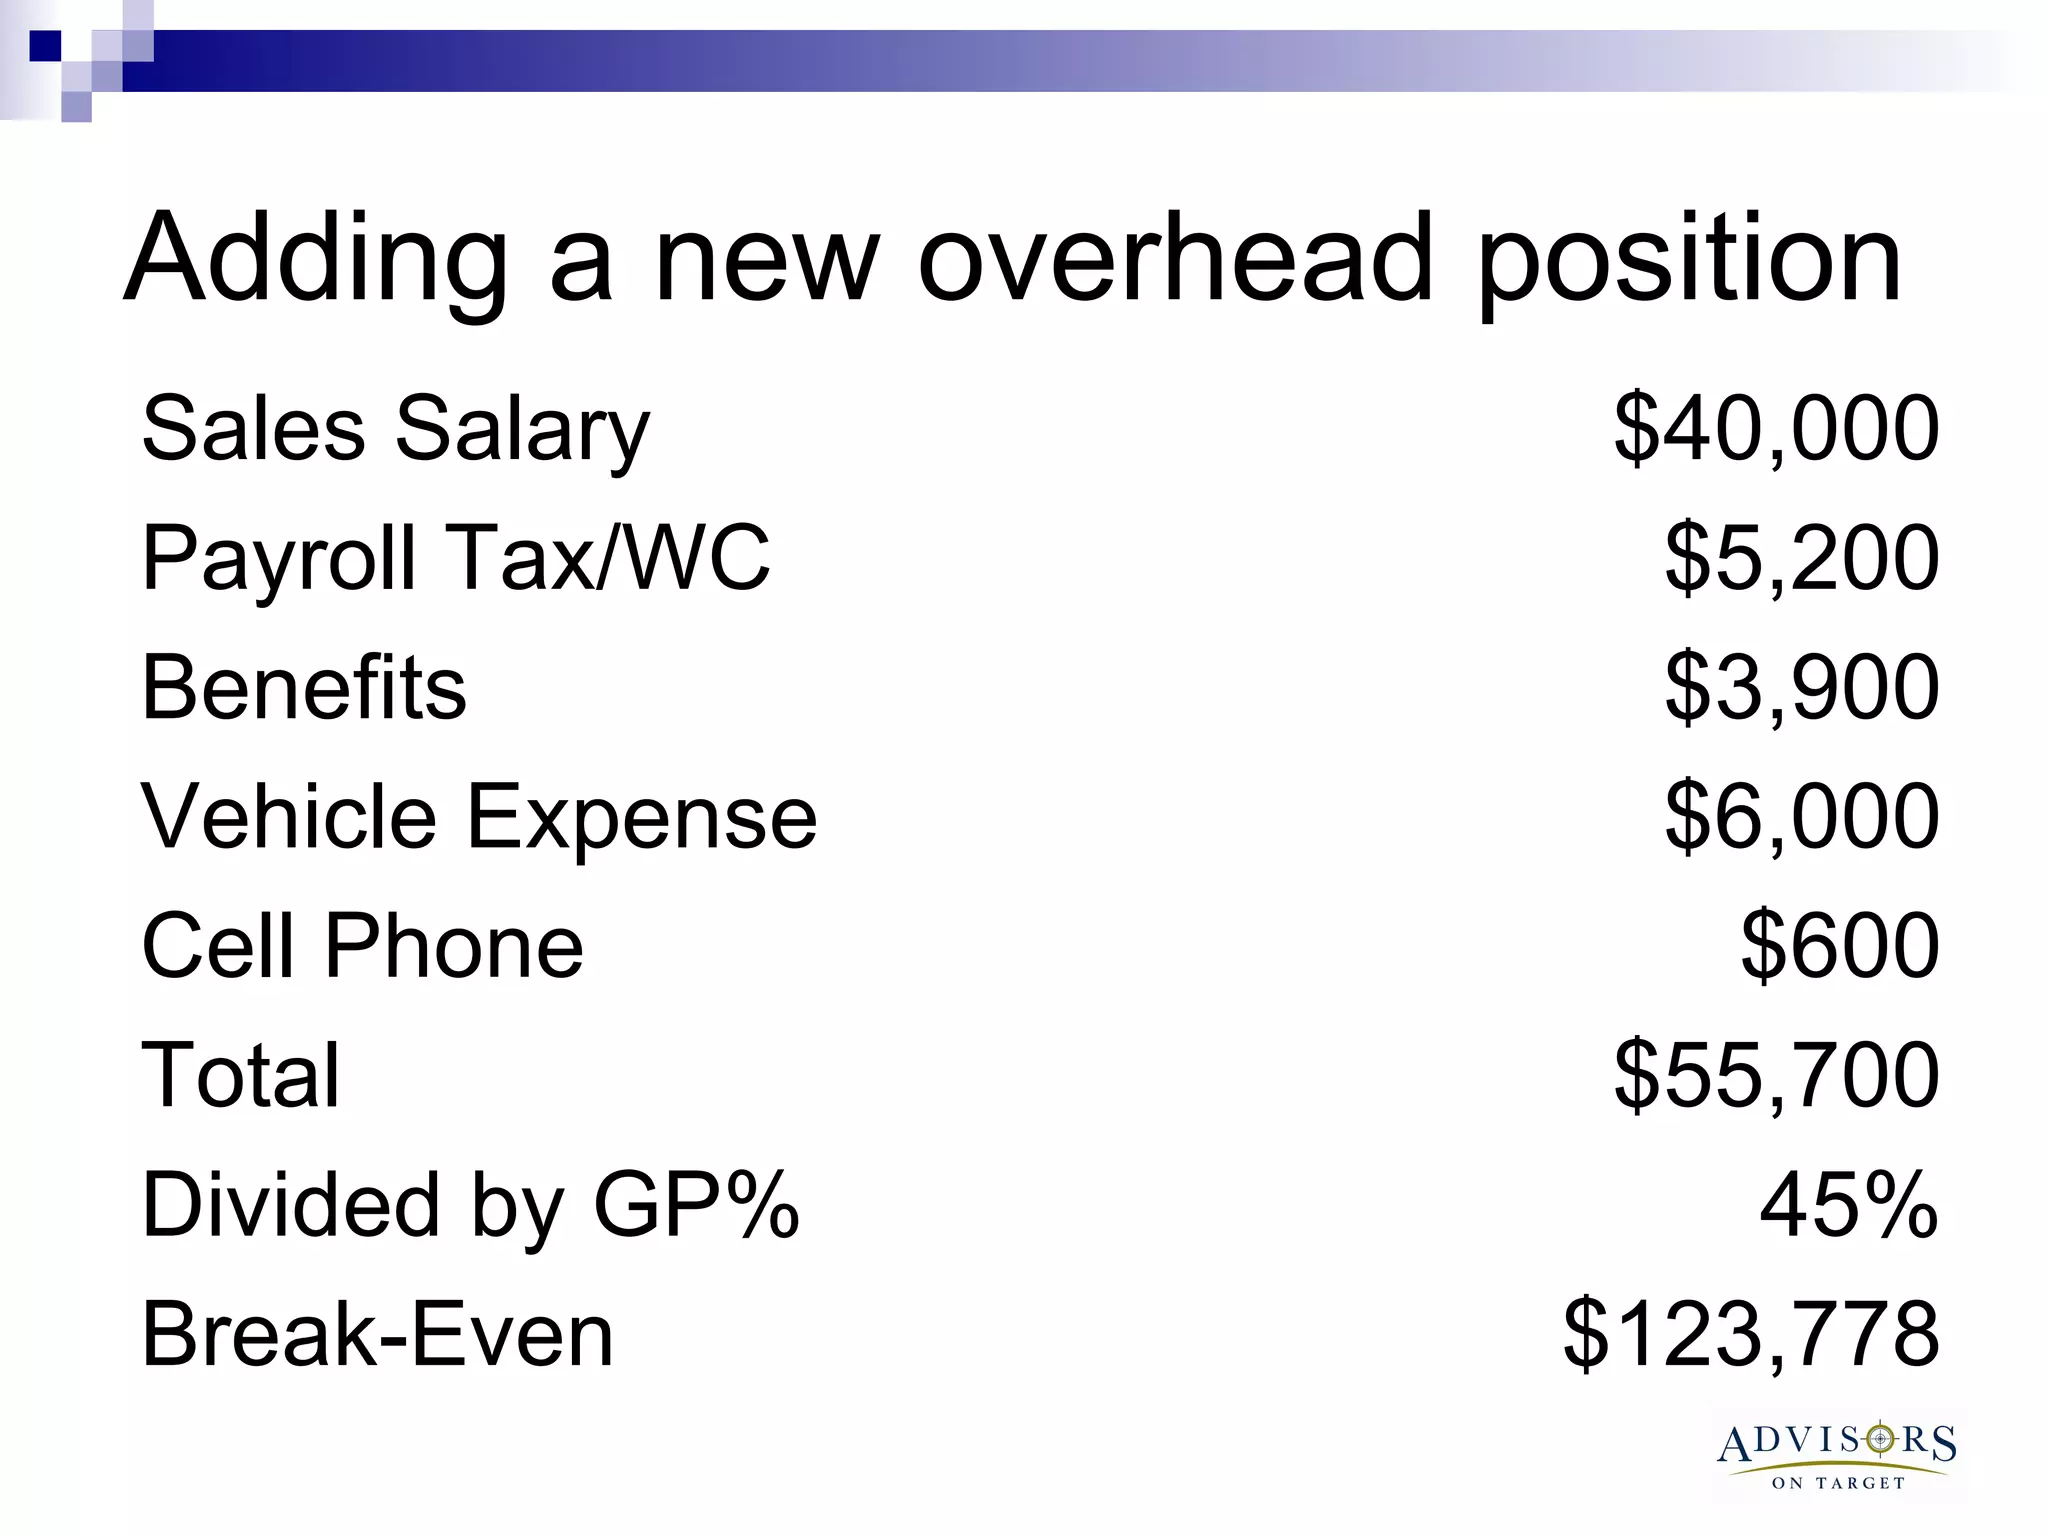
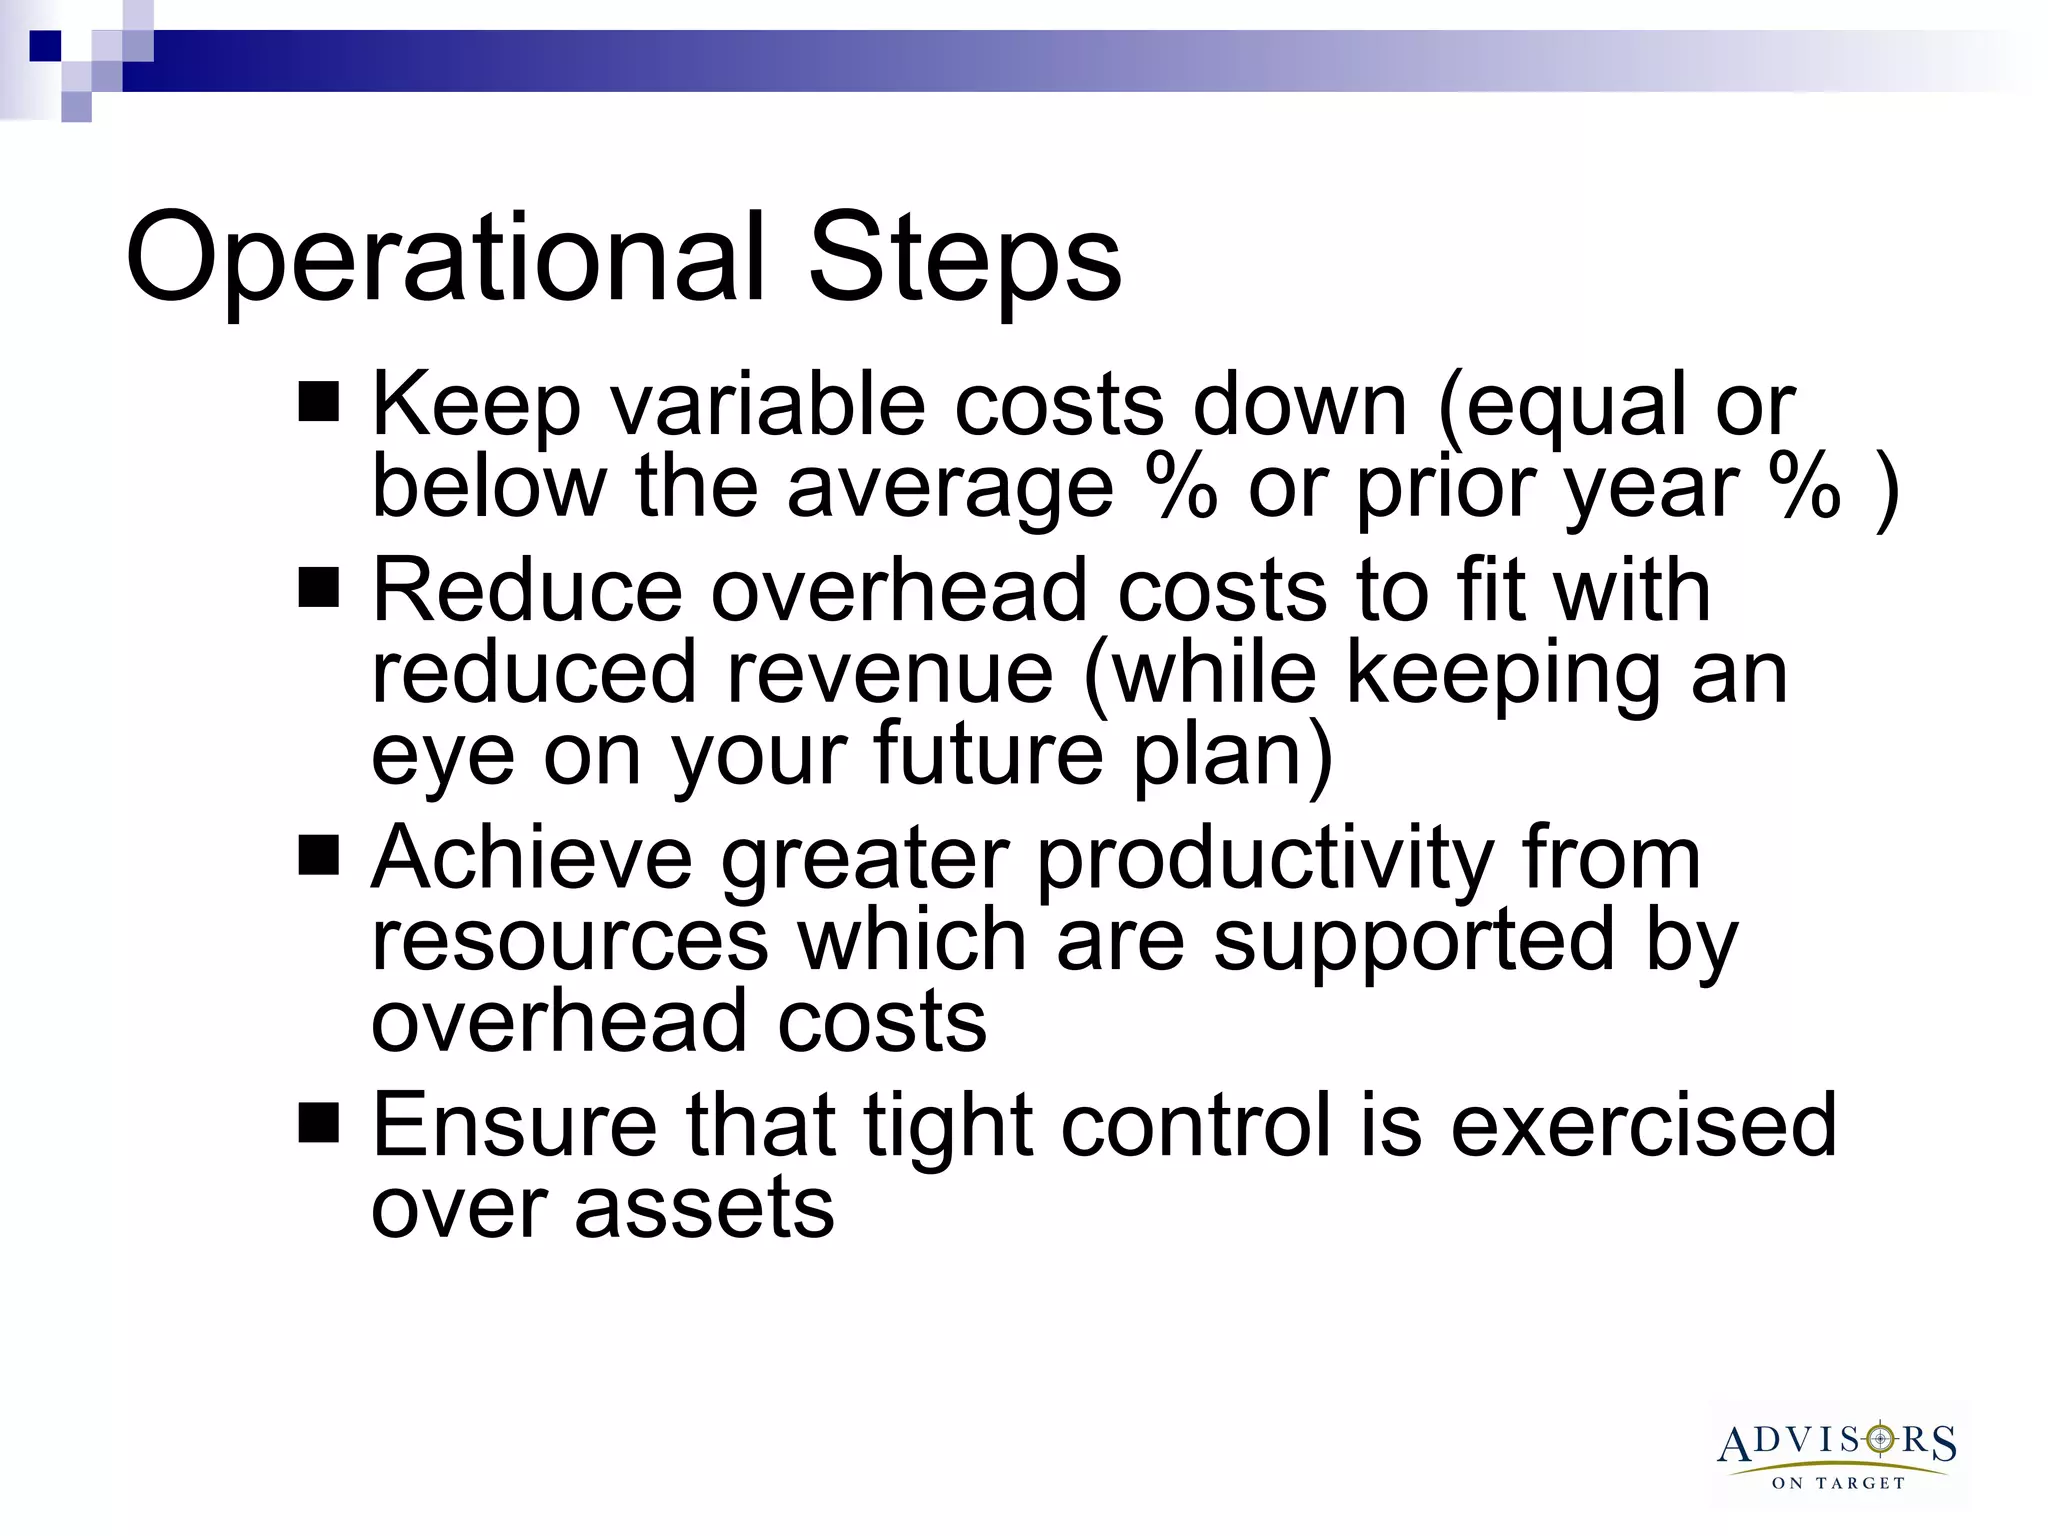
The document discusses the importance of contractors understanding their break-even point and how to calculate it. It provides examples of annual and monthly budgets, showing how to determine break-even revenue, sales, and hours. It also discusses how changing variables like overhead costs, gross profit margins, or adding new expenses can impact break-even levels. The document recommends contractors regularly monitor their break-even and take action if they are not hitting monthly targets.


![Ent ppt[1]](https://cdn.slidesharecdn.com/ss_thumbnails/entppt1-190502205922-thumbnail.jpg?width=640&height=640&fit=bounds)
![Ent ppt[1]](https://cdn.slidesharecdn.com/ss_thumbnails/entppt1-190502210300-thumbnail.jpg?width=640&height=640&fit=bounds)


