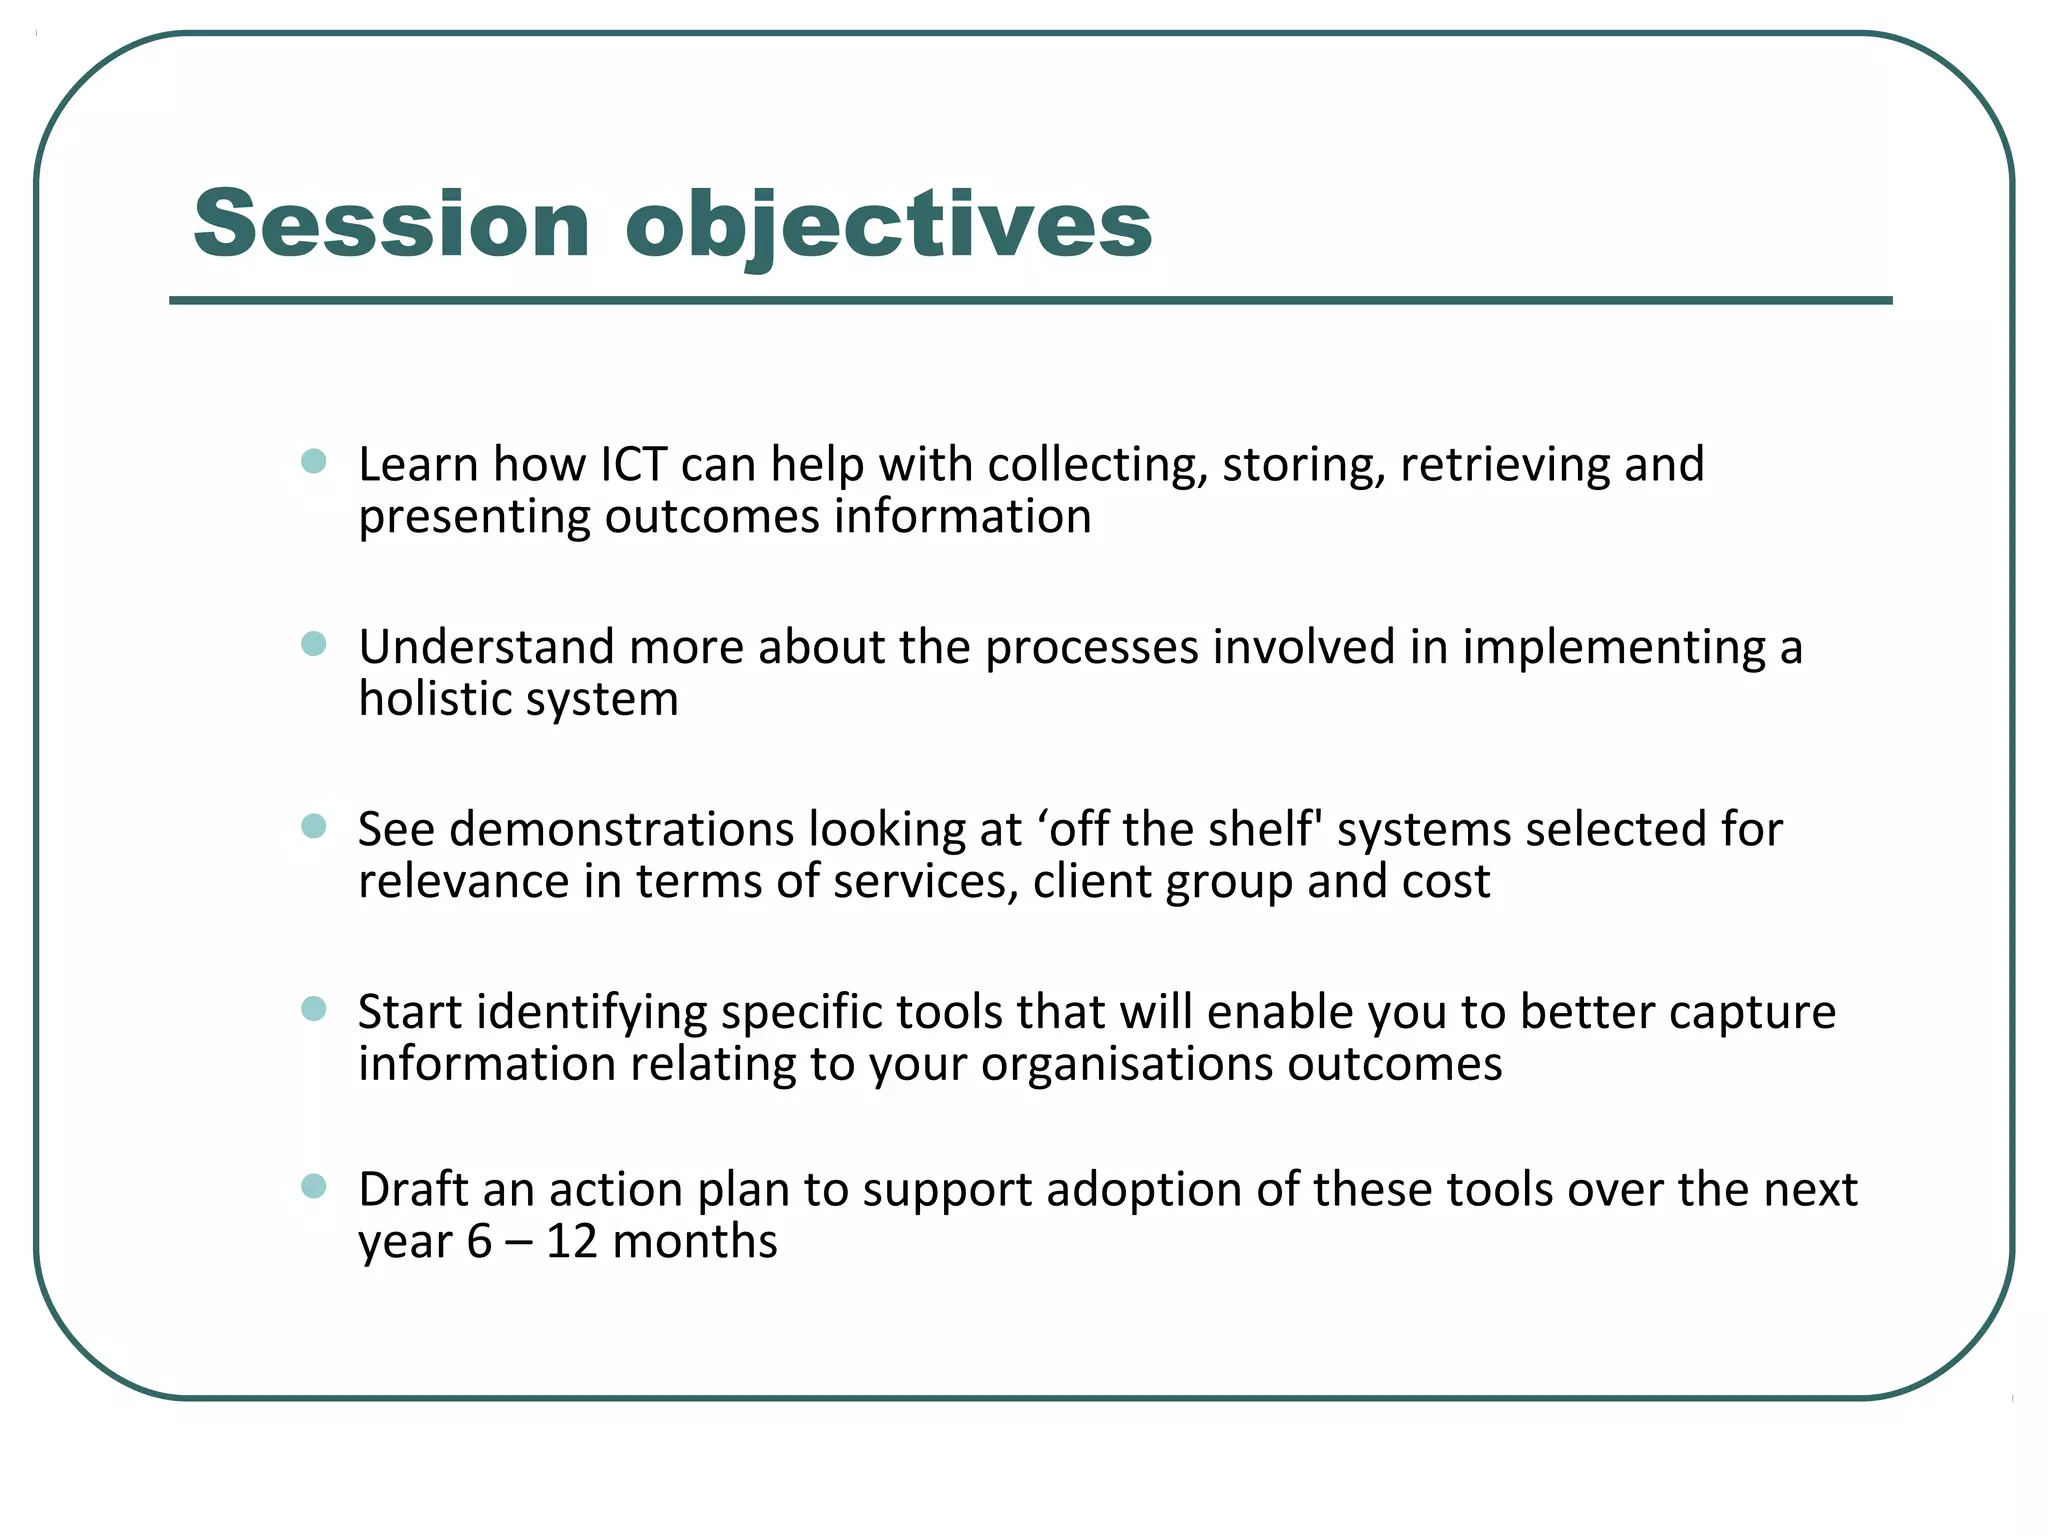
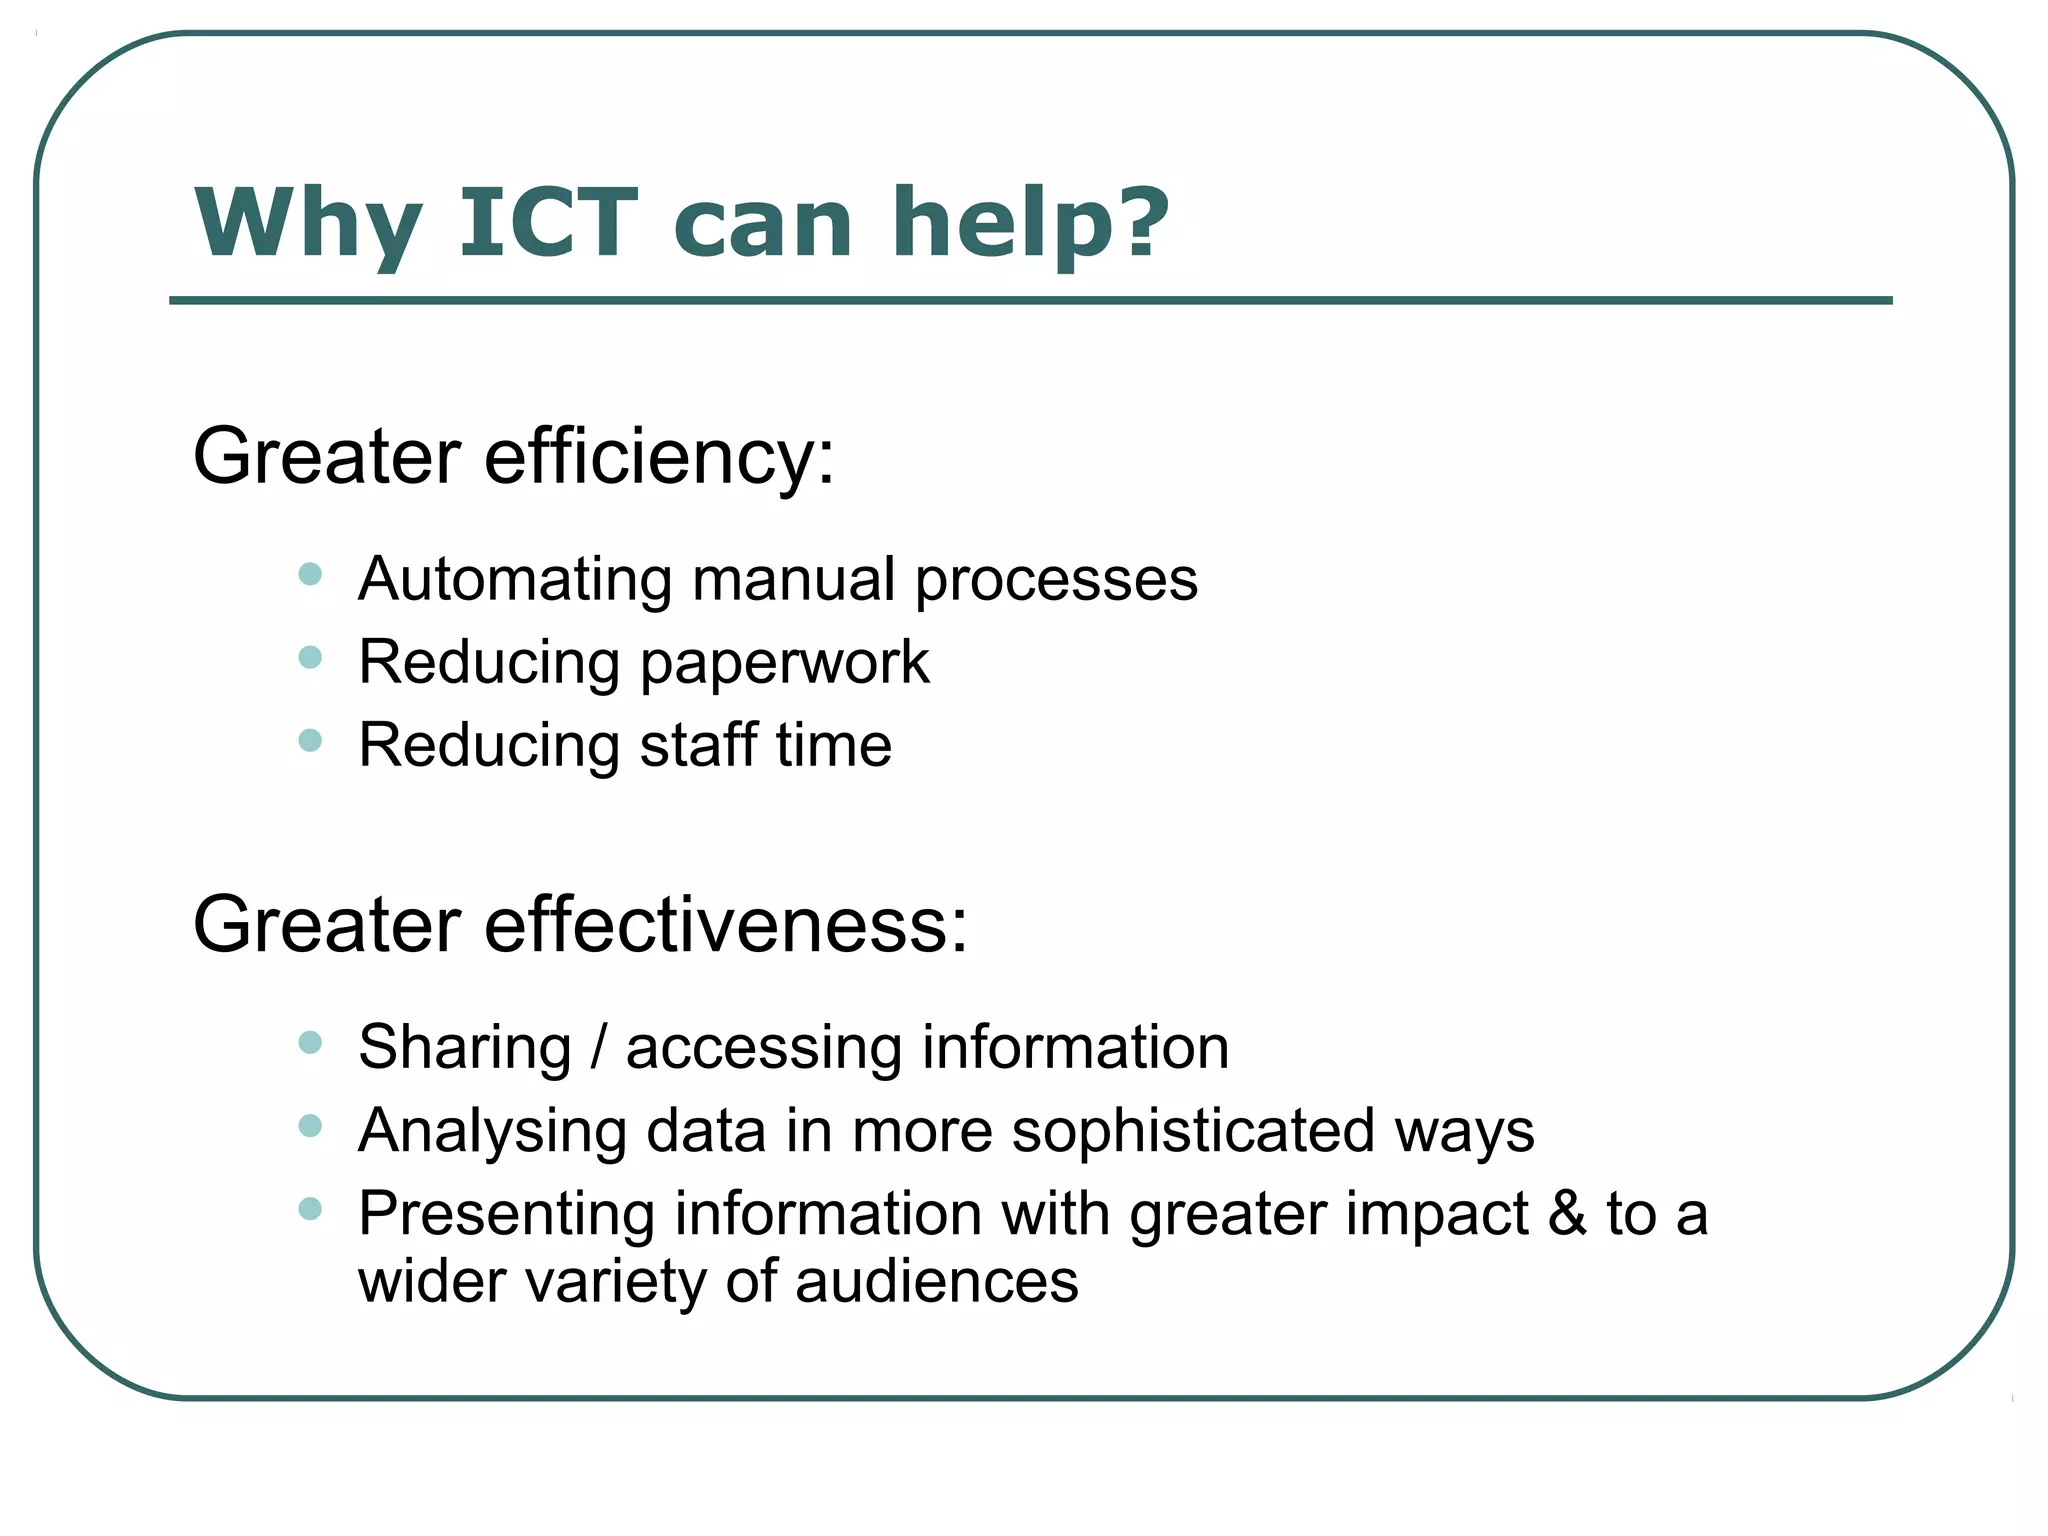
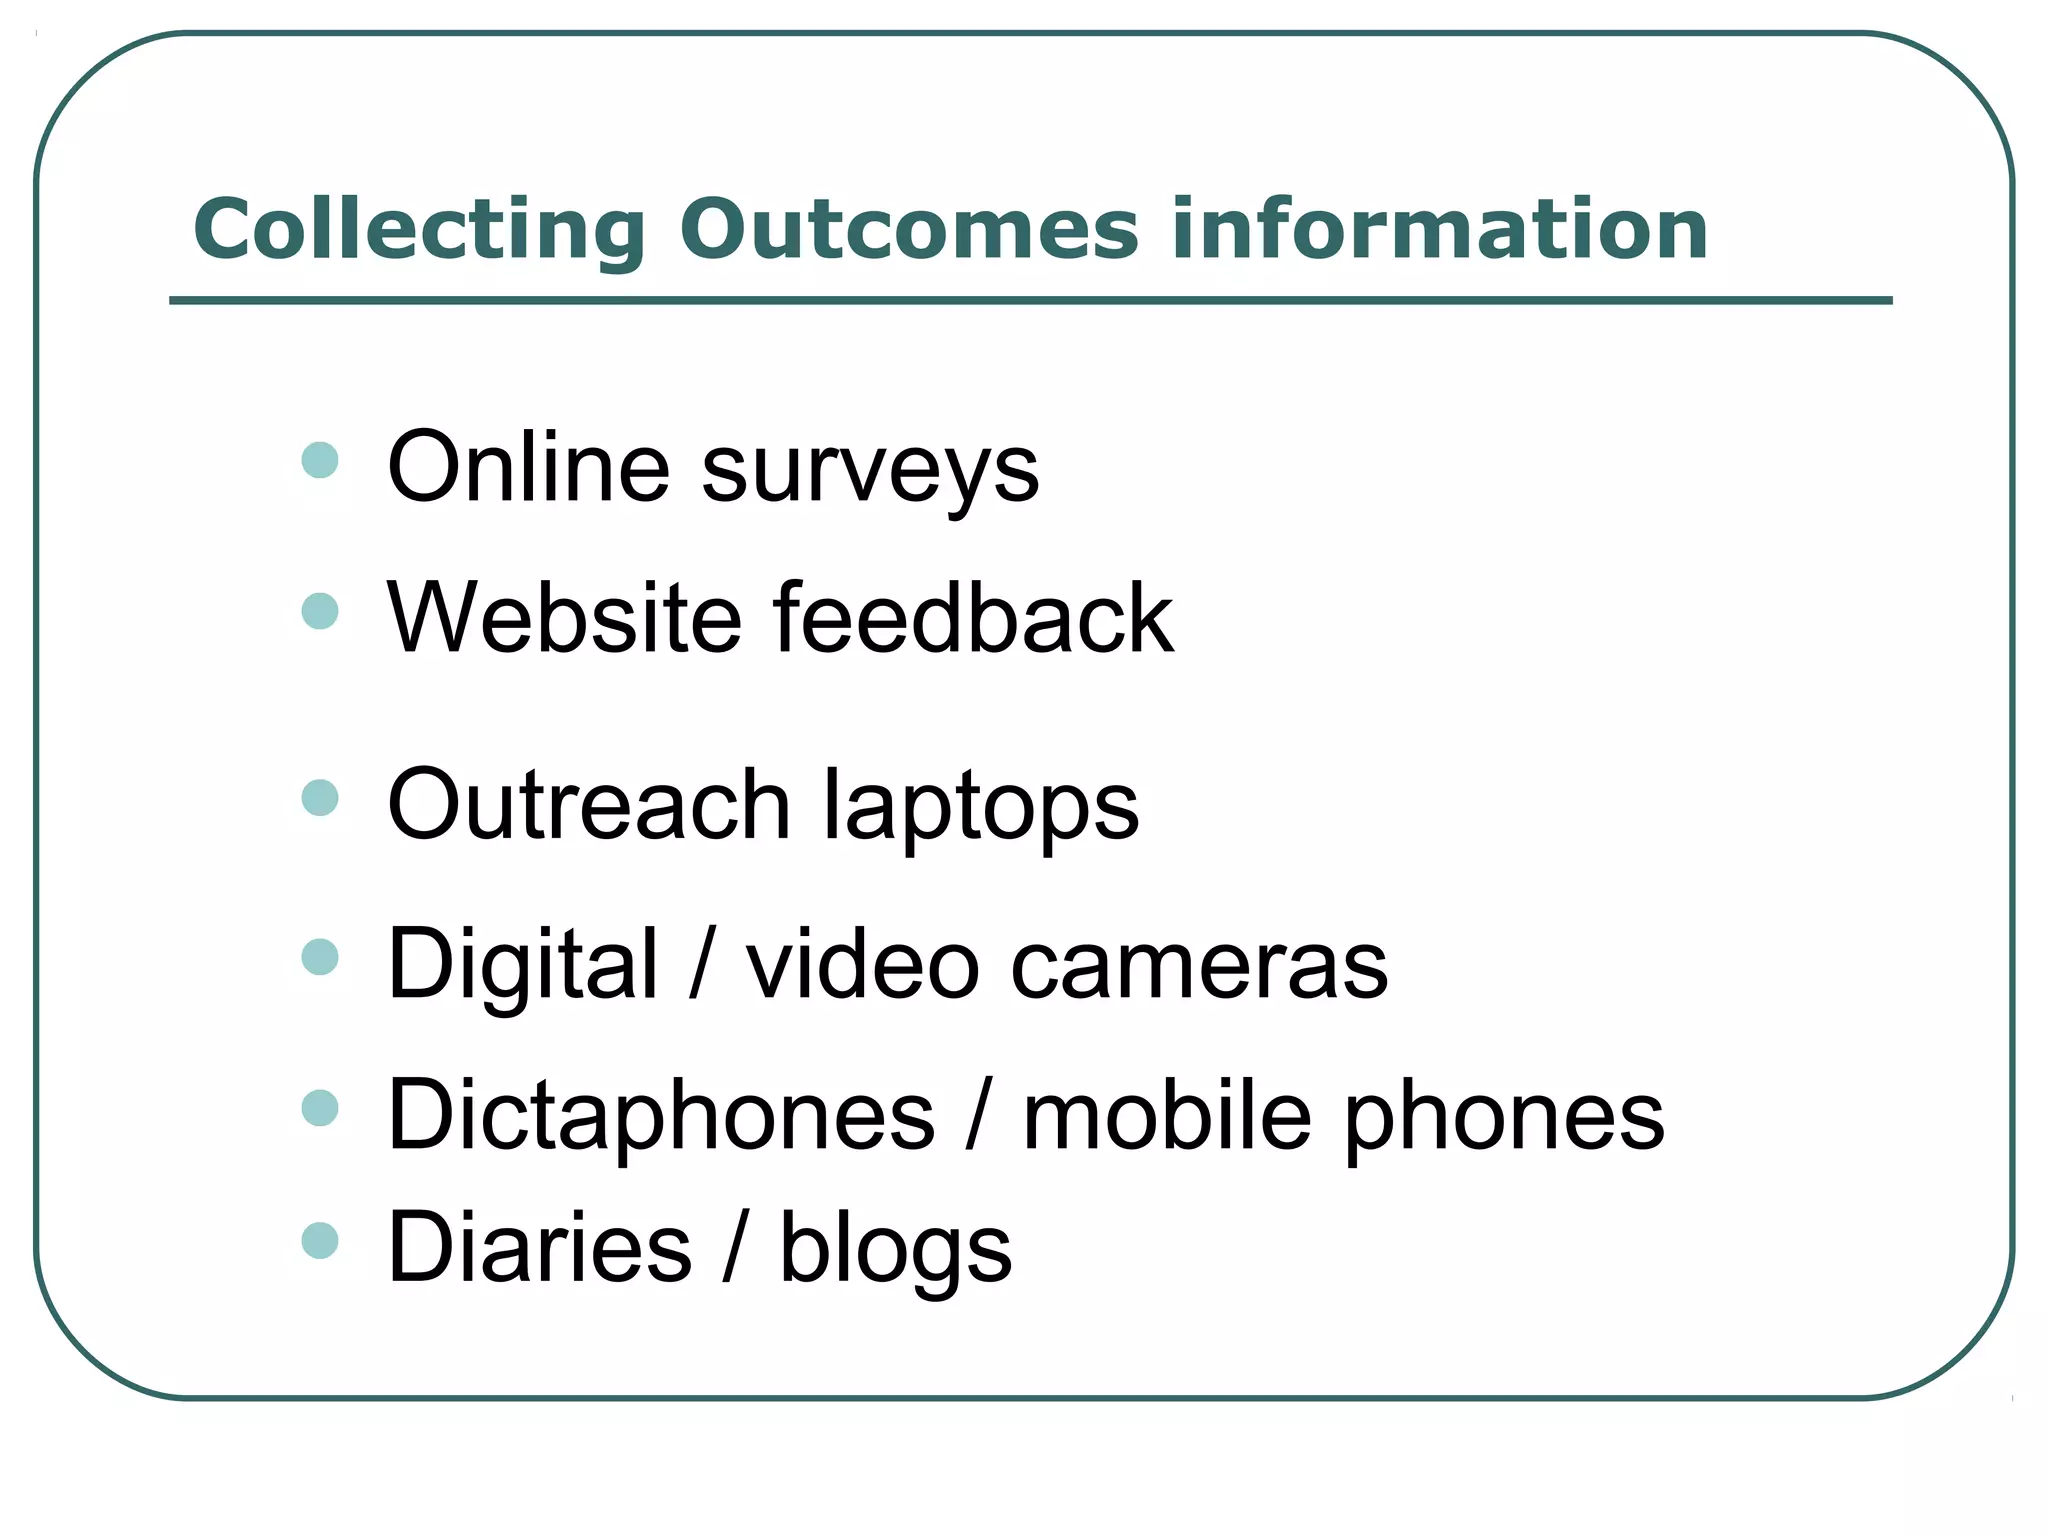
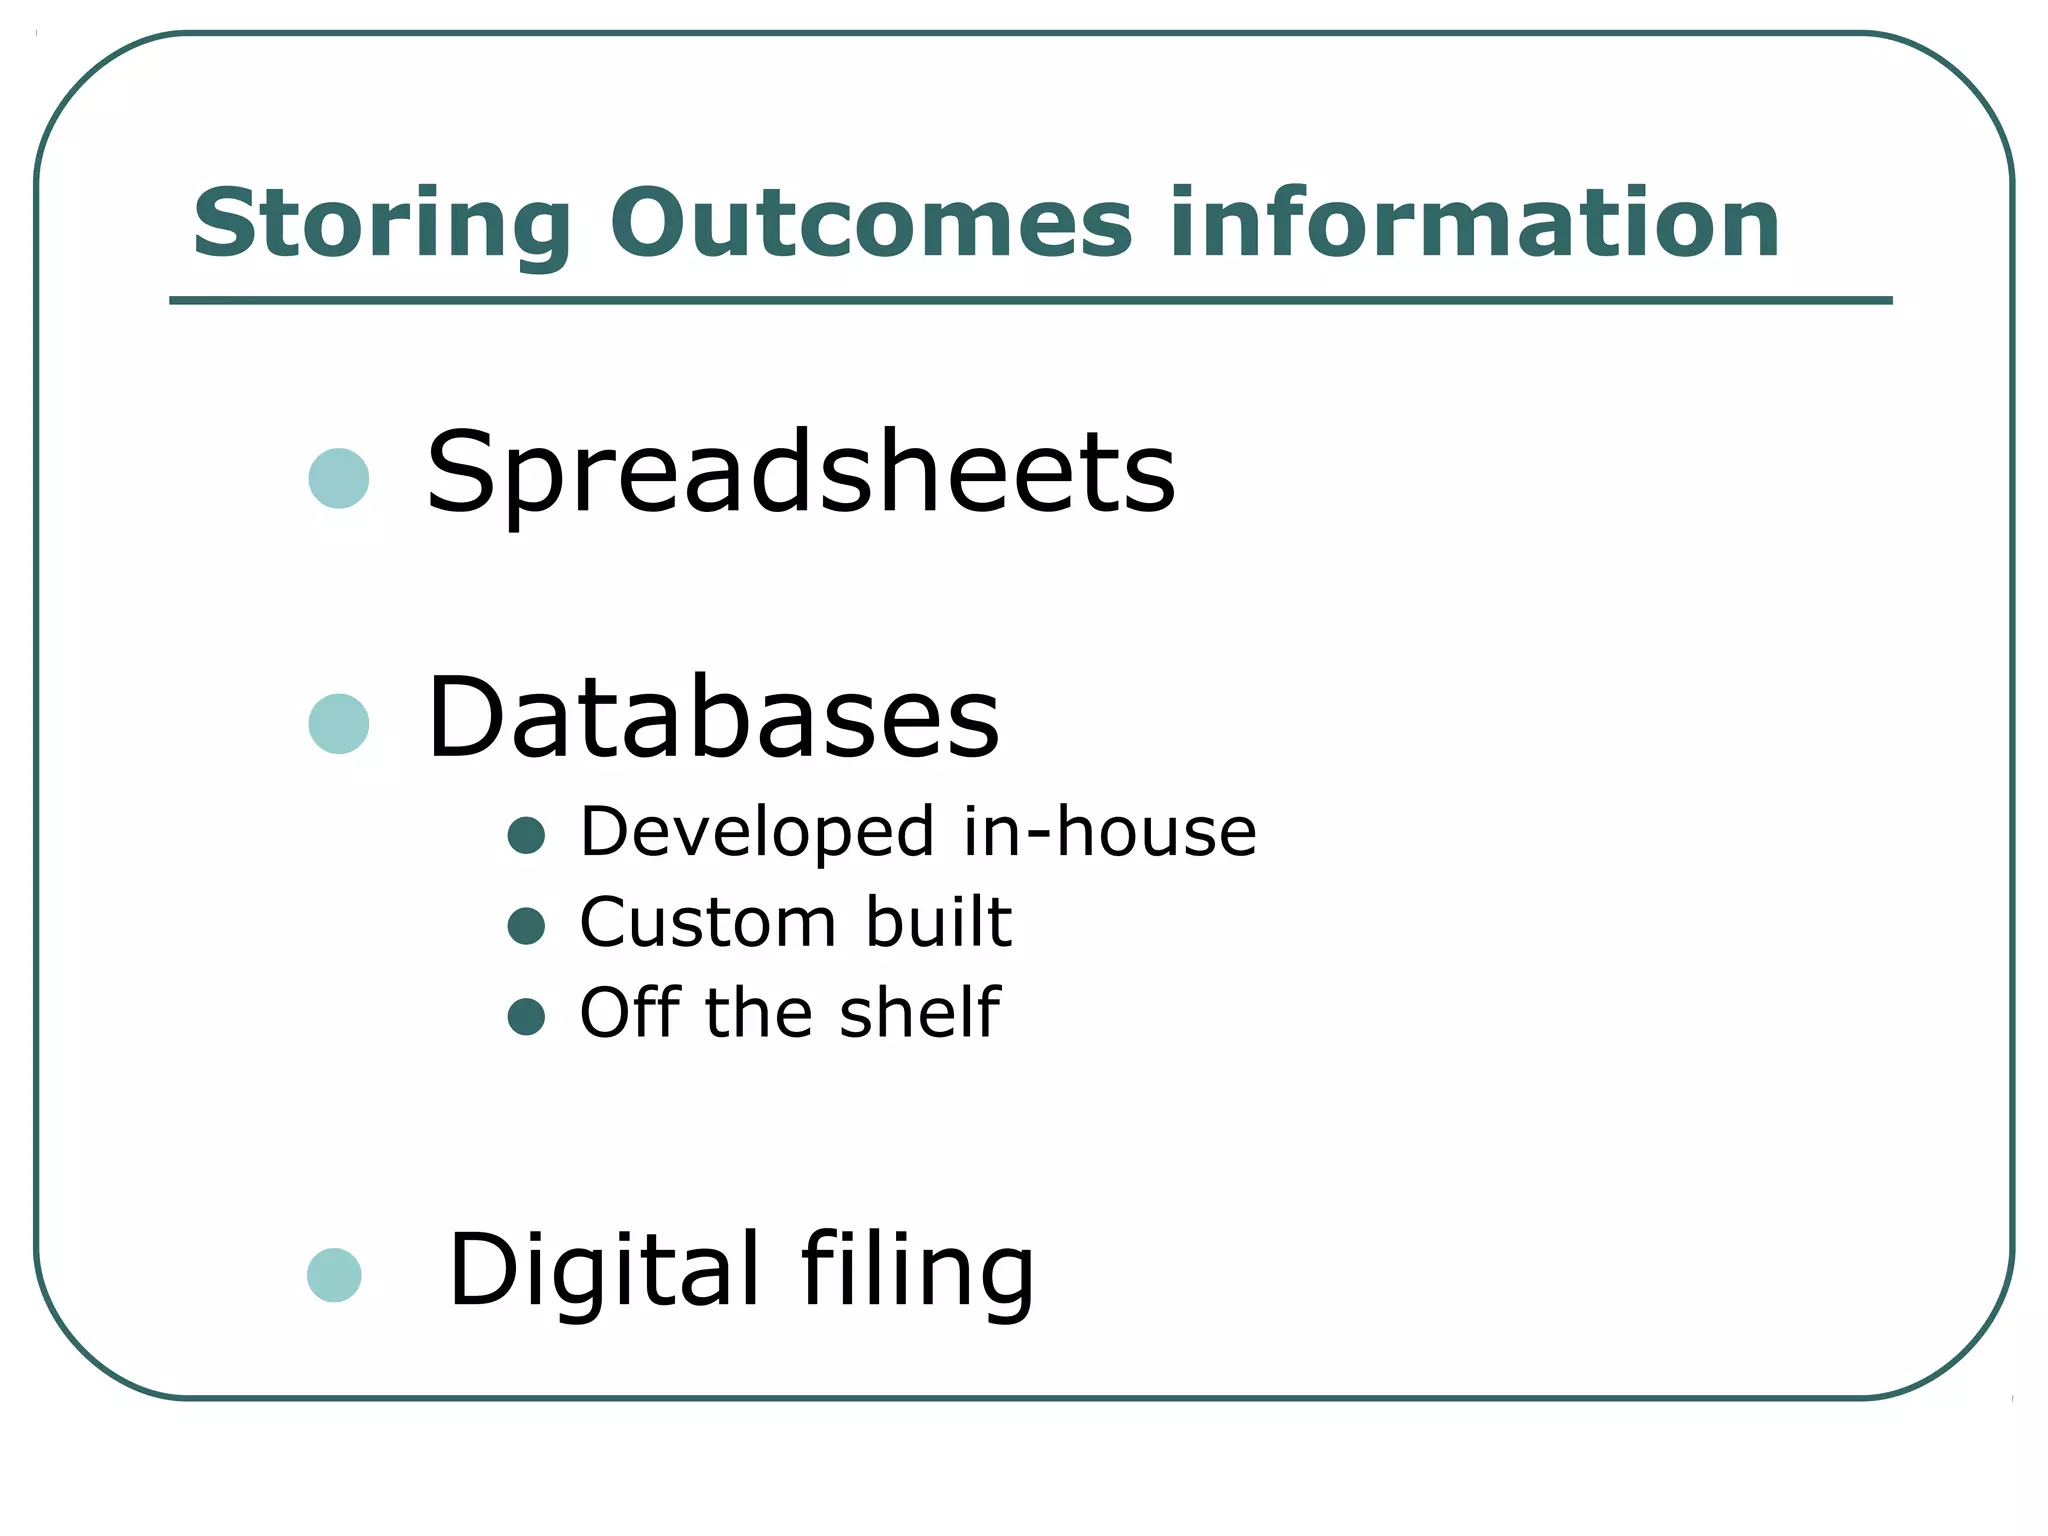
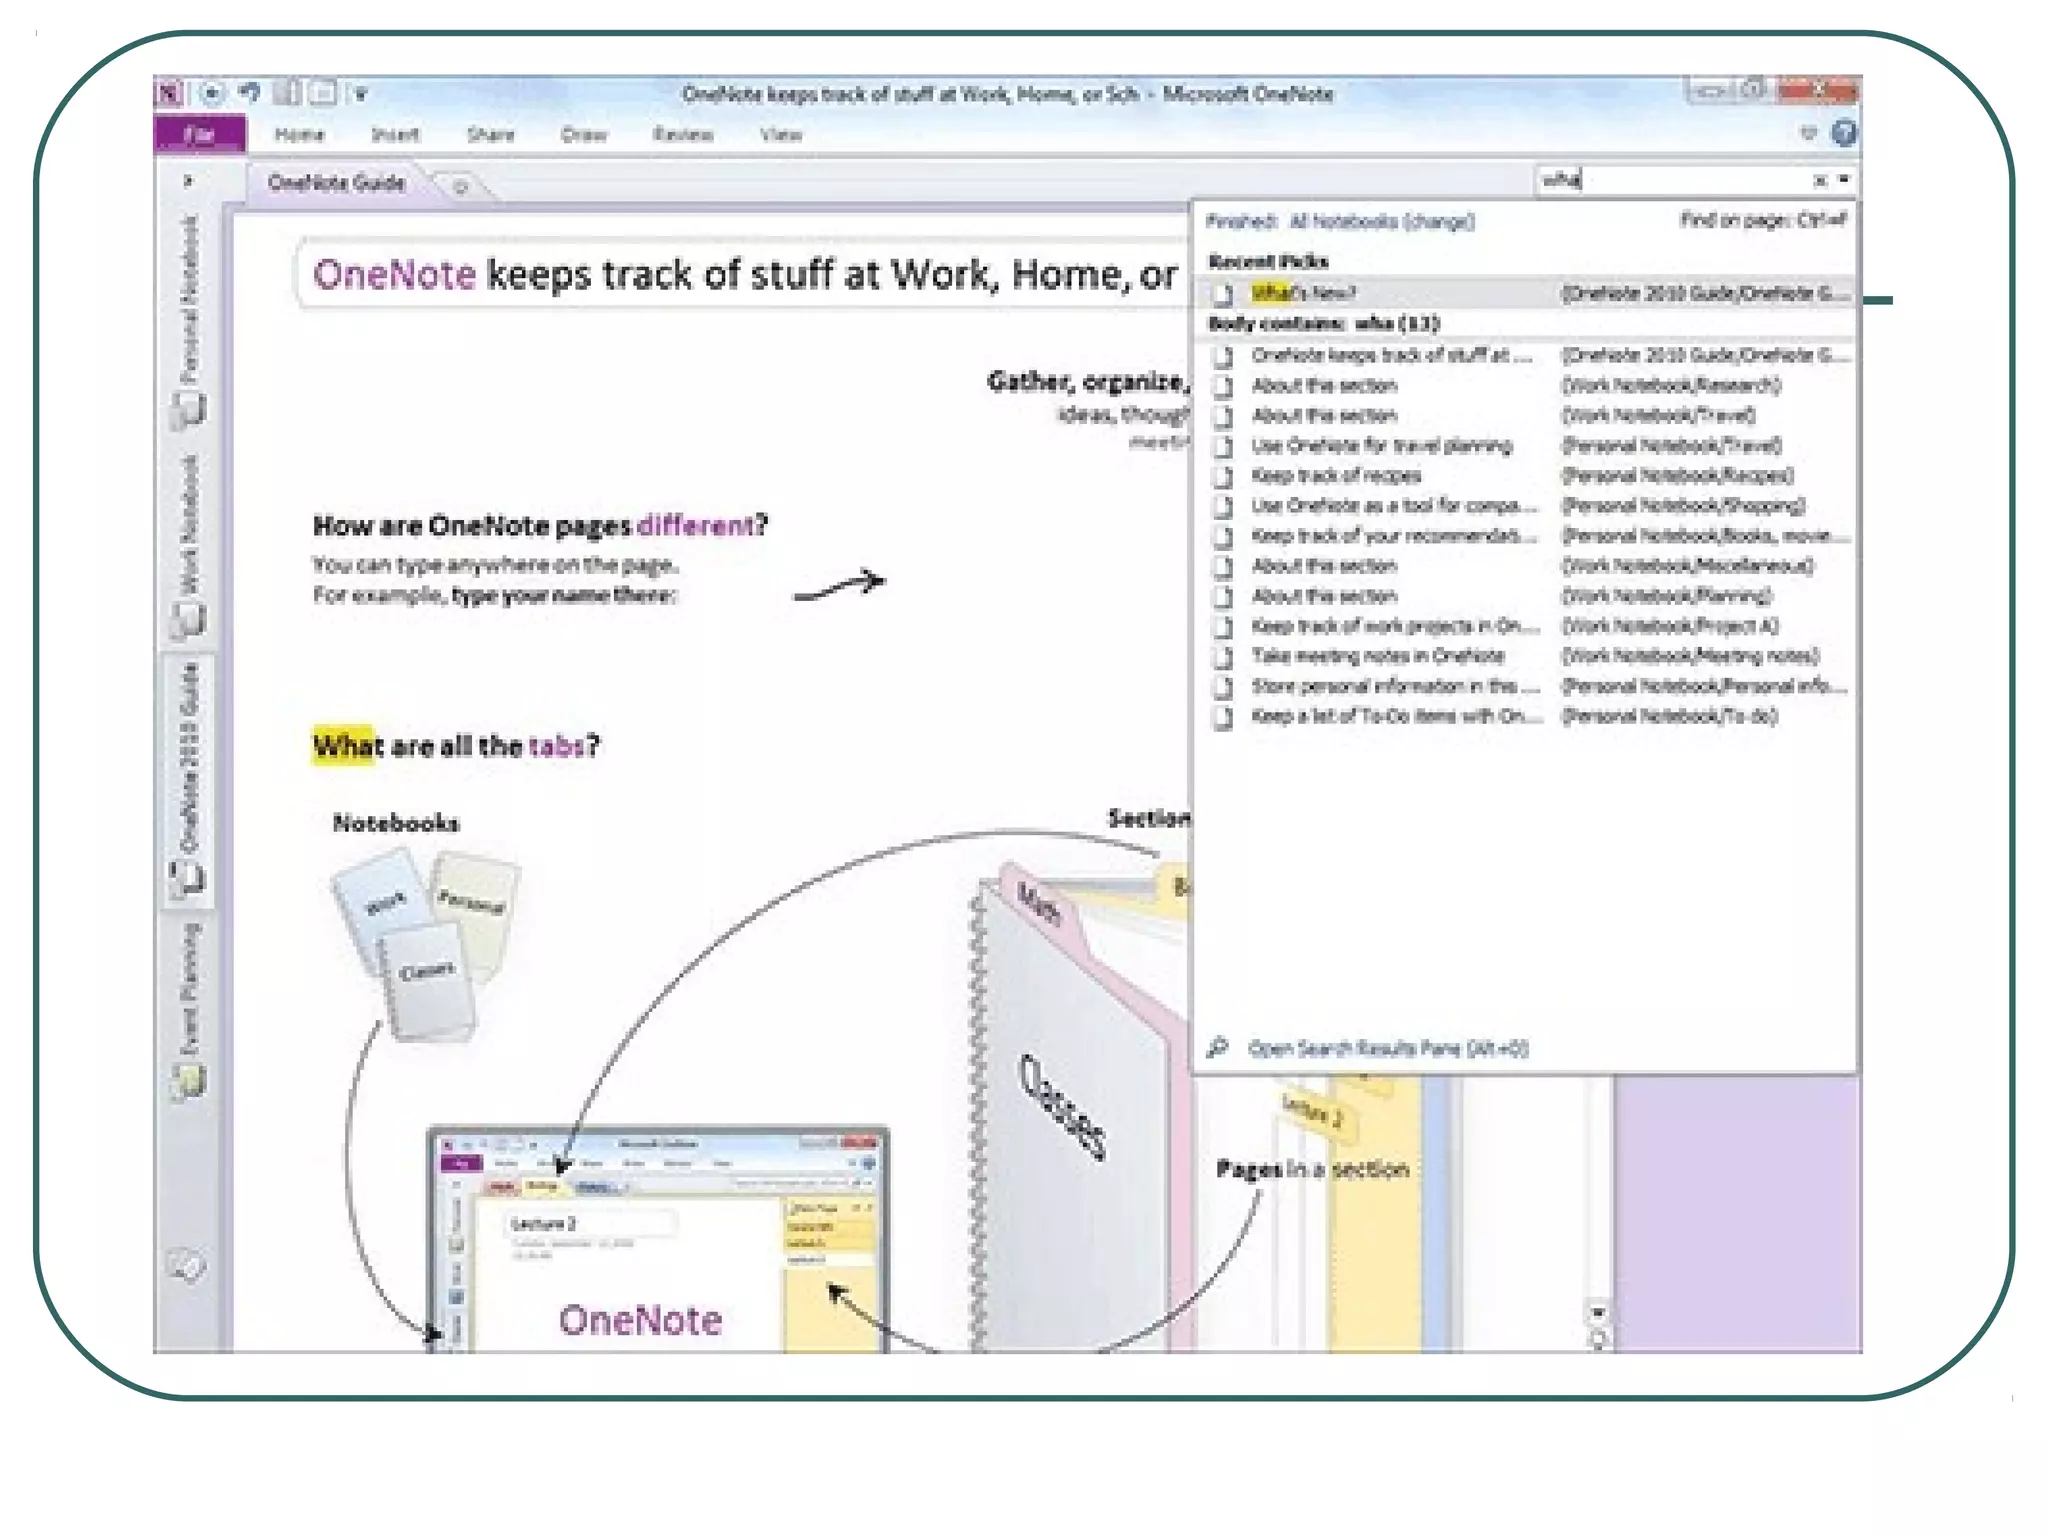
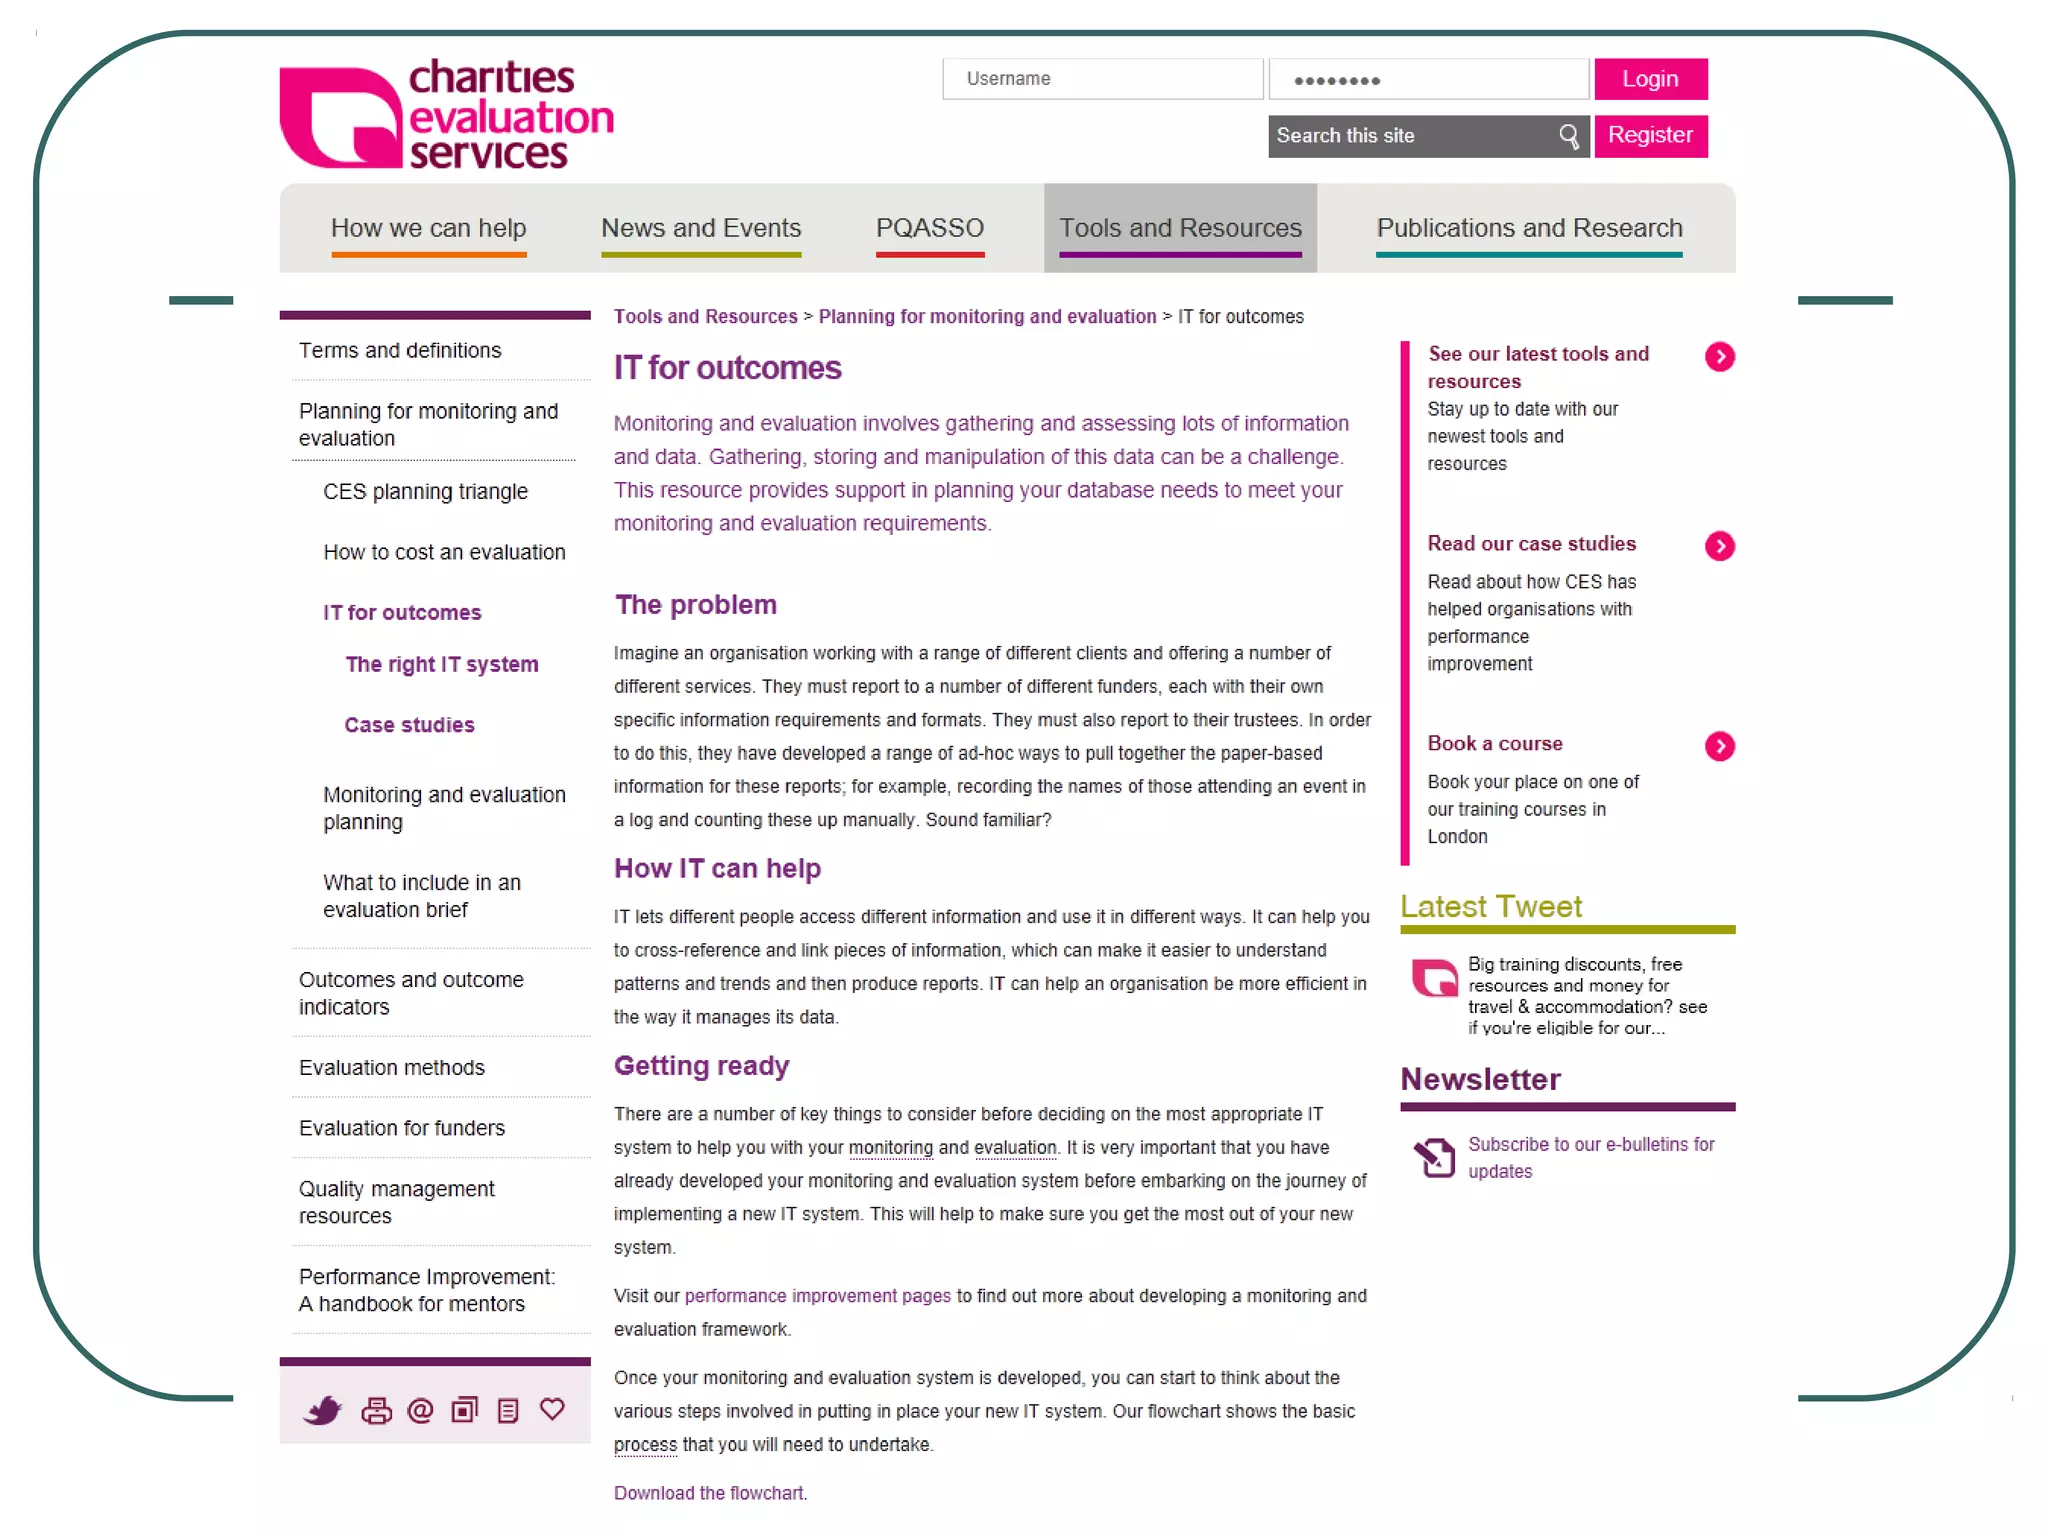
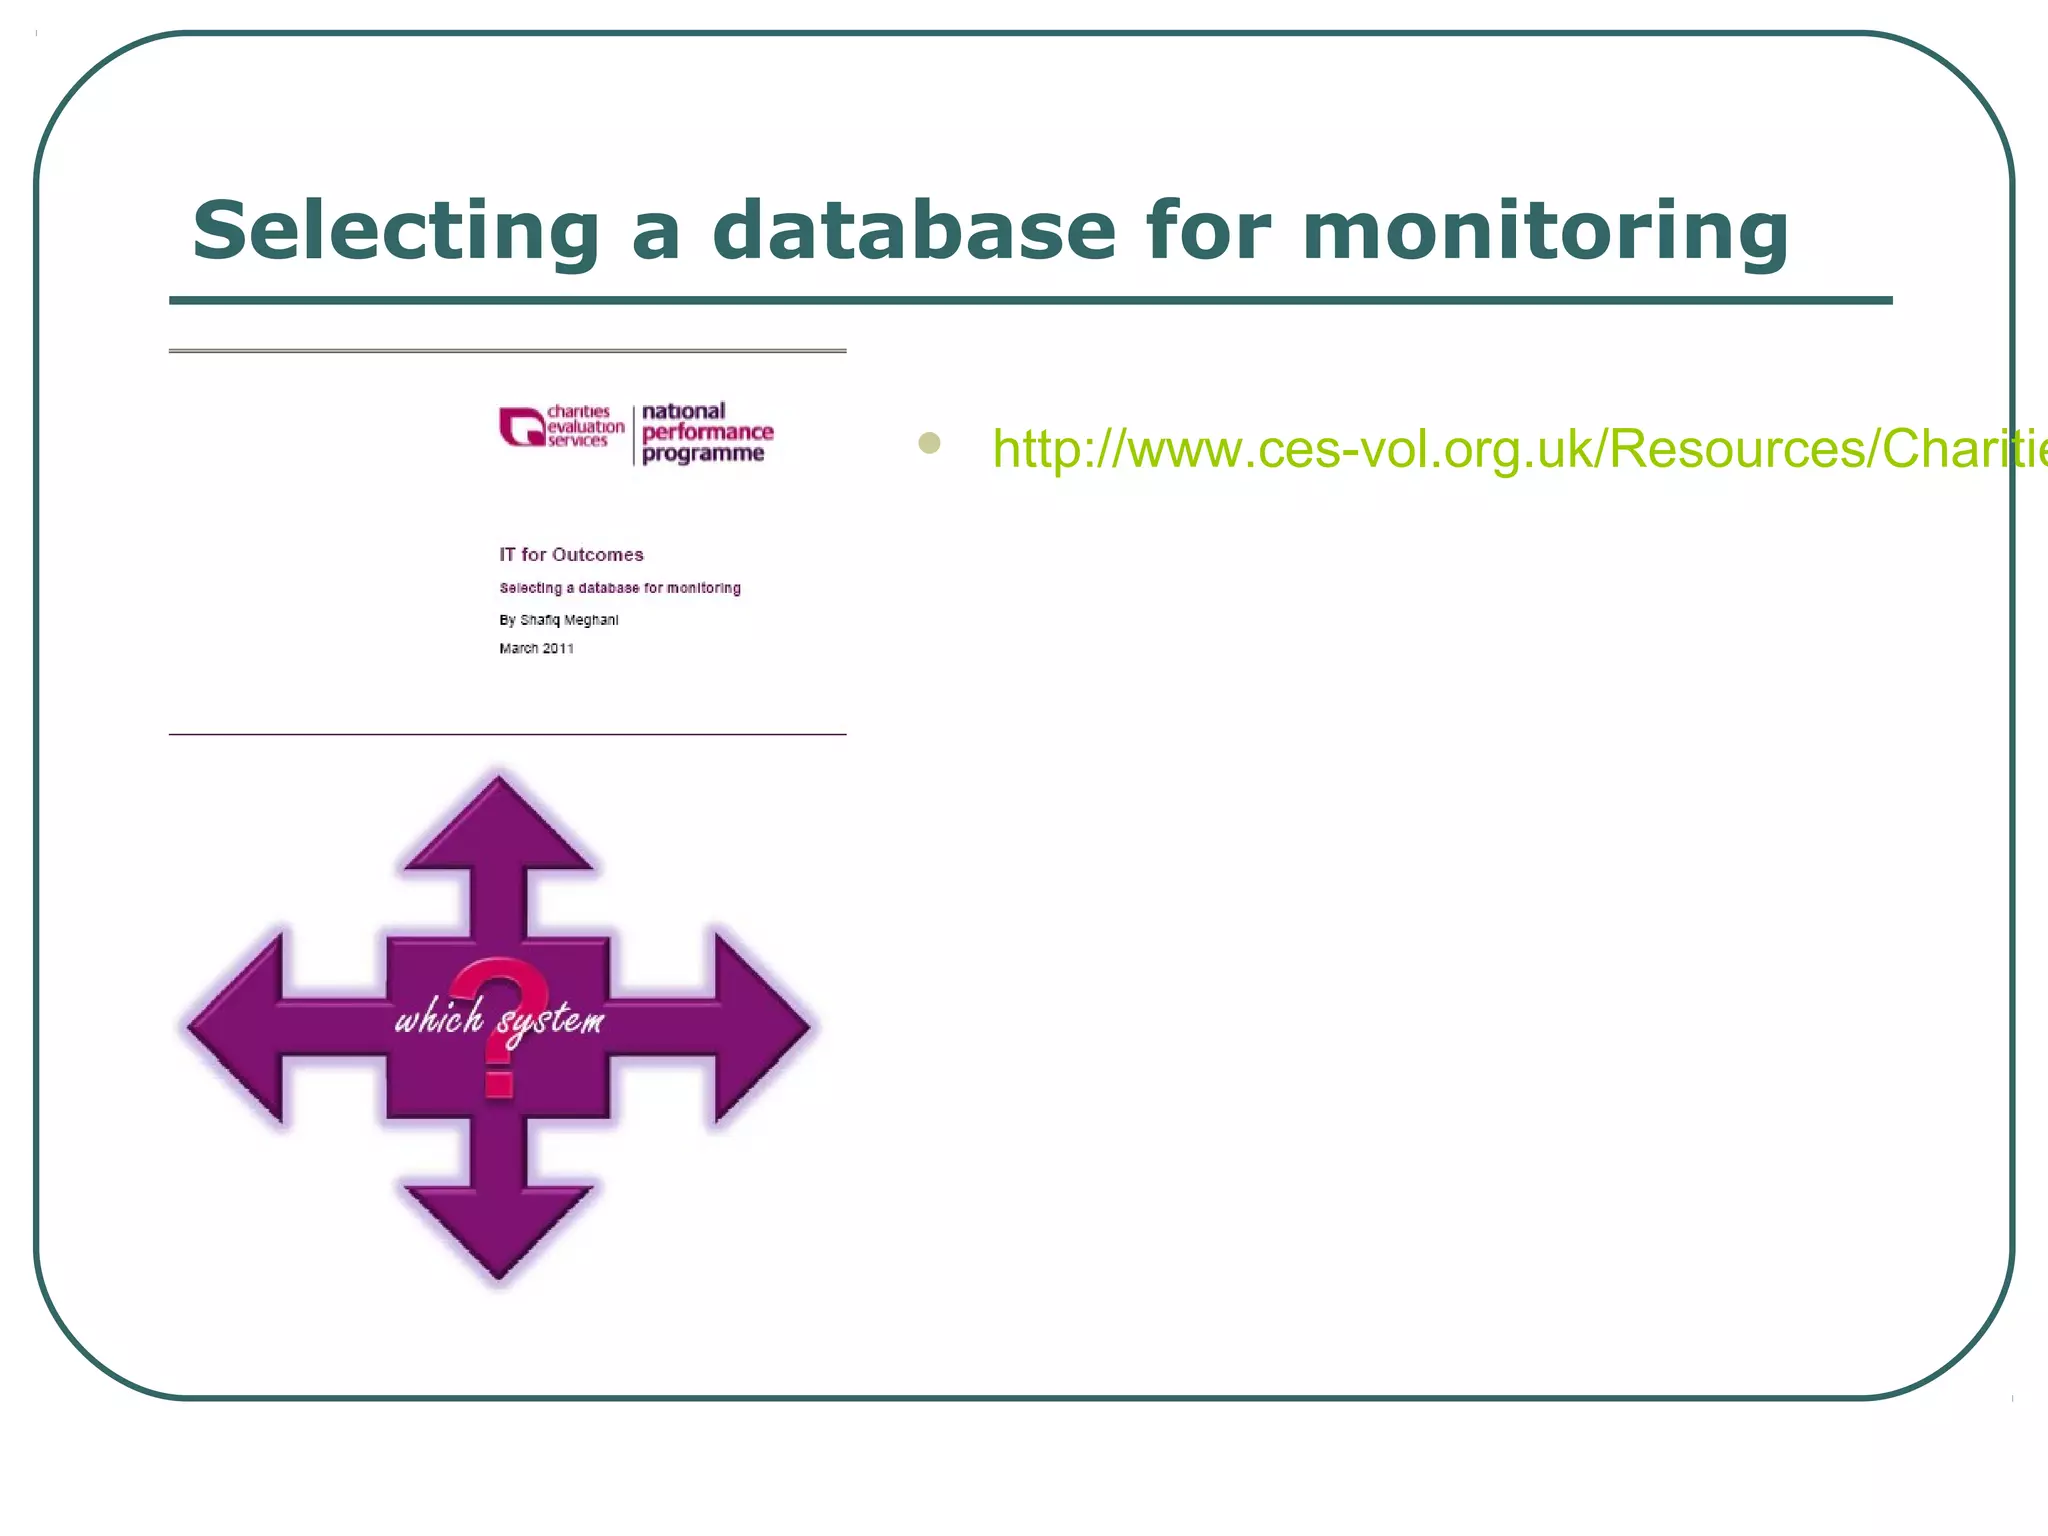
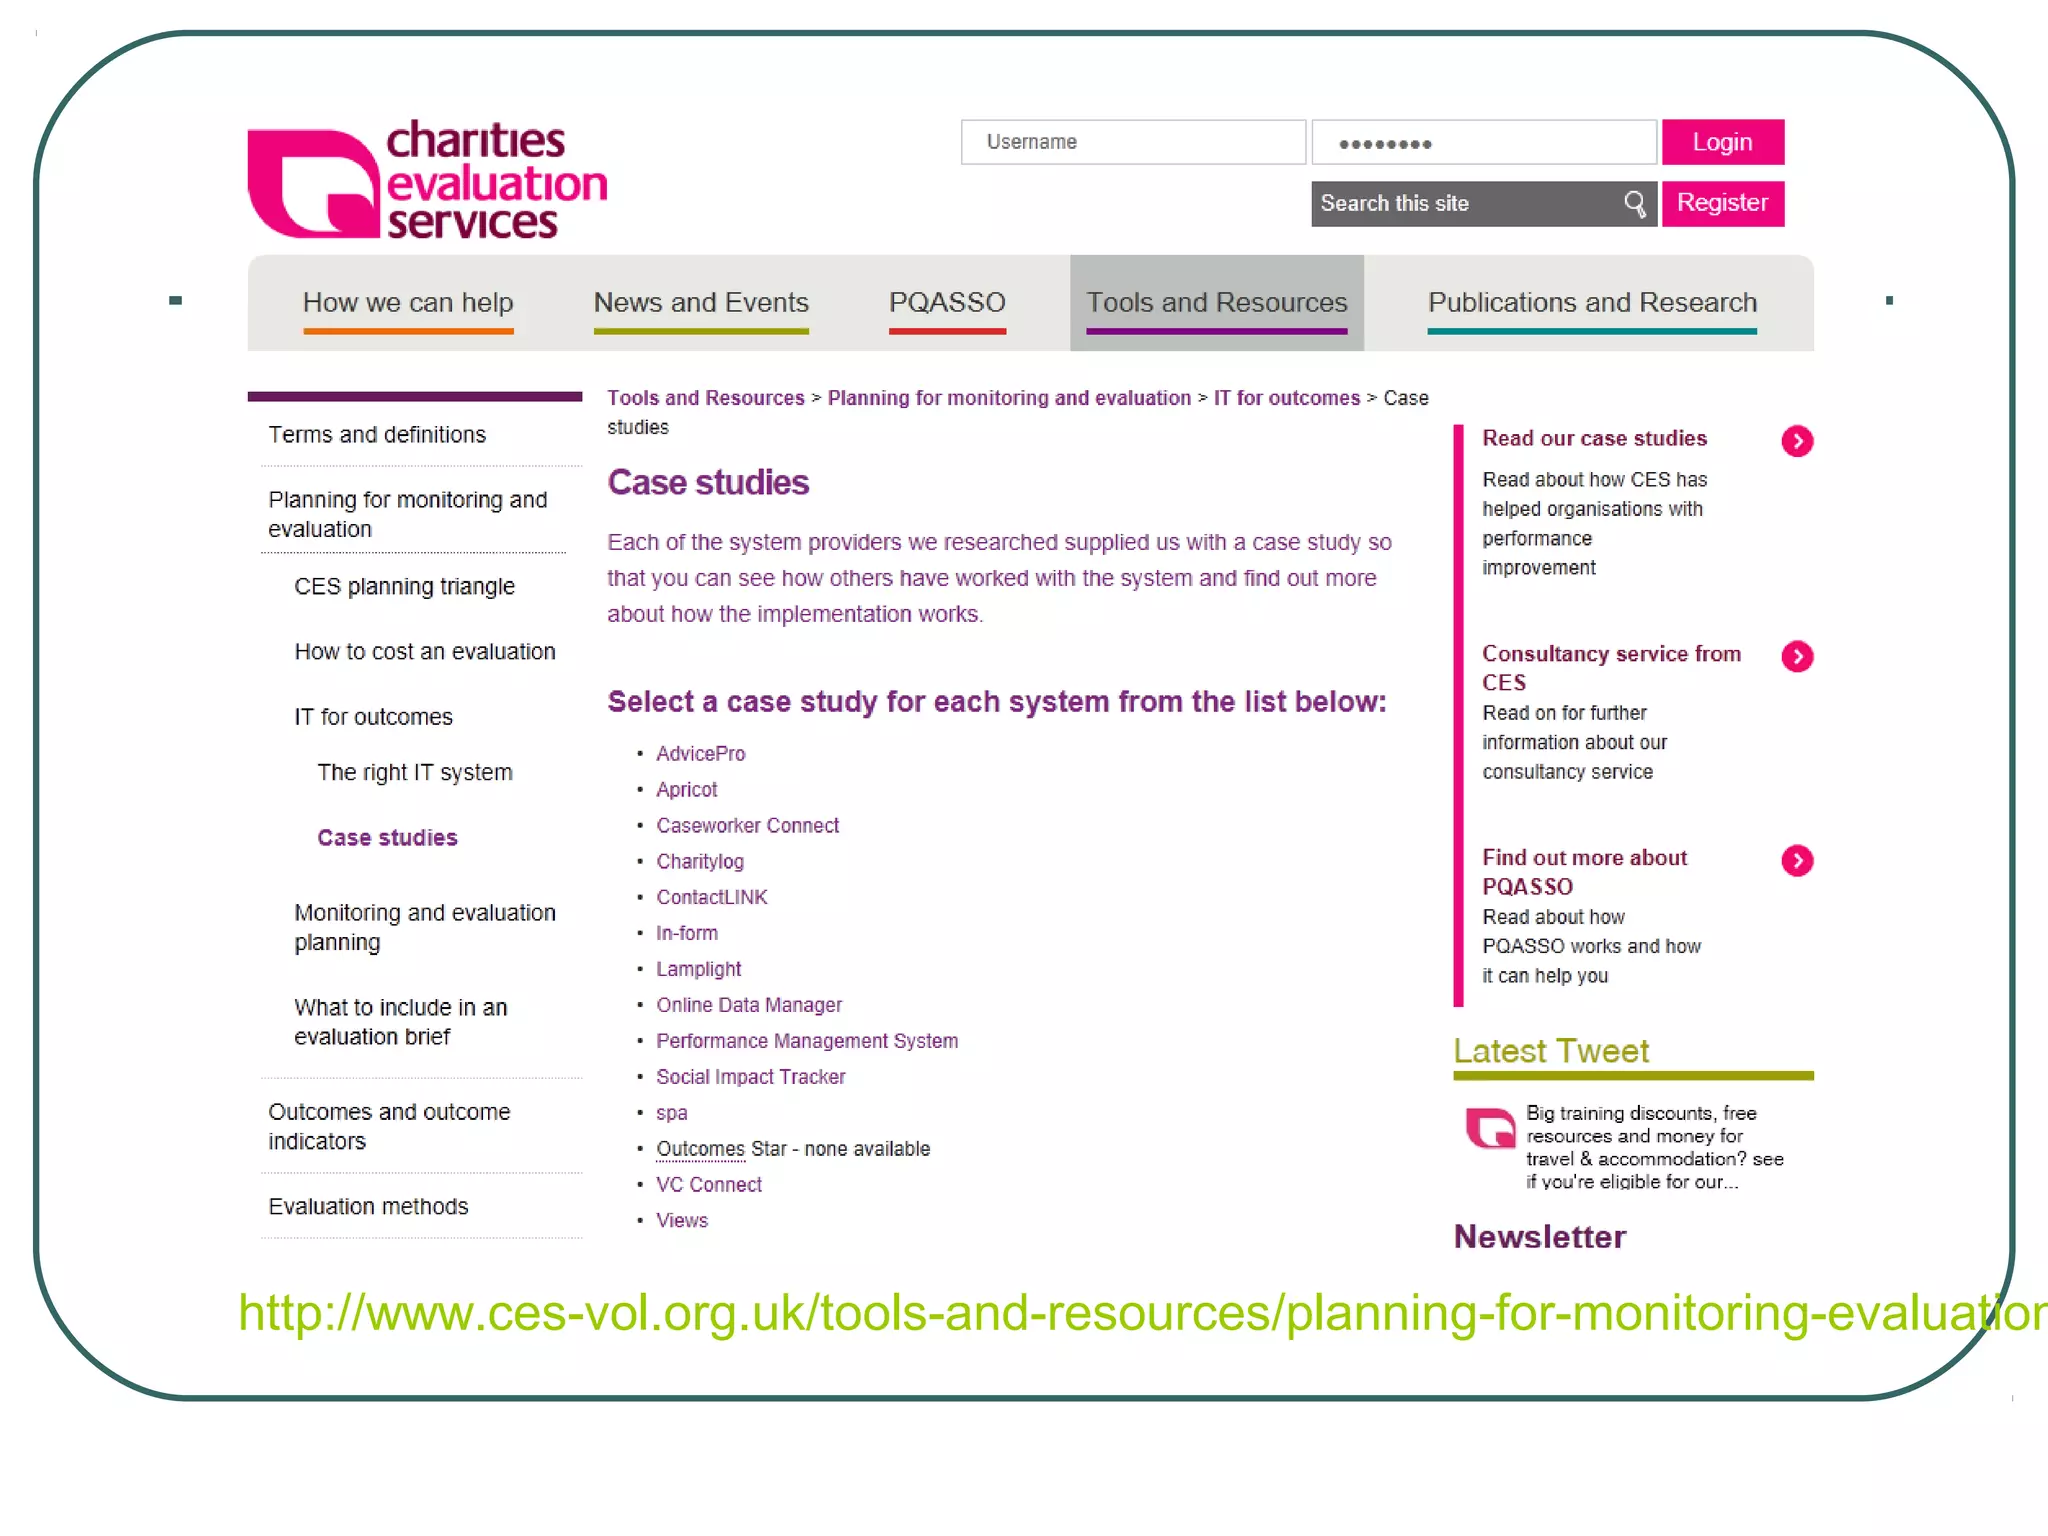
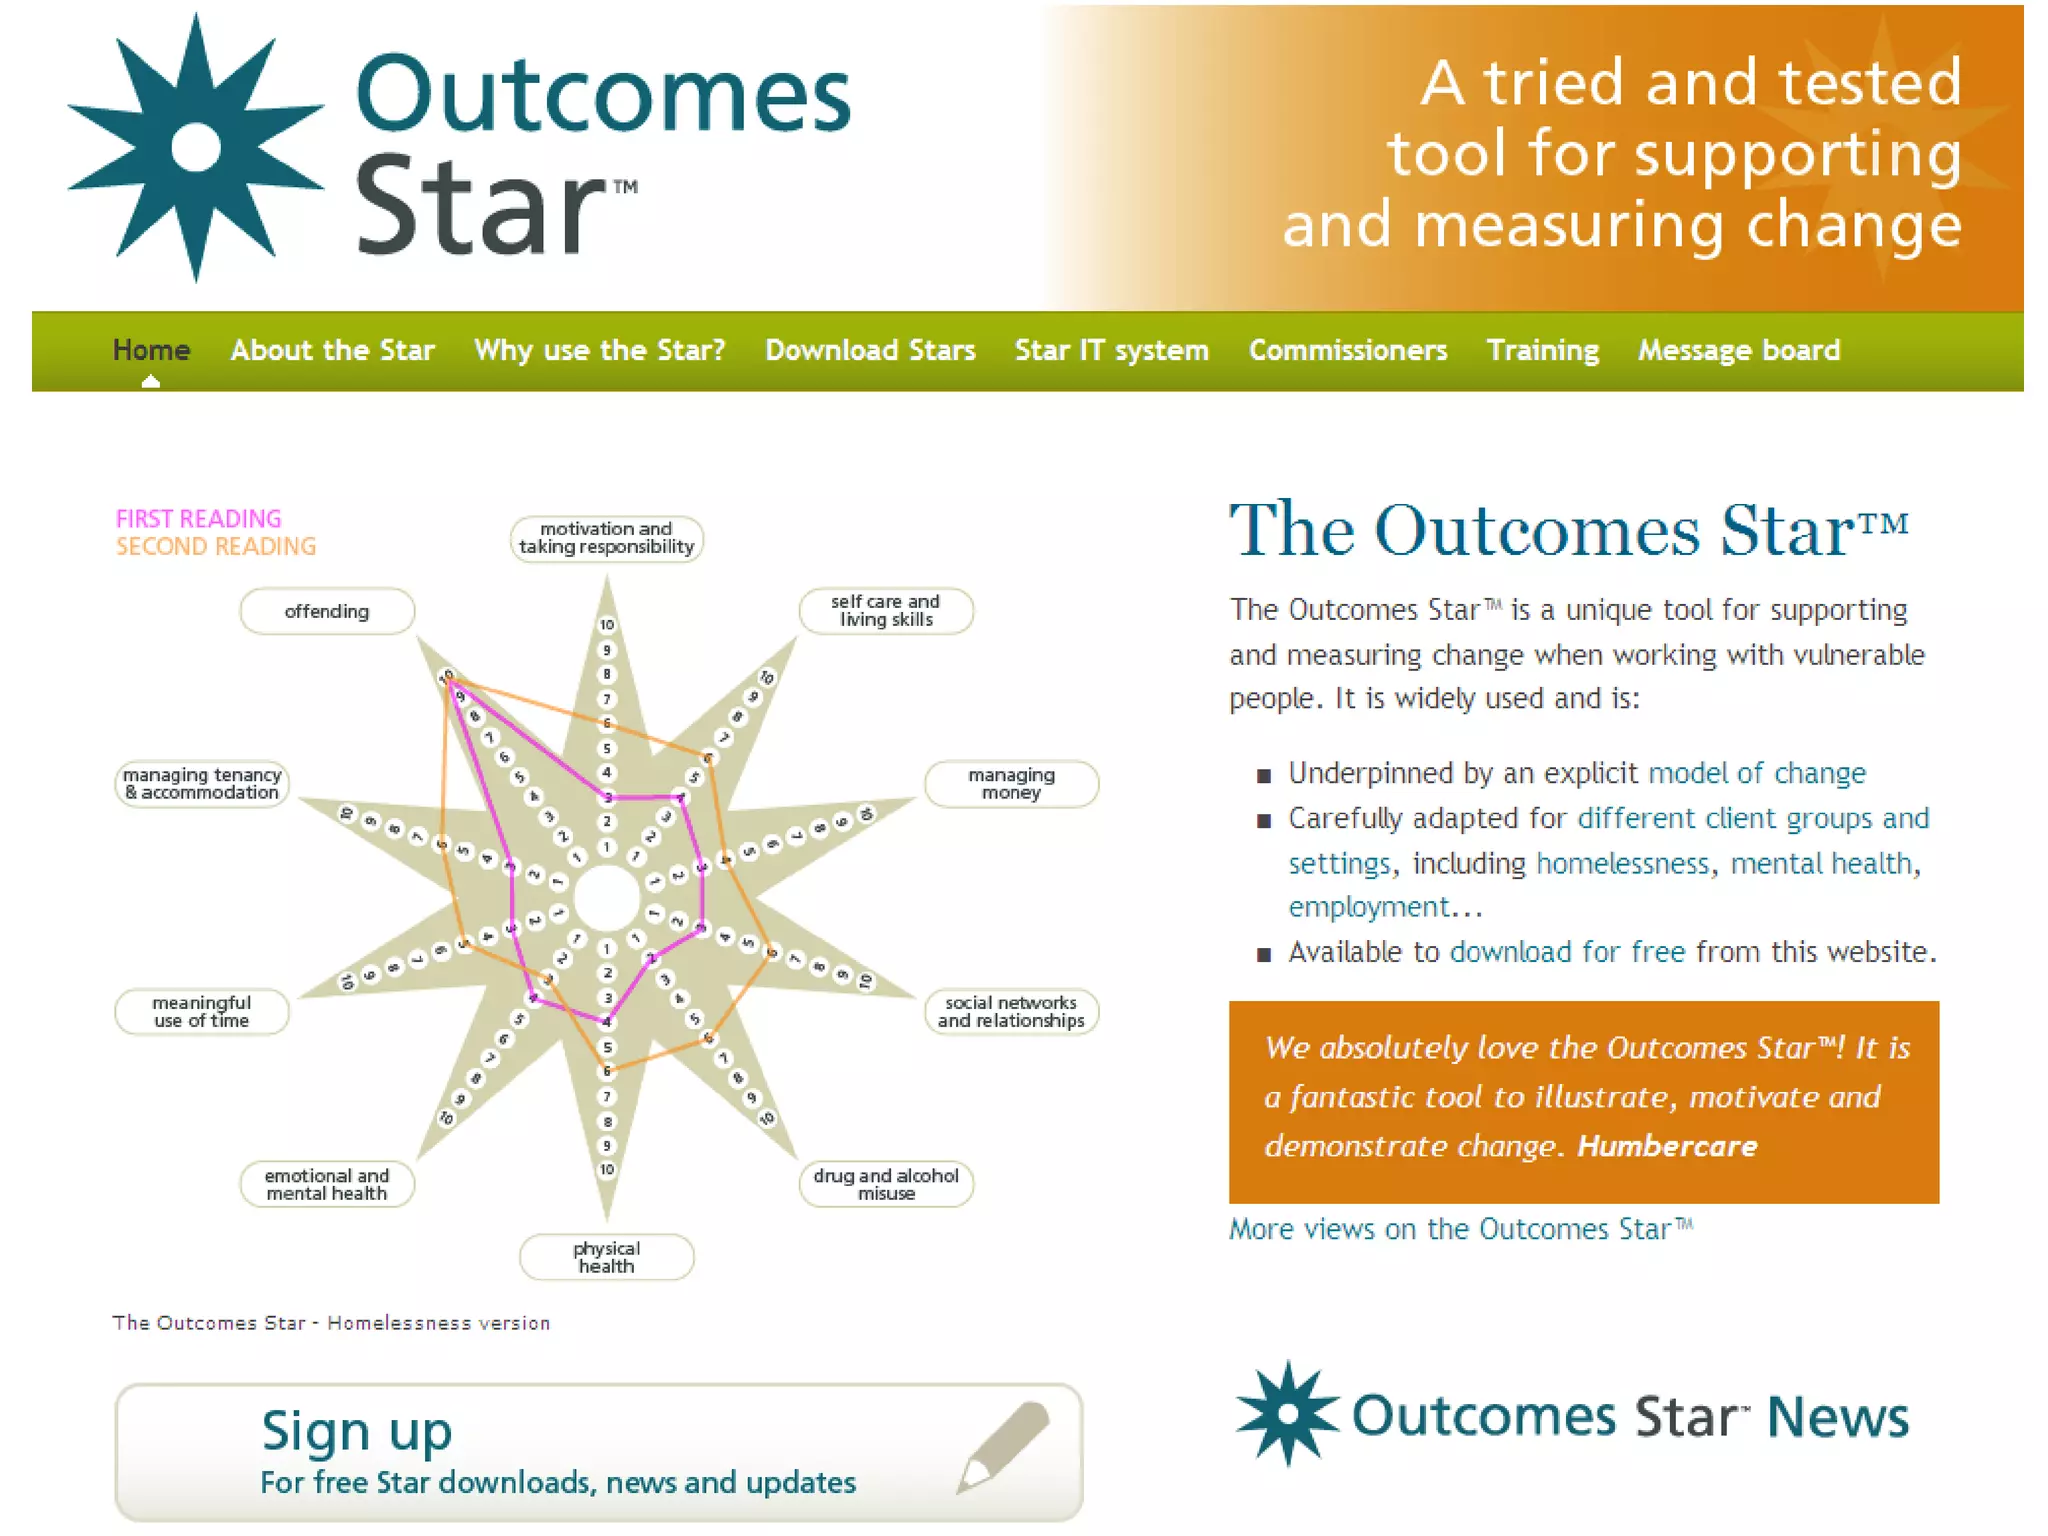
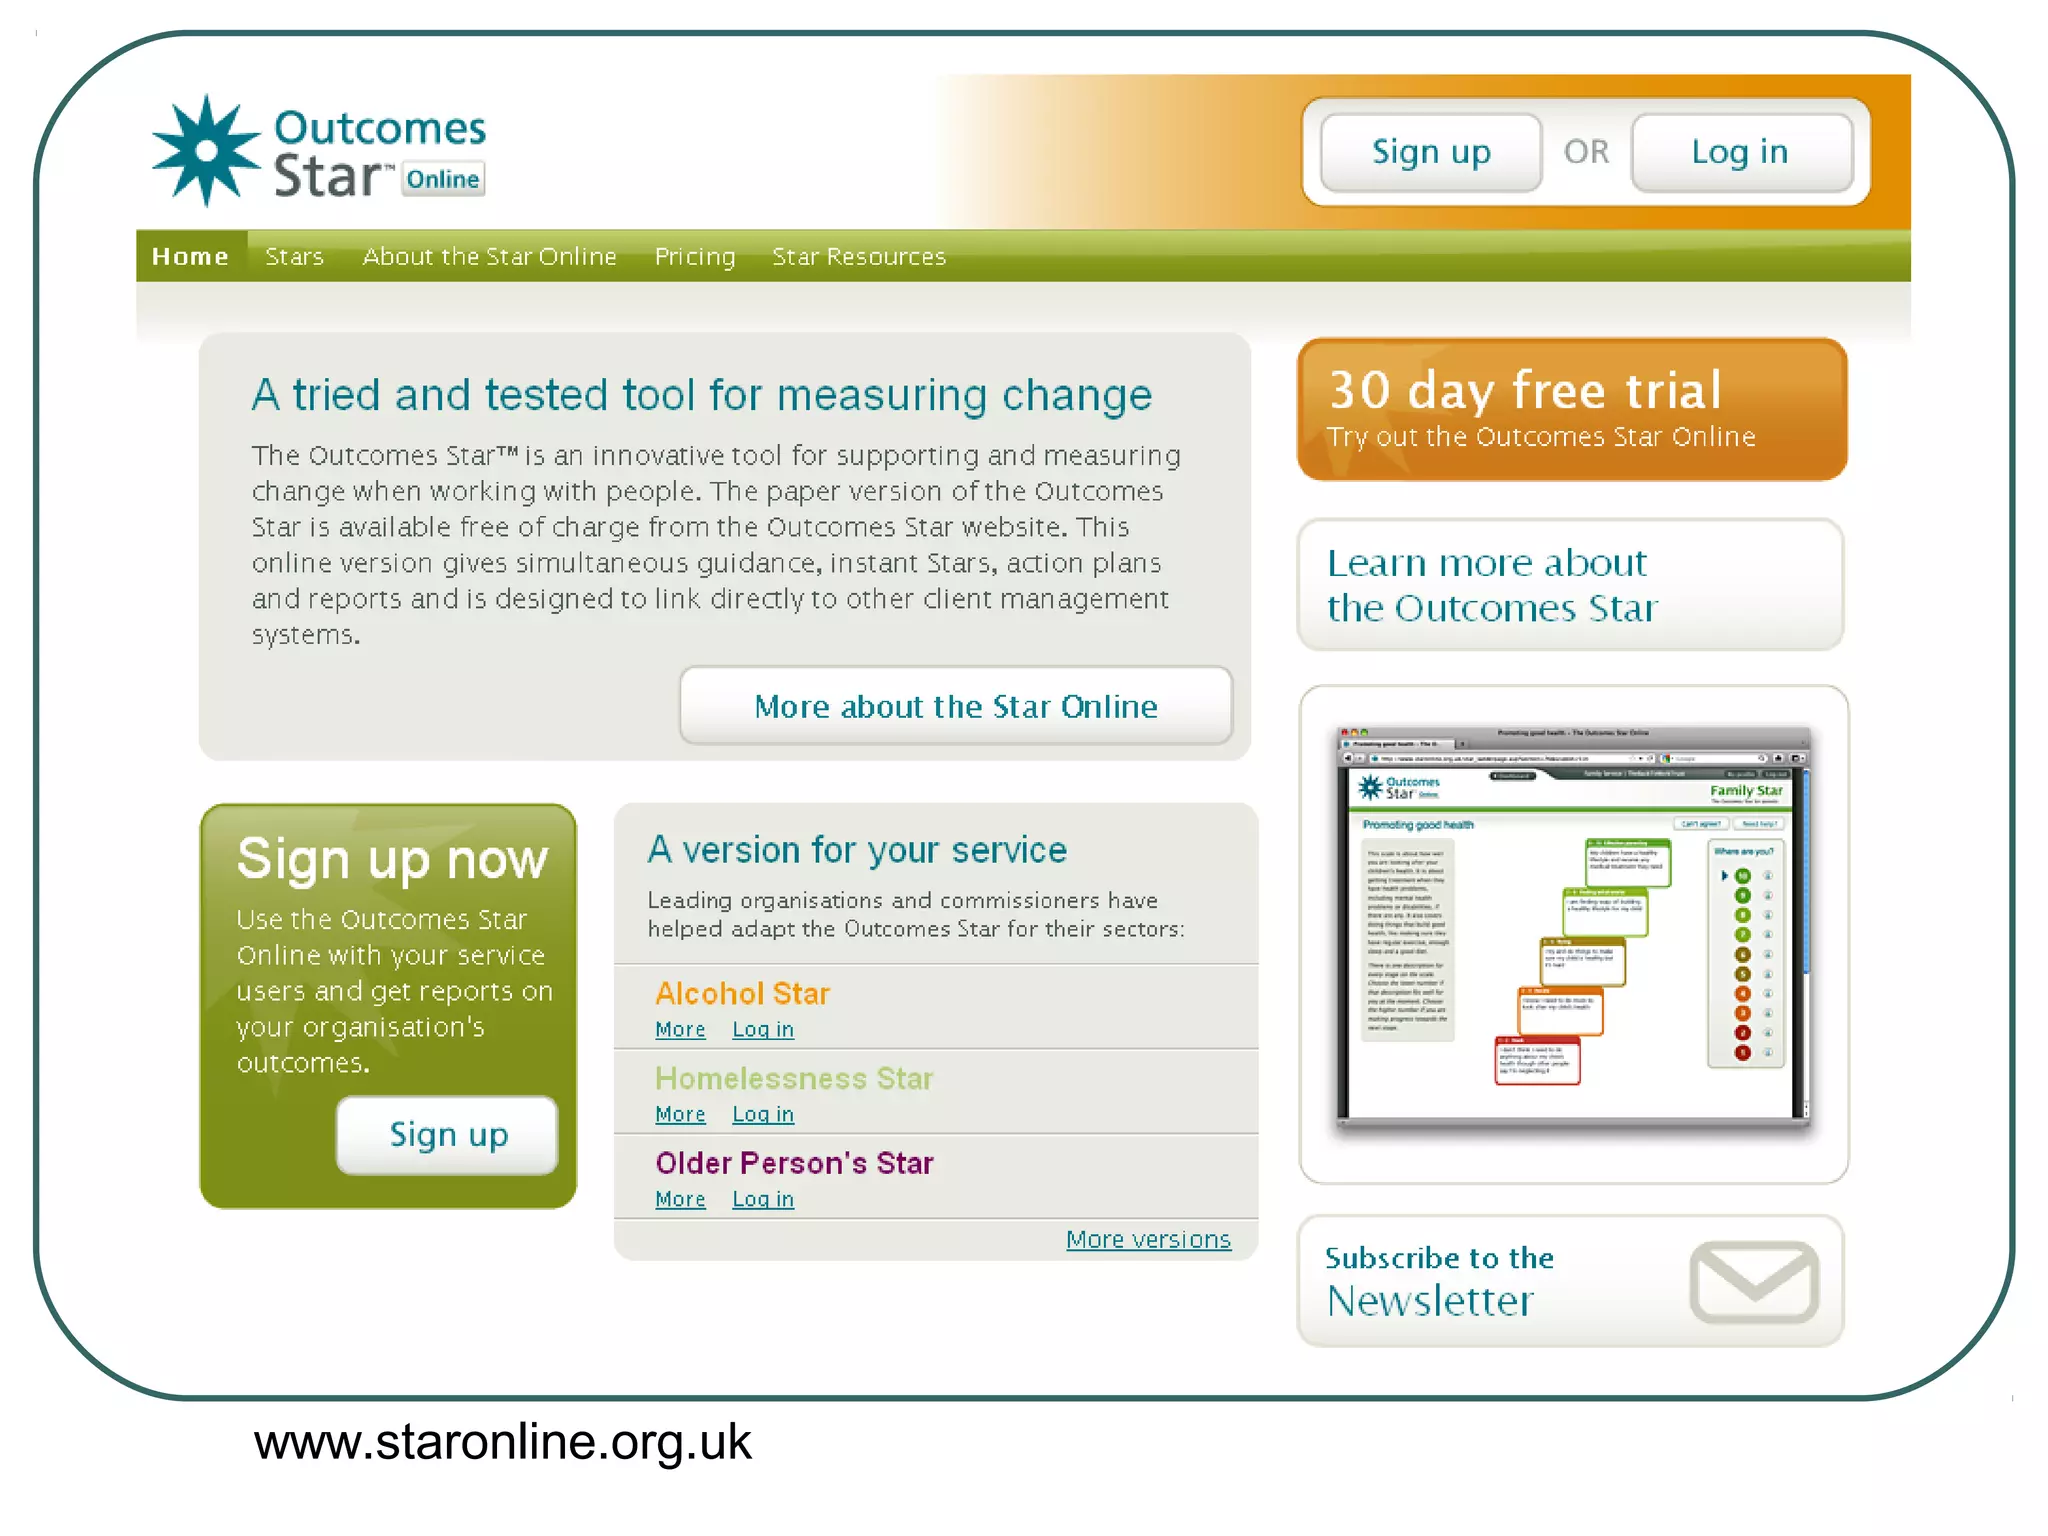
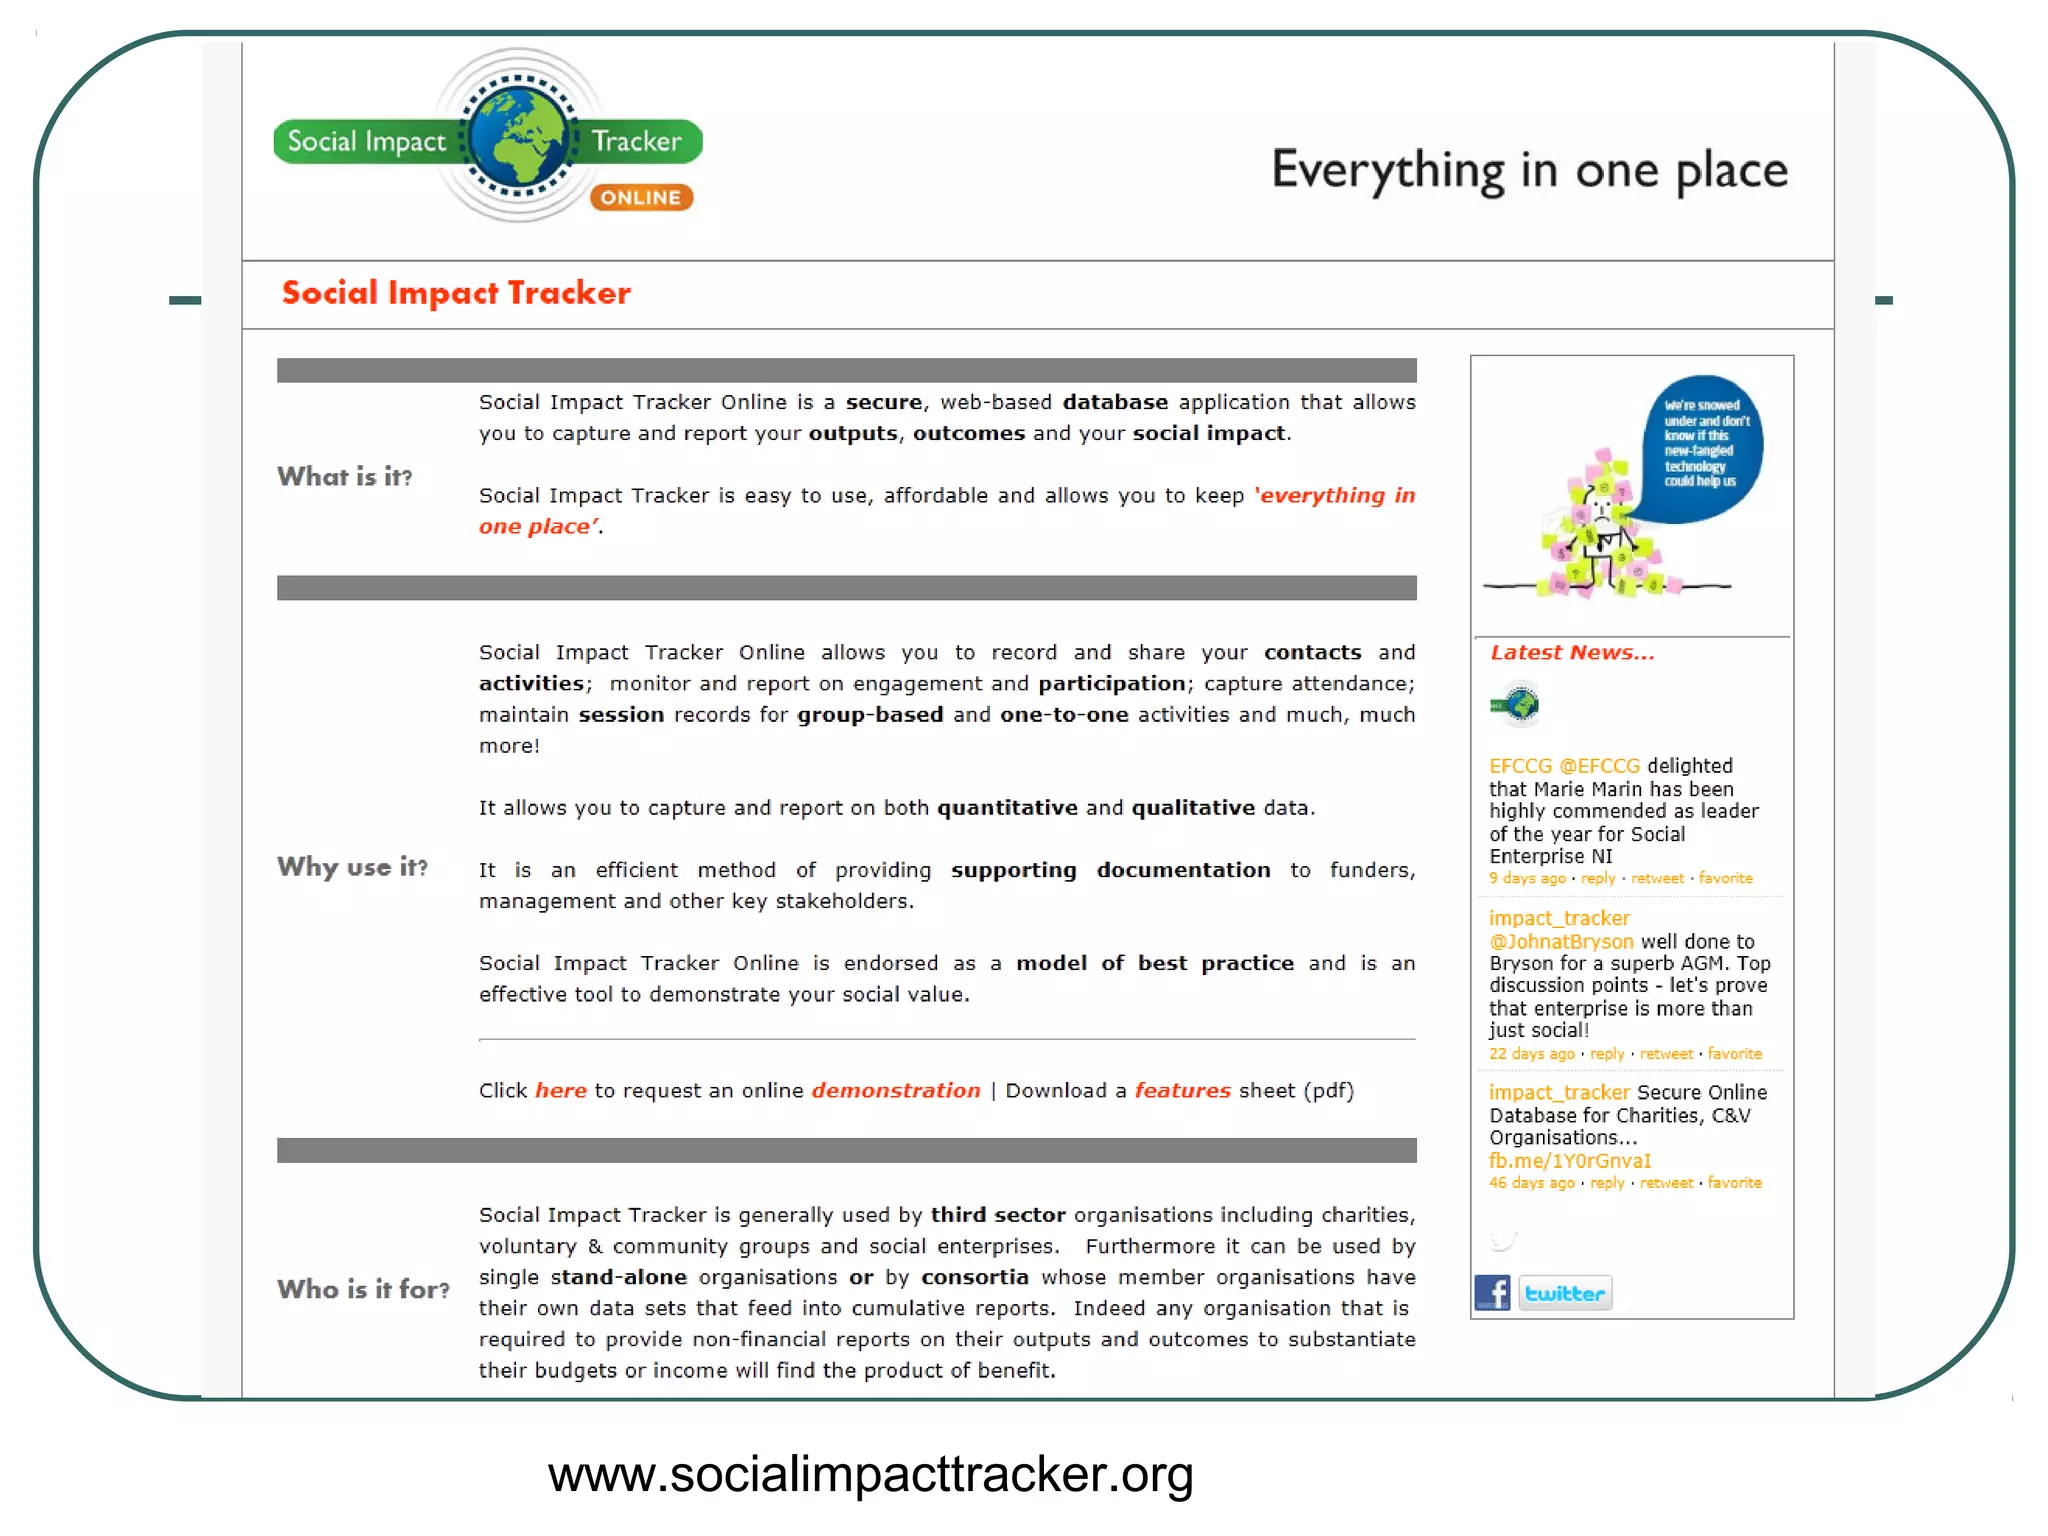
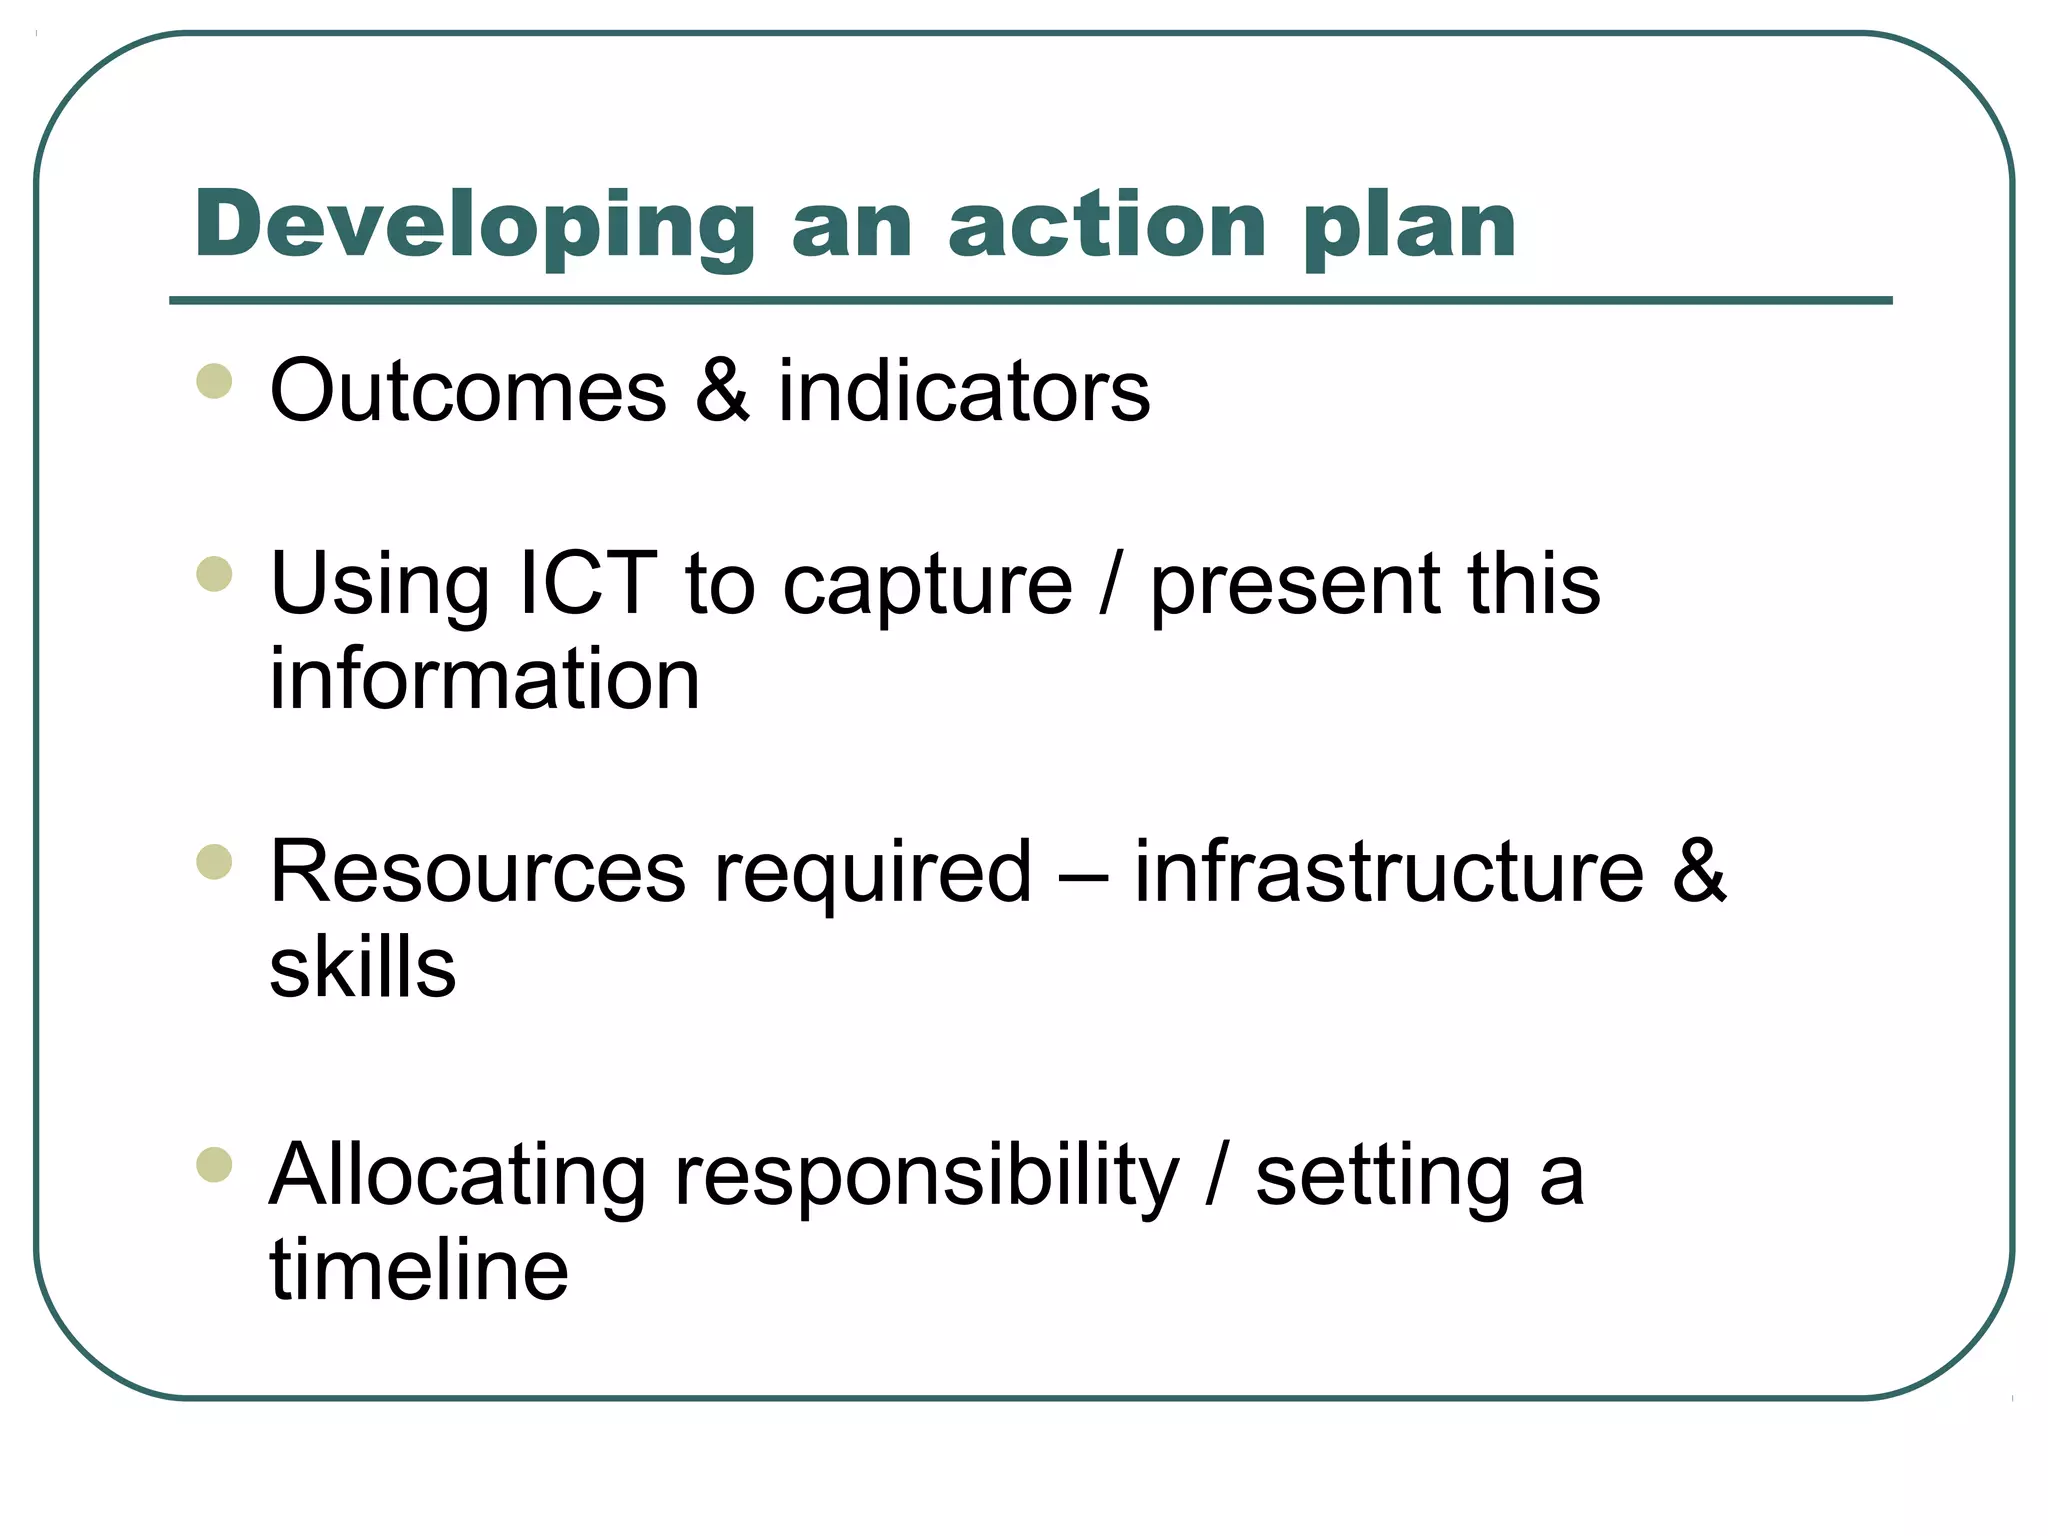
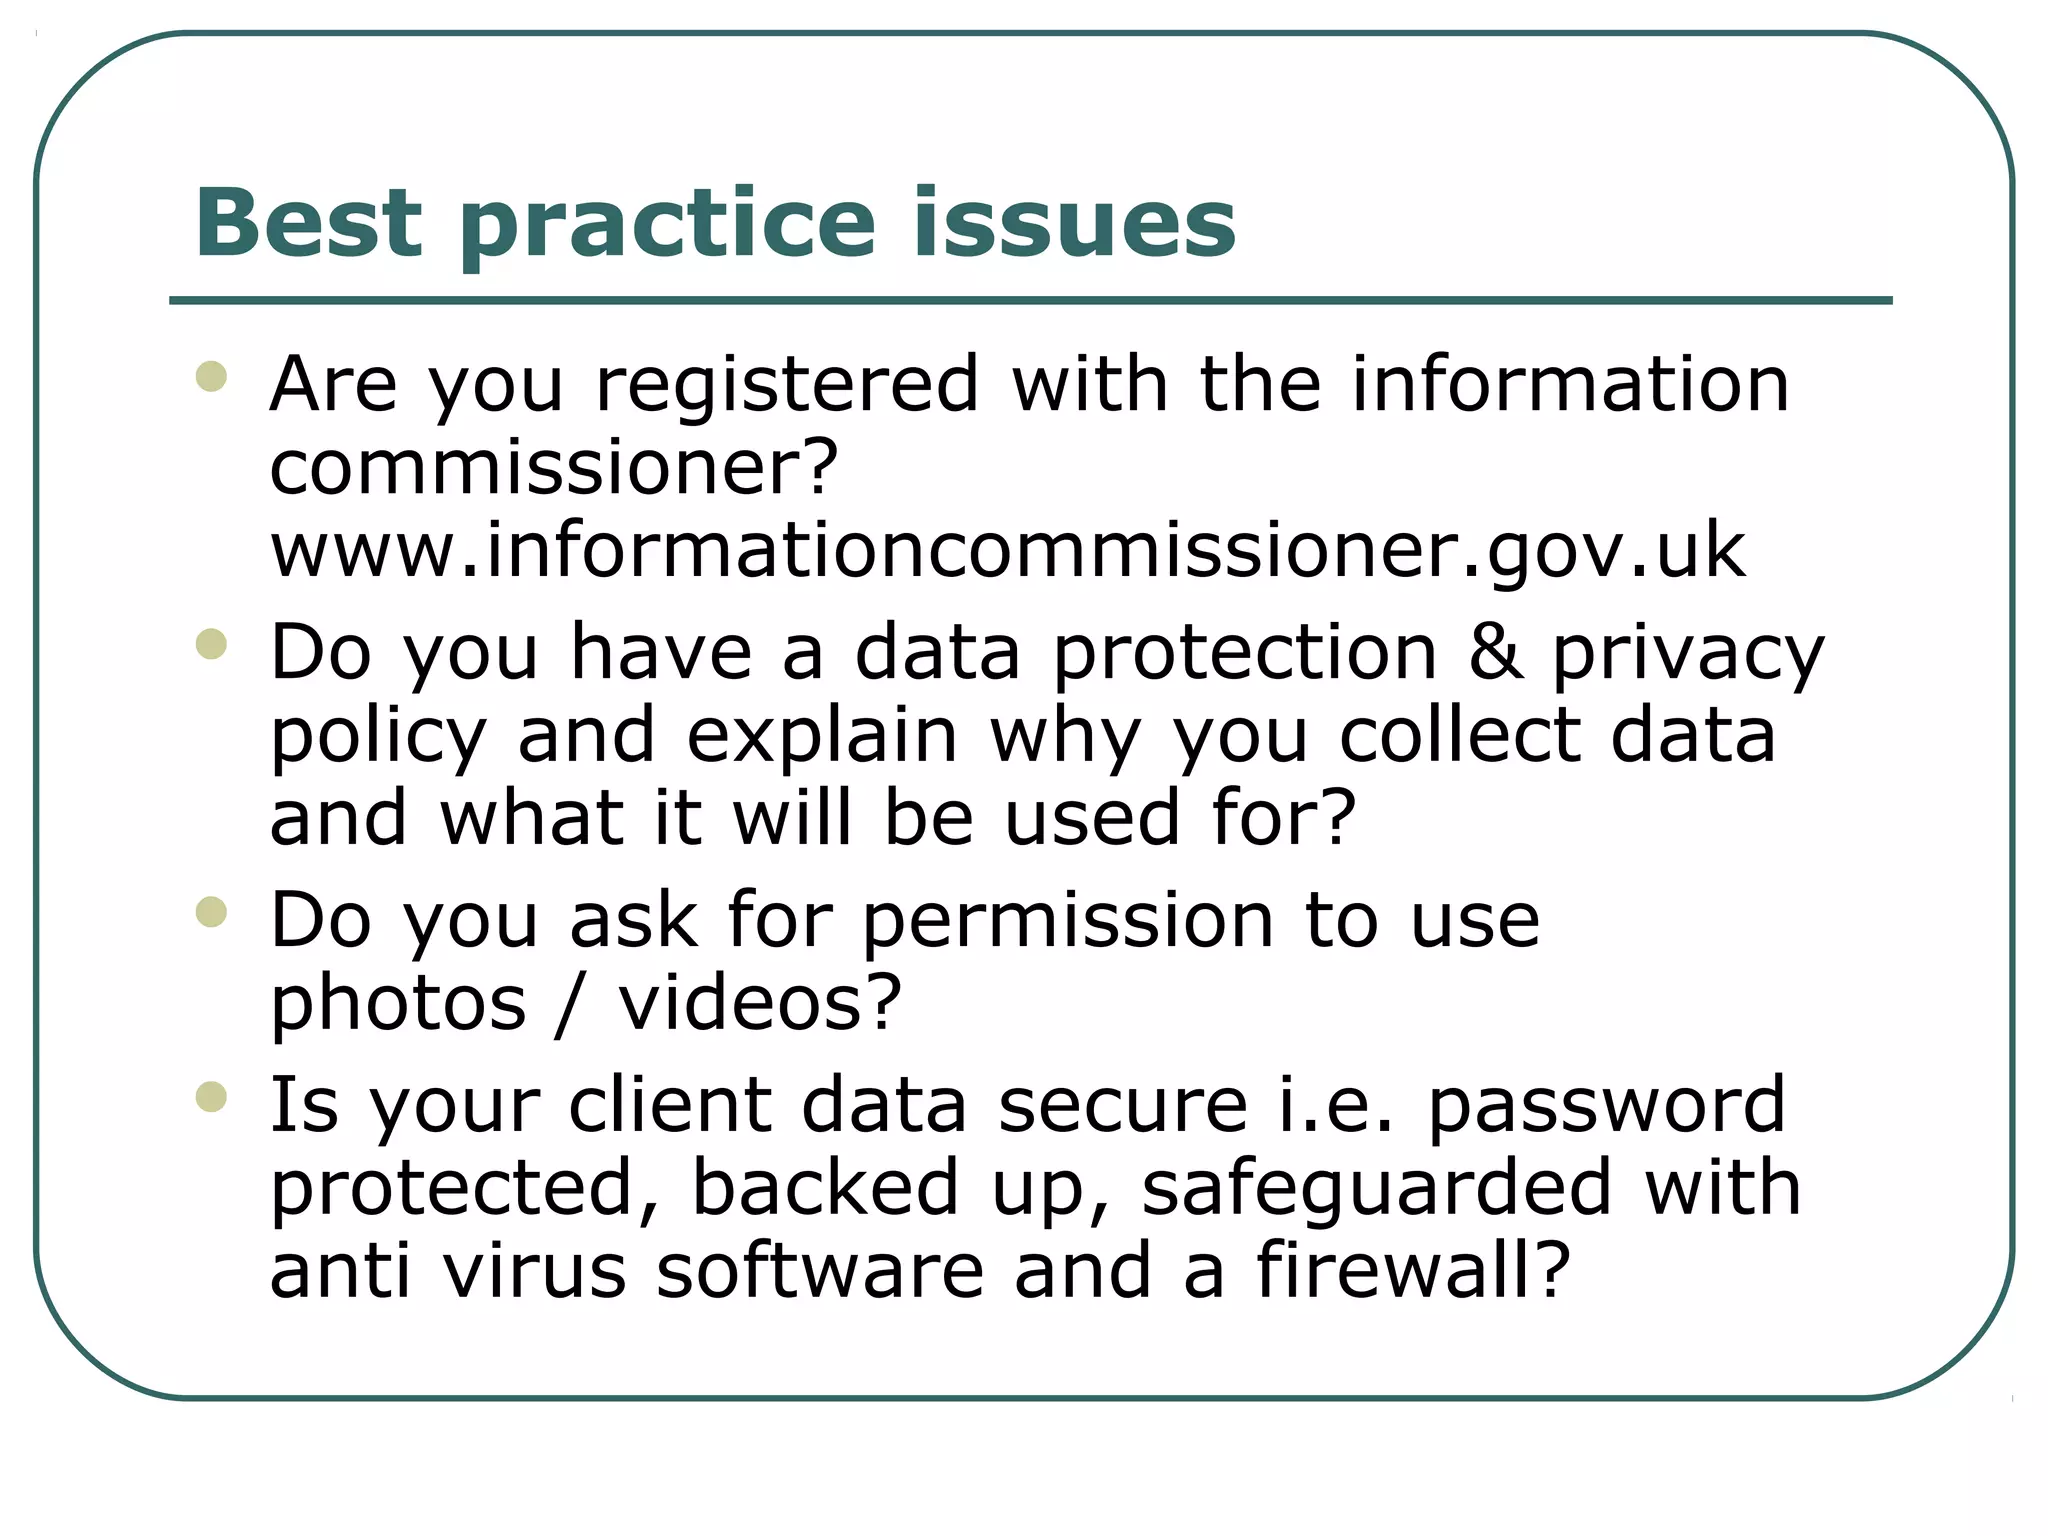
This document discusses how information and communication technologies (ICT) can help improve the efficiency and effectiveness of outcomes monitoring. It provides examples of tools for collecting, storing, retrieving, and presenting outcomes information. These include online surveys, websites, databases, digital files, and tools for data analysis and visualization. The document also outlines steps for developing an ICT system for outcomes monitoring, including identifying needs, researching options, allocating resources, and creating an action plan. It emphasizes the importance of data protection policies and practices.
The Industry’s Move Toward Digitally Connected Clinical TrialsVeeva Systems
The rapid adoption of decentralized trials is causing significant challenges – sites are burdened by too many technologies and the use of multiple patient-facing applications adds complexity for patients.
In these slides, we discuss the implications of decentralized trials, share findings from the Veeva Digital Clinical Trials Survey, and explore how clinical leaders are accelerating digital transformation to make studies more site and patient-centric.
Access the Veeva Digital Clinical Trials Survey Report (https://bit.ly/35eAeDn) for additional insights from more than 280 clinical leaders worldwide on the industry’s progress toward digital trial strategies, lessons learned, and what lies ahead.
StREAM Solutionpath software2, user day, student predcitive analyticsTony Austwick
StREAM presentation to universities at Software2 user day.
Universities can increase revenue and improve social responsibility with end-user predictive analytics.
Full visibility of student engagement
Support attendance and learning journey
Ensure student retention and progression
University big data, analytics and student retention
The adoption of any new technology can be disruptive to one degree or another. If one relies on anecdotal information collecting in the ether, Hadoop and Big Data appear to tip the scale in the direction of “significant” for both impact and complexity. To understand what is really happening, Sand Hill Group surveyed companies working with Hadoop to get a snapshot of the status of their implementation, how Hadoop is being applied and the quality of their experience.
Opening/Framing Comments: John Behrens, Vice President, Center for Digital Data, Analytics, & Adaptive Learning Pearson
Discussion of how the field of educational measurement is changing; how long held assumptions may no longer be taken for granted and that new terminology and language are coming into the.
Panel 1: Beyond the Construct: New Forms of Measurement
This panel presents new views of what assessment can be and new species of big data that push our understanding for what can be used in evidentiary arguments.
Marcia Linn, Lydia Liu from UC Berkeley and ETS discuss continuous assessment of science and new kinds of constructs that relate to collaboration and student reasoning.
John Byrnes from SRI International discusses text and other semi-structured data sources and different methods of analysis.
Kristin Dicerbo from Pearson discusses hidden assessments and the different student interactions and events that can be used in inferential processes.
Panel 2: The Test is Just the Beginning: Assessments Meet Systems Context
This panel looks at how assessments are not the end game, but often the first step in larger big-data practices at districts/state/national levels.
Gerald Tindal from the University of Oregon discusses State data systems and special education, including curriculum-based measurement across geographic settings.
Jack Buckley Commissioner of the National Center for Educational Statistics discussing national datasets where tests and other data connect.
Lindsay Page, Will Marinell from the Strategic Data Project at Harvard discussing state and district datasets used for evaluating teachers, colleges of education, and student progress.
Panel 3: Connecting the Dots: Research Agendas to Integrate Different Worlds
This panel will look at how research organizations are viewing the connections between the perspectives presented in Panels 1 and 2; what is known, what is still yet to be discovered in order to achieve the promised of big connected data in education.
Andrea Conklin Bueschel Program Director at the Spencer Foundation
Ed Dieterle Senior Program Officer at the Bill and Melinda Gates Foundation
Edith Gummer Program Manager at National Science Foundation
Original "Circuit Riders to the Rescue" slide deck by Rob Stuart -- Presented at the annual Council on Foundations conference - dated June 1999
From my archive - Gavin Clabaugh
Building a Foundation for Proactive and Predictive PharmacovigilanceVeeva Systems
Learn how PV teams can easily keep up with evolving compliance requirements with modern safety applications that provide better data control and drive greater efficiencies.
View on-demand session: https://bit.ly/3vIzQG9
Tufts Research: Strategies from Data Management Leaders to Speed Clinical TrialsVeeva Systems
Watch the video here: https://bit.ly/3wChmGQ
Learn how top pharmas and CROs plan to speed database build and data collection, as well as their top challenges and future priorities. In this webinar you'll gain insights into:
* Taking an agile approach to database build
* Reducing UAT timelines with a risk-based approach
* Driving innovation at your organization
This in-depth research from Tufts follows their industry-wide eClinical Landscape Study, examining the major cause of database build delays and their impact on trial cycle times.
Meet Your Presenters:
Ken Getz
Director of Sponsored Programs, Tufts CSDD
Richard Young
Vice President, Vault EDC, Veeva Systems
Clinlogix - Improving Pharmacovigilance Outsourcing with Modern Technologies Veeva Systems
Learn how pharma companies and vendors are collaborating and simplifying processes with modern safety solutions. View the on-demand webinar here: https://bit.ly/30eAlJC
University of Louisville: Improving Compliance with SiteVault eRegulatoryVeeva Systems
The University of Louisville will share how using Veeva SiteVault for managing regulatory documents is improving visibility, compliance, and speeding clinical research operations. Learn more at https://sites.veeva.com/eregulatory-clinical-trials/.
The elements of the development plan
Elements of the quality plan
Development and quality plans for small and for internal projects
Software development risks a
Forget What You THINK You Know about Public Realtions....It's a Whole New Wor...Michael Pranikoff
Presentation by Michael Pranikoff - PR Newswire Director of Emerging Media at the Integrated Marketing Summit in St. Louis in December 2009 - http://www.integratedmarketingsummit.com/events.html
Agile Communications in a Changing World: The “New Nimble” – 2011 Portland Co...Michael Pranikoff
Presentation by PR Newswire Global Director of Emerging Media – Michael Pranikoff at the 2011 Communicators Conference in Portland, OR on May 11, 2011. http://www.pdxcommconf.org/
Social won’t work without search….and today search will be improved by social...Michael Pranikoff
Presentation by PR Newswire Global Director of Emerging Media – Michael Pranikoff – at the IABC 2012 World Congress in Chicago, IL June 2012. Search and social are on a collision course. Google, Bing, Baidu, Sina, and traditional search engines all over the world are adding social components just as Facebook, Twitter, Foursquare, and other popular social tools are seeing their content into search and providing capabilities within their applications. Marketing and communication professionals around the world want to take advantage of the trends, but many are stuck in organizations where the search teams and social teams, let alone the marketing and PR teams, rarely talk. Integrating search and social together can have extraordinary results, increasing the visibility and engagement of your brand, product, or message with your intended audience.
Standards make it easier to create, share, and integrate data by making sure that there is a clear understanding of how the data are represented and that the data you receive are in a form that you expected. Data standards are the rules by which data are described and recorded. In order to share, exchange, and understand data, we must standardize the format as well as the meaning. Simply put, using standards makes using things easier. If different groups are using different data standards, combining data from multiple sources is difficult, if not impossible.
how good quality qualitative data analysis (QDA) can help you identify impacts of your
programs to better meet your objectives and the needs of the community
the steps involved in undertaking basic QDA, including repeated reading, analysis and
interpretation
the value of involving others in the QDA process
the difference between description and interpretation
the value of seeking feedback on your analysis and using triangulation to increase thetrustworthiness of findings
Everyone is talking about the disruption that will impact our work as auditors as businesses deploy technology and analytics at an accelerated pace. The agile auditor is preparing NOW for these changes and acquiring the skills necessary to practice effective analytics.
But, the huge challenge is taking that first step from where auditors are now, to where we want to go.
In this session, Dr. Appelbaum will explain how to start an analytics project by sharing a broad overview of the benefits of analytics and a framework for project creation. Special insights will be provided on data preparation, as this is a major bottleneck for many data projects, along with real case studies to demonstrate the importance of data quality and audit objective alliance.
Learning Objectives
• Learn how to build a framework for an audit analytics project and customize it based on audit objective, data and software tools available
• Discuss the issues of data quality and gain tips to prepare the data for analysis
• See these concepts with real case data and applications of projects that worked
• Have your concerns about getting started with an analytics project and how to successfully complete it addressed
Advanced Project Data Analytics for Improved Project DeliveryMark Constable
Data Analytics is already beginning to impact how projects are delivered. We can now automate minute taking and capturing actions, we can use Flow to progress chase, Power BI reduces the burden of reporting.
But we are just scratching the surface. It won’t be long before we can leverage the rich dataset of experience to predict what risks are likely to occur, understand which WBS elements will be susceptible to variance, deduce what the optimum resource profile looks like, define a schedule by leveraging data from those projects that have gone before.
The role of a project professional is about to change dramatically. In this webinar we will explore the challenges and opportunities, and how we should respond. It’s a call-to-action for the community to mobilise, help to reshape project delivery and understand the implications for you and your organisation.
Presenter Martin Paver is a Chartered Project Professional, APM Fellow and Chartered Engineer. In December 2017 he established the London Project Data Analytics meetup which has quickly spread across the UK and expanded to 3000+ members. Martin has major project experience including leading a $billion projects with a team of 220 and a multi-billion PMO with a team of 50. He has a detailed grasp of project management and combines this with a broad understanding of recent developments in the field of data science. He is on a mission to ensure that the project management profession readies itself for a transformed future.
Learning outcomes:
- Understand the implications of advanced data analytics on project delivery
- Understand the scope of which functions it is likely to impact
- Help you to develop a strategy for how you engage with it
- Understand how to leverage the benefits and opportunities that will emerge from it
Presenter:
Martin Paver, CEO & Founder, Projecting Success Ltd
Tools for improving data publication and usegodanSec
Fiona Smith (Open Data Institute) presented at the 2nd International Workshop: Creating Impact with Open Data in Agriculture and Nutrition in The Hague, 11 September 2015.
Protecting personal data has been an important issue for many years. The EU GDPR extends the data rights of individuals, and requires organizations to develop clear policies and procedures to protect personal data, and adopt appropriate technical and organizational measures. UK organizations have had to comply with the Regulation since 25 May 2018, or potentially face fines of up to 4% of annual turnover or €20 million – whichever is greater.
Learning Outcomes:
This 10 webinar series is intended to elicit a clear understanding of the core elements of the GDPR, with the ability to gain a deeper understanding by asking the trainer questions during the training.
It covers how each aspect of the Regulation can be translated into implementation actions in your organization and the auditor’s role.
Webinar 4
• How to perform a data protection impact assessment (DPIA)
• The role of the data protection officer (DPO)
• Transferring personal data outside the EU
Who's funding what in Kingston upon Thames?Superhighways
Using 360 Giving data, data scientist David Kane explores which grantmakers are funding charitable projects in Kingston and what they are most interested in funding. This presentationswas delivered at the Kingston Data Hack day in Kingston on 12th June 2018.
360 Giving encourages grantmakers to publish their grants data openly, to understand their data and to use the data as part of a more innovative and informed approach to grantmaking. This deck was presented at the Kingston Data Hack day in Kingston on the 12th June 2018.
Evidence borough needs and plan your projects and services with data available on the Kingston Data Observatory. Community organisations in the Royal Borough of Kingston upon Thames can ask for support. This deck was presented at Kingston Data Hack day 2018.
Using Kingston's JSNA data to meet local needSuperhighways
Kingston Council's Public Health team shared how a comprehensive picture of the assessment of current and future health & social care needs of the local population can help communities in Kingston at the Kingston Data Hack day in June 2018.
Exploring small charity data in the Royal Borough of Kingston upon Thames and the data sets, free and low cost digital tools and specialist support organisations that can help.
Superhighways and Kingston Voluntary Action brought together charity professionals and data experts for a day of data discovery.
Infographic from the Alcohol Health Network giving a clear picture of the issues around over use of alcohol. Thanks to Don Shenker from AHN for his permission to use the infographic.
Howard Lake's #Top10Tips for sharings stories on social media to boost fundra...Superhighways
Howard Lake, publisher of the world's first web resource for professional charity fundraisers joined Superhighways first digital conference, Impact Aloud 2014, to talk to small charities and community organisations about using their stories to boost fundraising.
Hounslow 10 ict tools to promote your organisation
Outcomes & ICT KVA Nov 2012
1. ICT for Outcomes Monitoring
27th November 2012
Raising awareness of a range
of ICT tools that can be
deployed to improve the
efficiency and effectiveness of
outcomes monitoring.
2. Session objectives
• Learn how ICT can help with collecting, storing, retrieving and
presenting outcomes information
• Understand more about the processes involved in implementing a
holistic system
• See demonstrations looking at ‘off the shelf' systems selected for
relevance in terms of services, client group and cost
• Start identifying specific tools that will enable you to better capture
information relating to your organisations outcomes
• Draft an action plan to support adoption of these tools over the next
year 6 – 12 months
3. Your current practice
How are you currently using ICT to capture
& evidence Outcomes?
What challenges do you face?
Do you already have ideas for how you can
improve this process?
4. Why ICT can help?
Greater efficiency:
• Automating manual processes
• Reducing paperwork
• Reducing staff time
Greater effectiveness:
• Sharing / accessing information
• Analysing data in more sophisticated ways
• Presenting information with greater impact & to a
wider variety of audiences
5. Collecting Outcomes information
• Online surveys
• Website feedback
• Outreach laptops
• Digital / video cameras
• Dictaphones / mobile phones
• Diaries / blogs
10. Online repositories
• e.g. Huddle, Dropbox, Flickr,
Evernote
• Can be shared with team or external
partners
•Can be accessed from anywhere
including mobile devices
11. Retrieving & analysing
Outcomes info
• Spreadsheets – filtering, sorting,
pivot tables
• Database - queries & reports
• Exporting as csv files & importing to
Excel
15. Developing a system…
First steps
Get together as a team and identify and
agree the what, how, when, why and
then capture this on paper
Remember to include bother outputs and
outcomes
16. Next steps…
Carry out an audit of current systems
– what are you using, what works
well, what frustrates you etc
Document how you are structuring
your information e.g. the ‘fields’ you
are using
Draw up a brief – include some
background and specify what you
need – remember to future proof
17. Next steps…
Then consider…
• Is this something that can be
realistically developed in house?
• If not, research whether a system
already exists to meet your needs?
• If not, budget for the bespoke option
18. Resources required?
Upgraded ICT infrastructure?
A new system or developments to an
existing system?
Data migration or start from scratch?
Staff roles and training?
19.
20. Selecting a database for monitoring
http://www.ces-vol.org.uk/Resources/Charitie
23. Outcomes star
Versions currently available:
Homelessness Star
Mental Health Recovery Star
Teen Star
Alcohol Star
Work Star
Older Person's Star
Family Star
Community Star
Versions currently in development:
Music Therapy Star
Life Star for learning disability
Spectrum Star for autism & aspergers syndrome
Sexual Health Star
Well-being Star
Empowerment Star for domestic violence services
24. Teen Star
This version has been developed for and with teenagers in a
substance misuse setting but should be applicable in
other settings.
Outcome areas (6):
• Drugs and alcohol
• Well-being
• Safety and security
• Structure and education
• Behaviour and citizenship
• Family and other key adults
These link to the five high-level Every Child Matters
(ECM) outcomes….
25. Evidencing outcomes at different
levels
The Outcomes Star can provide outcomes data at four levels:
For individual service users: the Star gives a snapshot of where they were on
each outcome area when they joined the project and at each review – the difference
between starting point and review shows the progress made in that time.
For a project as a whole: the average starting points on entry to the service and
the amount of progress made in a specified time period or over their life-time in the
project can be calculated – this gives a picture of the project outcomes. The
Outcomes Star™ online can provide this information at the touch of a button.
For a group of projects across an organisation: the same information as above
can be calculated for each project allowing comparison between different services.
In addition users of the Outcomes Star™ online can compare the progress made by
different sub-groups of clients, for example women and men or older and younger
service users.
For similar projects across a sector: the same analyses as described above can
be carried out for a sector as a whole. This makes it possible to establish
benchmarks identifying good practice and building an outcomes-focused evidence
base. This is only possible using the Outcomes Star™ online.
30. Developing an action plan
Outcomes & indicators
Using ICT to capture / present this
information
Resources required – infrastructure &
skills
Allocating responsibility / setting a
timeline
31. Best practice issues
Are you registered with the information
commissioner?
www.informationcommissioner.gov.uk
Do you have a data protection & privacy
policy and explain why you collect data
and what it will be used for?
Do you ask for permission to use
photos / videos?
Is your client data secure i.e. password
protected, backed up, safeguarded with
anti virus software and a firewall?
32. For more help contact:
Superhighways
0208 255 8040
katewhite@superhighways.org.uk
Editor's Notes
13.45: As people arrive, teas, coffees 14.00: Welcome: Housekeeping
14.20 Presentation: What is monitoring, what is evaluation? Monitoring: ongoing data gathering, e.g. to see if things are on track. Evaluation: end of project (or other key point). Analysis of what you have collected. Full scale detailed process to judge the value of a project or service, using the information gathered through monitoring