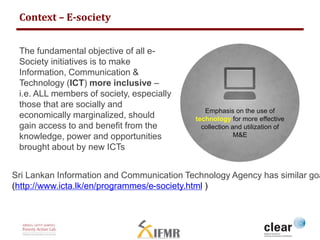
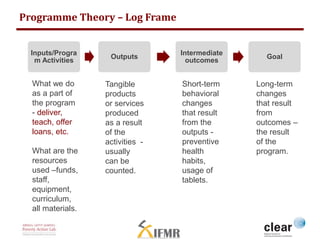
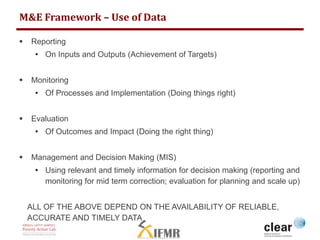
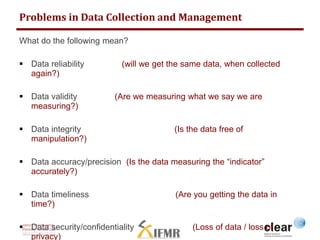
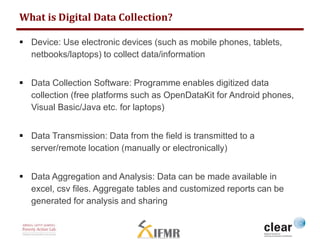
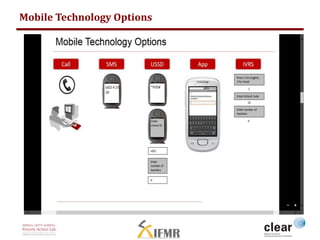
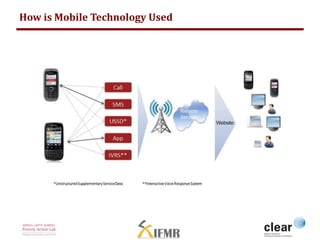
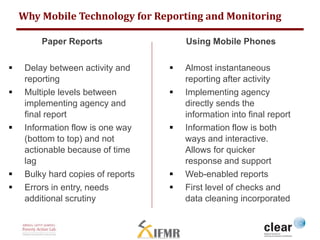
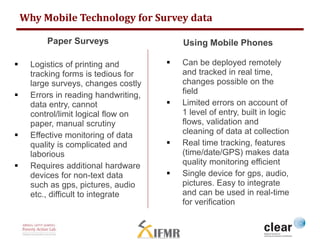
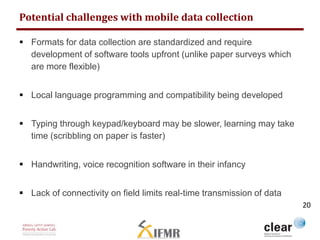
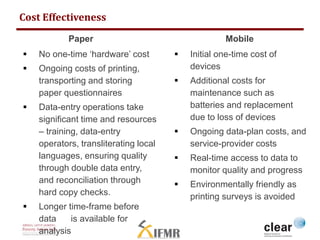
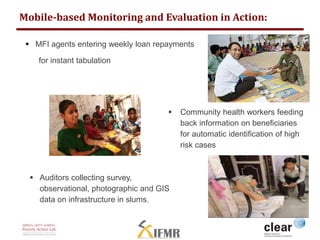
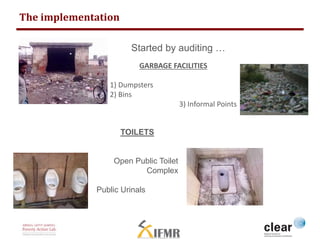
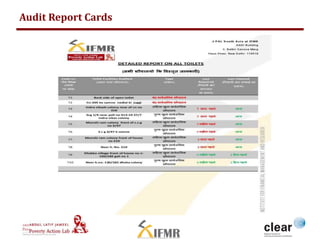
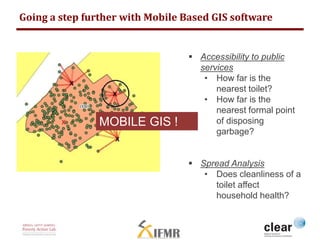
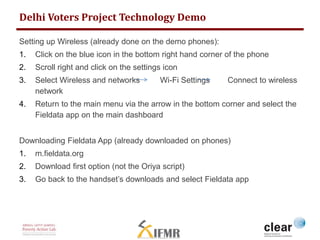
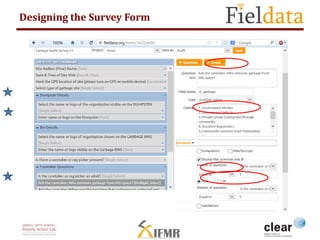
Going Digital: Use of Mobile Technology 
for Collecting Monitoring and Evaluation 
Data
Overview 
 Introduction 
 Log Frames and M&E 
 Why digital/mobile data collection 
 Types of Mobile Data collection – Examples 
 Demo
INTRODUCTION
CLEAR South Asia Mandate 
 CLEAR South Asia strategy 
includes a focus on the use of 
cutting-edge technology for 
effective collection and utilization 
of M&E 
 In collaboration with 
Fieldata.Org, CLEAR South Asia 
aims to promote the use of M&E 
technology, such as mobile 
phones and PDAs, for more real-time 
aggregation and effective 
utilization of M&E.
Context – E-society 
Emphasis on the use of 
technology for more effective 
collection and utilization of 
M&E 
The fundamental objective of all e- 
Society initiatives is to make 
Information, Communication & 
Technology (ICT) more inclusive – 
i.e. ALL members of society, especially 
those that are socially and 
economically marginalized, should 
gain access to and benefit from the 
knowledge, power and opportunities 
brought about by new ICTs 
Sri Lankan Information and Communication Technology Agency has similar goals 
(http://www.icta.lk/en/programmes/e-society.html )
About Fieldata.org 
Fieldata.Org is a mobile-&-web portal for NGOs to raise funds, by 
offering real-time monitoring, and objective data for evaluation. 
Mission is to improve transparency & decision-making in development 
organizations and government agencies, by empowering them with 
technology-tools for better monitoring, sharing, and application of data. 
Want organizations and donors to objectively answer: 
• Which projects should resources be allocated? 
• How well do projects utilize these resources?
About Fieldata.org
LOG FRAMES & M&E
Programme Theory – Log Frame 
Inputs/Progra 
m Activities 
Outputs 
Intermediate 
outcomes 
Goal 
What we do 
as a part of 
the program 
- deliver, 
teach, offer 
loans, etc. 
What are the 
resources 
used –funds, 
staff, 
equipment, 
curriculum, 
all materials. 
Tangible 
products 
or services 
produced 
as a result 
of the 
activities - 
usually 
can be 
counted. 
Short-term 
behavioral 
changes 
that result 
from the 
outputs - 
preventive 
health 
habits, 
usage of 
tablets. 
Long-term 
changes 
that result 
from 
outcomes – 
the result 
of the 
program.
M&E Framework – Use of Data 
 Reporting 
• On Inputs and Outputs (Achievement of Targets) 
 Monitoring 
• Of Processes and Implementation (Doing things right) 
 Evaluation 
• Of Outcomes and Impact (Doing the right thing) 
 Management and Decision Making (MIS) 
• Using relevant and timely information for decision making (reporting and 
monitoring for mid term correction; evaluation for planning and scale up) 
ALL OF THE ABOVE DEPEND ON THE AVAILABILITY OF RELIABLE, 
ACCURATE AND TIMELY DATA
Problems in Data Collection and Management 
What do the following mean? 
 Data reliability (will we get the same data, when collected 
again?) 
 Data validity (Are we measuring what we say we are 
measuring?) 
 Data integrity (Is the data free of 
manipulation?) 
 Data accuracy/precision (Is the data measuring the “indicator” 
accurately?) 
 Data timeliness (Are you getting the data in 
time?) 
 Data security/confidentiality (Loss of data / loss of 
privacy)
WHY DIGITAL DATA 
COLLECTION?
What is Digital Data Collection? 
 Device: Use electronic devices (such as mobile phones, tablets, 
netbooks/laptops) to collect data/information 
 Data Collection Software: Programme enables digitized data 
collection (free platforms such as OpenDataKit for Android phones, 
Visual Basic/Java etc. for laptops) 
 Data Transmission: Data from the field is transmitted to a 
server/remote location (manually or electronically) 
 Data Aggregation and Analysis: Data can be made available in 
excel, csv files. Aggregate tables and customized reports can be 
generated for analysis and sharing
Why use Mobile Technology in Evaluations 
 Improving transparency & accountability in development 
organizations and government agencies, though technology-enabled 
M&E for better monitoring, sharing, and application of 
data. 
 Enabling organizations, donors and citizens to use M&E data for 
real-time decision-making, better implementation and delivery of 
projects and services
Mobile Technology Options
How is Mobile Technology Used
Why Mobile Data Collection? 
 Real-time data from the point of collection 
 Built-in logical flow and validation checks improves data quality 
 Ability to collect new types of data – Location (GIS), media (pictures, 
audio) 
 Cost effective over time- involves one-time hardware costs and 
ongoing maintenance. No paper, printing costs 
 Easy to manage and analyze large amounts of data 
 Reduces intermediate levels of data transmission
Why Mobile Technology for Reporting and Monitoring 
Paper Reports 
 Delay between activity and 
reporting 
 Multiple levels between 
implementing agency and 
final report 
 Information flow is one way 
(bottom to top) and not 
actionable because of time 
lag 
 Bulky hard copies of reports 
 Errors in entry, needs 
additional scrutiny 
Using Mobile Phones 
 Almost instantaneous 
reporting after activity 
 Implementing agency 
directly sends the 
information into final report 
 Information flow is both 
ways and interactive. 
Allows for quicker 
response and support 
 Web-enabled reports 
 First level of checks and 
data cleaning incorporated
Why Mobile Technology for Survey data 
Paper Surveys 
 Logistics of printing and 
tracking forms is tedious for 
large surveys, changes costly 
 Errors in reading handwriting, 
data entry, cannot 
control/limit logical flow on 
paper, manual scrutiny 
 Effective monitoring of data 
quality is complicated and 
laborious 
 Requires additional hardware 
devices for non-text data 
such as gps, pictures, audio 
etc., difficult to integrate 
Using Mobile Phones 
 Can be deployed remotely 
and tracked in real time, 
changes possible on the 
field 
 Limited errors on account of 
1 level of entry, built in logic 
flows, validation and 
cleaning of data at collection 
 Real time tracking, features 
(time/date/GPS) makes data 
quality monitoring efficient 
 Single device for gps, audio, 
pictures. Easy to integrate 
and can be used in real-time 
for verification
Potential challenges with mobile data collection 
 Formats for data collection are standardized and require 
development of software tools upfront (unlike paper surveys which 
are more flexible) 
 Local language programming and compatibility being developed 
 Typing through keypad/keyboard may be slower, learning may take 
time (scribbling on paper is faster) 
 Handwriting, voice recognition software in their infancy 
 Lack of connectivity on field limits real-time transmission of data 
20
Mobile 
 Initial one-time cost of 
devices 
 Additional costs for 
maintenance such as 
batteries and replacement 
due to loss of devices 
 Ongoing data-plan costs, and 
service-provider costs 
 Real-time access to data to 
monitor quality and progress 
 Environmentally friendly as 
printing surveys is avoided 
Cost Effectiveness 
Paper 
 No one-time ‘hardware’ cost 
 Ongoing costs of printing, 
transporting and storing 
paper questionnaires 
 Data-entry operations take 
significant time and resources 
– training, data-entry 
operators, transliterating local 
languages, ensuring quality 
through double data entry, 
and reconciliation through 
hard copy checks. 
 Longer time-frame before 
data is available for 
analysis
Examples 
TYPES OF MOBILE DATA 
COLLECTION
Data Quality & Real-time Data for Monitoring Purposes 
Quick & Easy Set 
up: 
 Improving: 
• Data quality 
• Speed 
• Transparency 
• Accessibility 
• Flexibility
Mobile-based Monitoring and Evaluation in Action: 
 MFI agents entering weekly loan repayments 
for instant tabulation 
 Community health workers feeding 
back information on beneficiaries 
for automatic identification of high 
risk cases 
 Auditors collecting survey, 
observational, photographic and GIS 
data on infrastructure in slums.
Use of Mobile-based Technology in M&E 
REPORTING/MIS 
 Routine (Real-time) reporting 
• Weekly loan repayment information of MFI clients reporting by field 
staff 
MONITORING 
 Ongoing program monitoring 
• Beneficiary information collected and sent by health workers (for 
disease surveillance, delivery of benefits etc.) 
 Occasional (Surprise) checks 
• Spot checks by supervisors to monitor attendance and performance 
of staff 
EVALUATION 
 Survey data 
• Household survey data to assess impact of <<xx>> program
Use of Mobile Technology as key intervention in Programs 
 Information/Messages 
• SMS reminders to beneficiaries about important health activities 
(treatment compliance) 
 Implementation Tools 
• Videos and online teaching aids used in schools for regular or 
remedial education programs 
 Biometric, GIS information 
• Record beneficiary information for easier tracking and follow up. 
Complementarities with other programs by same organization
Case Study: Delhi Voters Project 
 Project description and objectives 
• An RCT evaluating whether providing information to government 
officials and slum dwellers can lead to higher accountability and 
thereby improved service delivery. 
 Interventions evaluated: 
• The effect of providing information on spending and quality of 
public services delivered by elected officials during election 
sensitive periods
Role of mobile-based data collection 
 The intervention 
• Field-based audits of public services in slums using mobile-based 
technology 
• Surveys and observations 
• Photographs 
• GIS indicators 
• Send report cards to elected representatives highlighting the 
quality and access to public services in their area
The implementation 
Started by auditing … 
GARBAGE FACILITIES 
1) Dumpsters 
2) Bins 
3) Informal Points 
TOILETS 
Open Public Toilet 
Complex 
Public Urinals
Audit Report Cards
Going a step further with Mobile Based GIS software 
 Accessibility to public 
services 
• How far is the 
nearest toilet? 
• How far is the 
nearest formal point 
of disposing 
garbage? 
 Spread Analysis 
• Does cleanliness of a 
toilet affect 
household health? 
MOBILE GIS !
DEMO
Delhi Voters Project Technology Demo 
Setting up Wireless (already done on the demo phones): 
1. Click on the blue icon in the bottom right hand corner of the phone 
2. Scroll right and click on the settings icon 
3. Select Wireless and networks Wi-Fi Settings Connect to wireless 
network 
4. Return to the main menu via the arrow in the bottom corner and select the 
Fieldata app on the main dashboard 
Downloading Fieldata App (already downloaded on phones) 
1. m.fieldata.org 
2. Download first option (not the Oriya script) 
3. Go back to the handset’s downloads and select Fieldata app
Designing the Survey Form
Filling out the Form 
Select 
Fill Blank 
Form 
Garbage Audit V3 
TAKE 5-10 minutes to fill out the form. Take note of the “logic 
and control features” built into the survey form.
Filling out the Form 
Key Features: 
1. Compulsory Questions 
2. Grouping – (Repeats & Loops) 
3. Location – Mapping 
4. Skips & Branching 
5. Photo 
6. Multiple question types (GPS, photos, audio/video) to cover 
information not possible on paper
Editing or Sending Form 
Edit Saved 
Form 
1. Edit and Check your data by selecting 
2. See all your answer and change them and save these changes if you want 
Send Finalized 
Form 
3. Finally 
4. Mark the tick box green of your Saved Survey 
5. Press “Send Selected” 
6. Username: ClearSA (press Next). 
7. Password: IFMR 
8. Upload Results message saying: “Garbage Audit Survey v3 – Success” 
9. Log on to immediately view your data on a map & as graphs! 
www.fieldata.org
How much Time, Money and Effort Does it Take? 
Less than what it is costing you now!

Digital Data Collection

  • 1.
    Going Digital: Useof Mobile Technology for Collecting Monitoring and Evaluation Data
  • 2.
    Overview  Introduction  Log Frames and M&E  Why digital/mobile data collection  Types of Mobile Data collection – Examples  Demo
  • 3.
  • 4.
    CLEAR South AsiaMandate  CLEAR South Asia strategy includes a focus on the use of cutting-edge technology for effective collection and utilization of M&E  In collaboration with Fieldata.Org, CLEAR South Asia aims to promote the use of M&E technology, such as mobile phones and PDAs, for more real-time aggregation and effective utilization of M&E.
  • 5.
    Context – E-society Emphasis on the use of technology for more effective collection and utilization of M&E The fundamental objective of all e- Society initiatives is to make Information, Communication & Technology (ICT) more inclusive – i.e. ALL members of society, especially those that are socially and economically marginalized, should gain access to and benefit from the knowledge, power and opportunities brought about by new ICTs Sri Lankan Information and Communication Technology Agency has similar goals (http://www.icta.lk/en/programmes/e-society.html )
  • 6.
    About Fieldata.org Fieldata.Orgis a mobile-&-web portal for NGOs to raise funds, by offering real-time monitoring, and objective data for evaluation. Mission is to improve transparency & decision-making in development organizations and government agencies, by empowering them with technology-tools for better monitoring, sharing, and application of data. Want organizations and donors to objectively answer: • Which projects should resources be allocated? • How well do projects utilize these resources?
  • 7.
  • 8.
  • 9.
    Programme Theory –Log Frame Inputs/Progra m Activities Outputs Intermediate outcomes Goal What we do as a part of the program - deliver, teach, offer loans, etc. What are the resources used –funds, staff, equipment, curriculum, all materials. Tangible products or services produced as a result of the activities - usually can be counted. Short-term behavioral changes that result from the outputs - preventive health habits, usage of tablets. Long-term changes that result from outcomes – the result of the program.
  • 10.
    M&E Framework –Use of Data  Reporting • On Inputs and Outputs (Achievement of Targets)  Monitoring • Of Processes and Implementation (Doing things right)  Evaluation • Of Outcomes and Impact (Doing the right thing)  Management and Decision Making (MIS) • Using relevant and timely information for decision making (reporting and monitoring for mid term correction; evaluation for planning and scale up) ALL OF THE ABOVE DEPEND ON THE AVAILABILITY OF RELIABLE, ACCURATE AND TIMELY DATA
  • 11.
    Problems in DataCollection and Management What do the following mean?  Data reliability (will we get the same data, when collected again?)  Data validity (Are we measuring what we say we are measuring?)  Data integrity (Is the data free of manipulation?)  Data accuracy/precision (Is the data measuring the “indicator” accurately?)  Data timeliness (Are you getting the data in time?)  Data security/confidentiality (Loss of data / loss of privacy)
  • 12.
    WHY DIGITAL DATA COLLECTION?
  • 13.
    What is DigitalData Collection?  Device: Use electronic devices (such as mobile phones, tablets, netbooks/laptops) to collect data/information  Data Collection Software: Programme enables digitized data collection (free platforms such as OpenDataKit for Android phones, Visual Basic/Java etc. for laptops)  Data Transmission: Data from the field is transmitted to a server/remote location (manually or electronically)  Data Aggregation and Analysis: Data can be made available in excel, csv files. Aggregate tables and customized reports can be generated for analysis and sharing
  • 14.
    Why use MobileTechnology in Evaluations  Improving transparency & accountability in development organizations and government agencies, though technology-enabled M&E for better monitoring, sharing, and application of data.  Enabling organizations, donors and citizens to use M&E data for real-time decision-making, better implementation and delivery of projects and services
  • 15.
  • 16.
    How is MobileTechnology Used
  • 17.
    Why Mobile DataCollection?  Real-time data from the point of collection  Built-in logical flow and validation checks improves data quality  Ability to collect new types of data – Location (GIS), media (pictures, audio)  Cost effective over time- involves one-time hardware costs and ongoing maintenance. No paper, printing costs  Easy to manage and analyze large amounts of data  Reduces intermediate levels of data transmission
  • 18.
    Why Mobile Technologyfor Reporting and Monitoring Paper Reports  Delay between activity and reporting  Multiple levels between implementing agency and final report  Information flow is one way (bottom to top) and not actionable because of time lag  Bulky hard copies of reports  Errors in entry, needs additional scrutiny Using Mobile Phones  Almost instantaneous reporting after activity  Implementing agency directly sends the information into final report  Information flow is both ways and interactive. Allows for quicker response and support  Web-enabled reports  First level of checks and data cleaning incorporated
  • 19.
    Why Mobile Technologyfor Survey data Paper Surveys  Logistics of printing and tracking forms is tedious for large surveys, changes costly  Errors in reading handwriting, data entry, cannot control/limit logical flow on paper, manual scrutiny  Effective monitoring of data quality is complicated and laborious  Requires additional hardware devices for non-text data such as gps, pictures, audio etc., difficult to integrate Using Mobile Phones  Can be deployed remotely and tracked in real time, changes possible on the field  Limited errors on account of 1 level of entry, built in logic flows, validation and cleaning of data at collection  Real time tracking, features (time/date/GPS) makes data quality monitoring efficient  Single device for gps, audio, pictures. Easy to integrate and can be used in real-time for verification
  • 20.
    Potential challenges withmobile data collection  Formats for data collection are standardized and require development of software tools upfront (unlike paper surveys which are more flexible)  Local language programming and compatibility being developed  Typing through keypad/keyboard may be slower, learning may take time (scribbling on paper is faster)  Handwriting, voice recognition software in their infancy  Lack of connectivity on field limits real-time transmission of data 20
  • 21.
    Mobile  Initialone-time cost of devices  Additional costs for maintenance such as batteries and replacement due to loss of devices  Ongoing data-plan costs, and service-provider costs  Real-time access to data to monitor quality and progress  Environmentally friendly as printing surveys is avoided Cost Effectiveness Paper  No one-time ‘hardware’ cost  Ongoing costs of printing, transporting and storing paper questionnaires  Data-entry operations take significant time and resources – training, data-entry operators, transliterating local languages, ensuring quality through double data entry, and reconciliation through hard copy checks.  Longer time-frame before data is available for analysis
  • 22.
    Examples TYPES OFMOBILE DATA COLLECTION
  • 23.
    Data Quality &Real-time Data for Monitoring Purposes Quick & Easy Set up:  Improving: • Data quality • Speed • Transparency • Accessibility • Flexibility
  • 24.
    Mobile-based Monitoring andEvaluation in Action:  MFI agents entering weekly loan repayments for instant tabulation  Community health workers feeding back information on beneficiaries for automatic identification of high risk cases  Auditors collecting survey, observational, photographic and GIS data on infrastructure in slums.
  • 25.
    Use of Mobile-basedTechnology in M&E REPORTING/MIS  Routine (Real-time) reporting • Weekly loan repayment information of MFI clients reporting by field staff MONITORING  Ongoing program monitoring • Beneficiary information collected and sent by health workers (for disease surveillance, delivery of benefits etc.)  Occasional (Surprise) checks • Spot checks by supervisors to monitor attendance and performance of staff EVALUATION  Survey data • Household survey data to assess impact of <<xx>> program
  • 26.
    Use of MobileTechnology as key intervention in Programs  Information/Messages • SMS reminders to beneficiaries about important health activities (treatment compliance)  Implementation Tools • Videos and online teaching aids used in schools for regular or remedial education programs  Biometric, GIS information • Record beneficiary information for easier tracking and follow up. Complementarities with other programs by same organization
  • 27.
    Case Study: DelhiVoters Project  Project description and objectives • An RCT evaluating whether providing information to government officials and slum dwellers can lead to higher accountability and thereby improved service delivery.  Interventions evaluated: • The effect of providing information on spending and quality of public services delivered by elected officials during election sensitive periods
  • 28.
    Role of mobile-baseddata collection  The intervention • Field-based audits of public services in slums using mobile-based technology • Surveys and observations • Photographs • GIS indicators • Send report cards to elected representatives highlighting the quality and access to public services in their area
  • 29.
    The implementation Startedby auditing … GARBAGE FACILITIES 1) Dumpsters 2) Bins 3) Informal Points TOILETS Open Public Toilet Complex Public Urinals
  • 30.
  • 31.
    Going a stepfurther with Mobile Based GIS software  Accessibility to public services • How far is the nearest toilet? • How far is the nearest formal point of disposing garbage?  Spread Analysis • Does cleanliness of a toilet affect household health? MOBILE GIS !
  • 32.
  • 33.
    Delhi Voters ProjectTechnology Demo Setting up Wireless (already done on the demo phones): 1. Click on the blue icon in the bottom right hand corner of the phone 2. Scroll right and click on the settings icon 3. Select Wireless and networks Wi-Fi Settings Connect to wireless network 4. Return to the main menu via the arrow in the bottom corner and select the Fieldata app on the main dashboard Downloading Fieldata App (already downloaded on phones) 1. m.fieldata.org 2. Download first option (not the Oriya script) 3. Go back to the handset’s downloads and select Fieldata app
  • 34.
  • 35.
    Filling out theForm Select Fill Blank Form Garbage Audit V3 TAKE 5-10 minutes to fill out the form. Take note of the “logic and control features” built into the survey form.
  • 36.
    Filling out theForm Key Features: 1. Compulsory Questions 2. Grouping – (Repeats & Loops) 3. Location – Mapping 4. Skips & Branching 5. Photo 6. Multiple question types (GPS, photos, audio/video) to cover information not possible on paper
  • 37.
    Editing or SendingForm Edit Saved Form 1. Edit and Check your data by selecting 2. See all your answer and change them and save these changes if you want Send Finalized Form 3. Finally 4. Mark the tick box green of your Saved Survey 5. Press “Send Selected” 6. Username: ClearSA (press Next). 7. Password: IFMR 8. Upload Results message saying: “Garbage Audit Survey v3 – Success” 9. Log on to immediately view your data on a map & as graphs! www.fieldata.org
  • 38.
    How much Time,Money and Effort Does it Take? Less than what it is costing you now!

Editor's Notes

  • #6 Raise awareness within society about the uses and benefits of ICT through a strategic communications campaign. Develop multi-stakeholder partnerships in ICT4D. These partnerships will network ICTA to other organizations and institutions that are engaged in promoting an e-Society. Establish a fund that will adopt a bottom up approach to develop innovative technology solutions using ICT to benefit rural poor, women, displaced persons.