Download to read offline
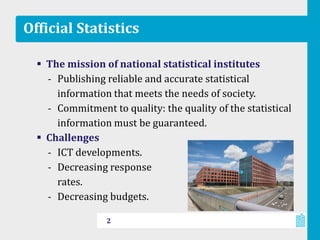
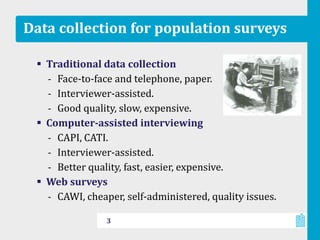
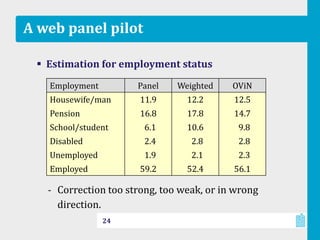

This document discusses the use of web panels for official statistics. It addresses challenges like under-coverage of populations without internet access, non-representative self-selection recruitment, high nonresponse rates, and potential measurement errors with self-administered surveys. Probability sampling recruitment from other surveys could help address some issues but may result in a selective panel. More research is also needed on reducing biases from nonresponse and measurement errors in web panels for official statistics.


