Downloaded 136 times

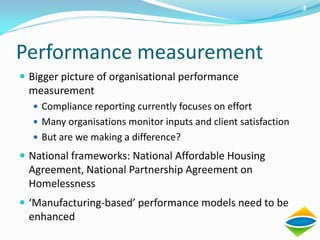
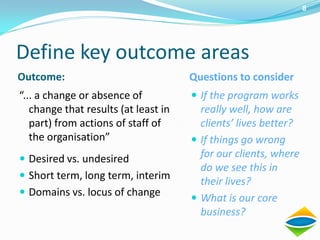
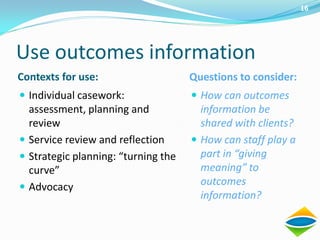
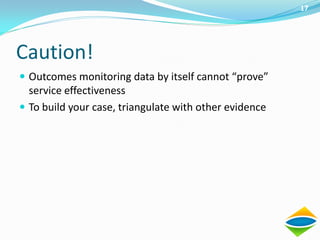
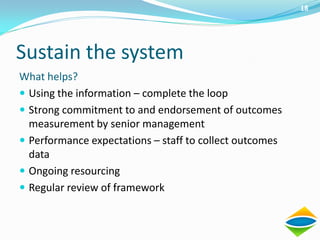


The document discusses the performance measurement and compliance reporting in Australia's homelessness assistance sector, emphasizing the need to assess the actual impact on clients' lives rather than merely tracking input and satisfaction levels. It highlights the importance of defining key outcome areas, implementing effective data collection and analysis processes, and utilizing the information for continual improvement and strategic planning. It also acknowledges the challenges and risks associated with outcome measurement systems while providing resources and recommendations for better practices.