


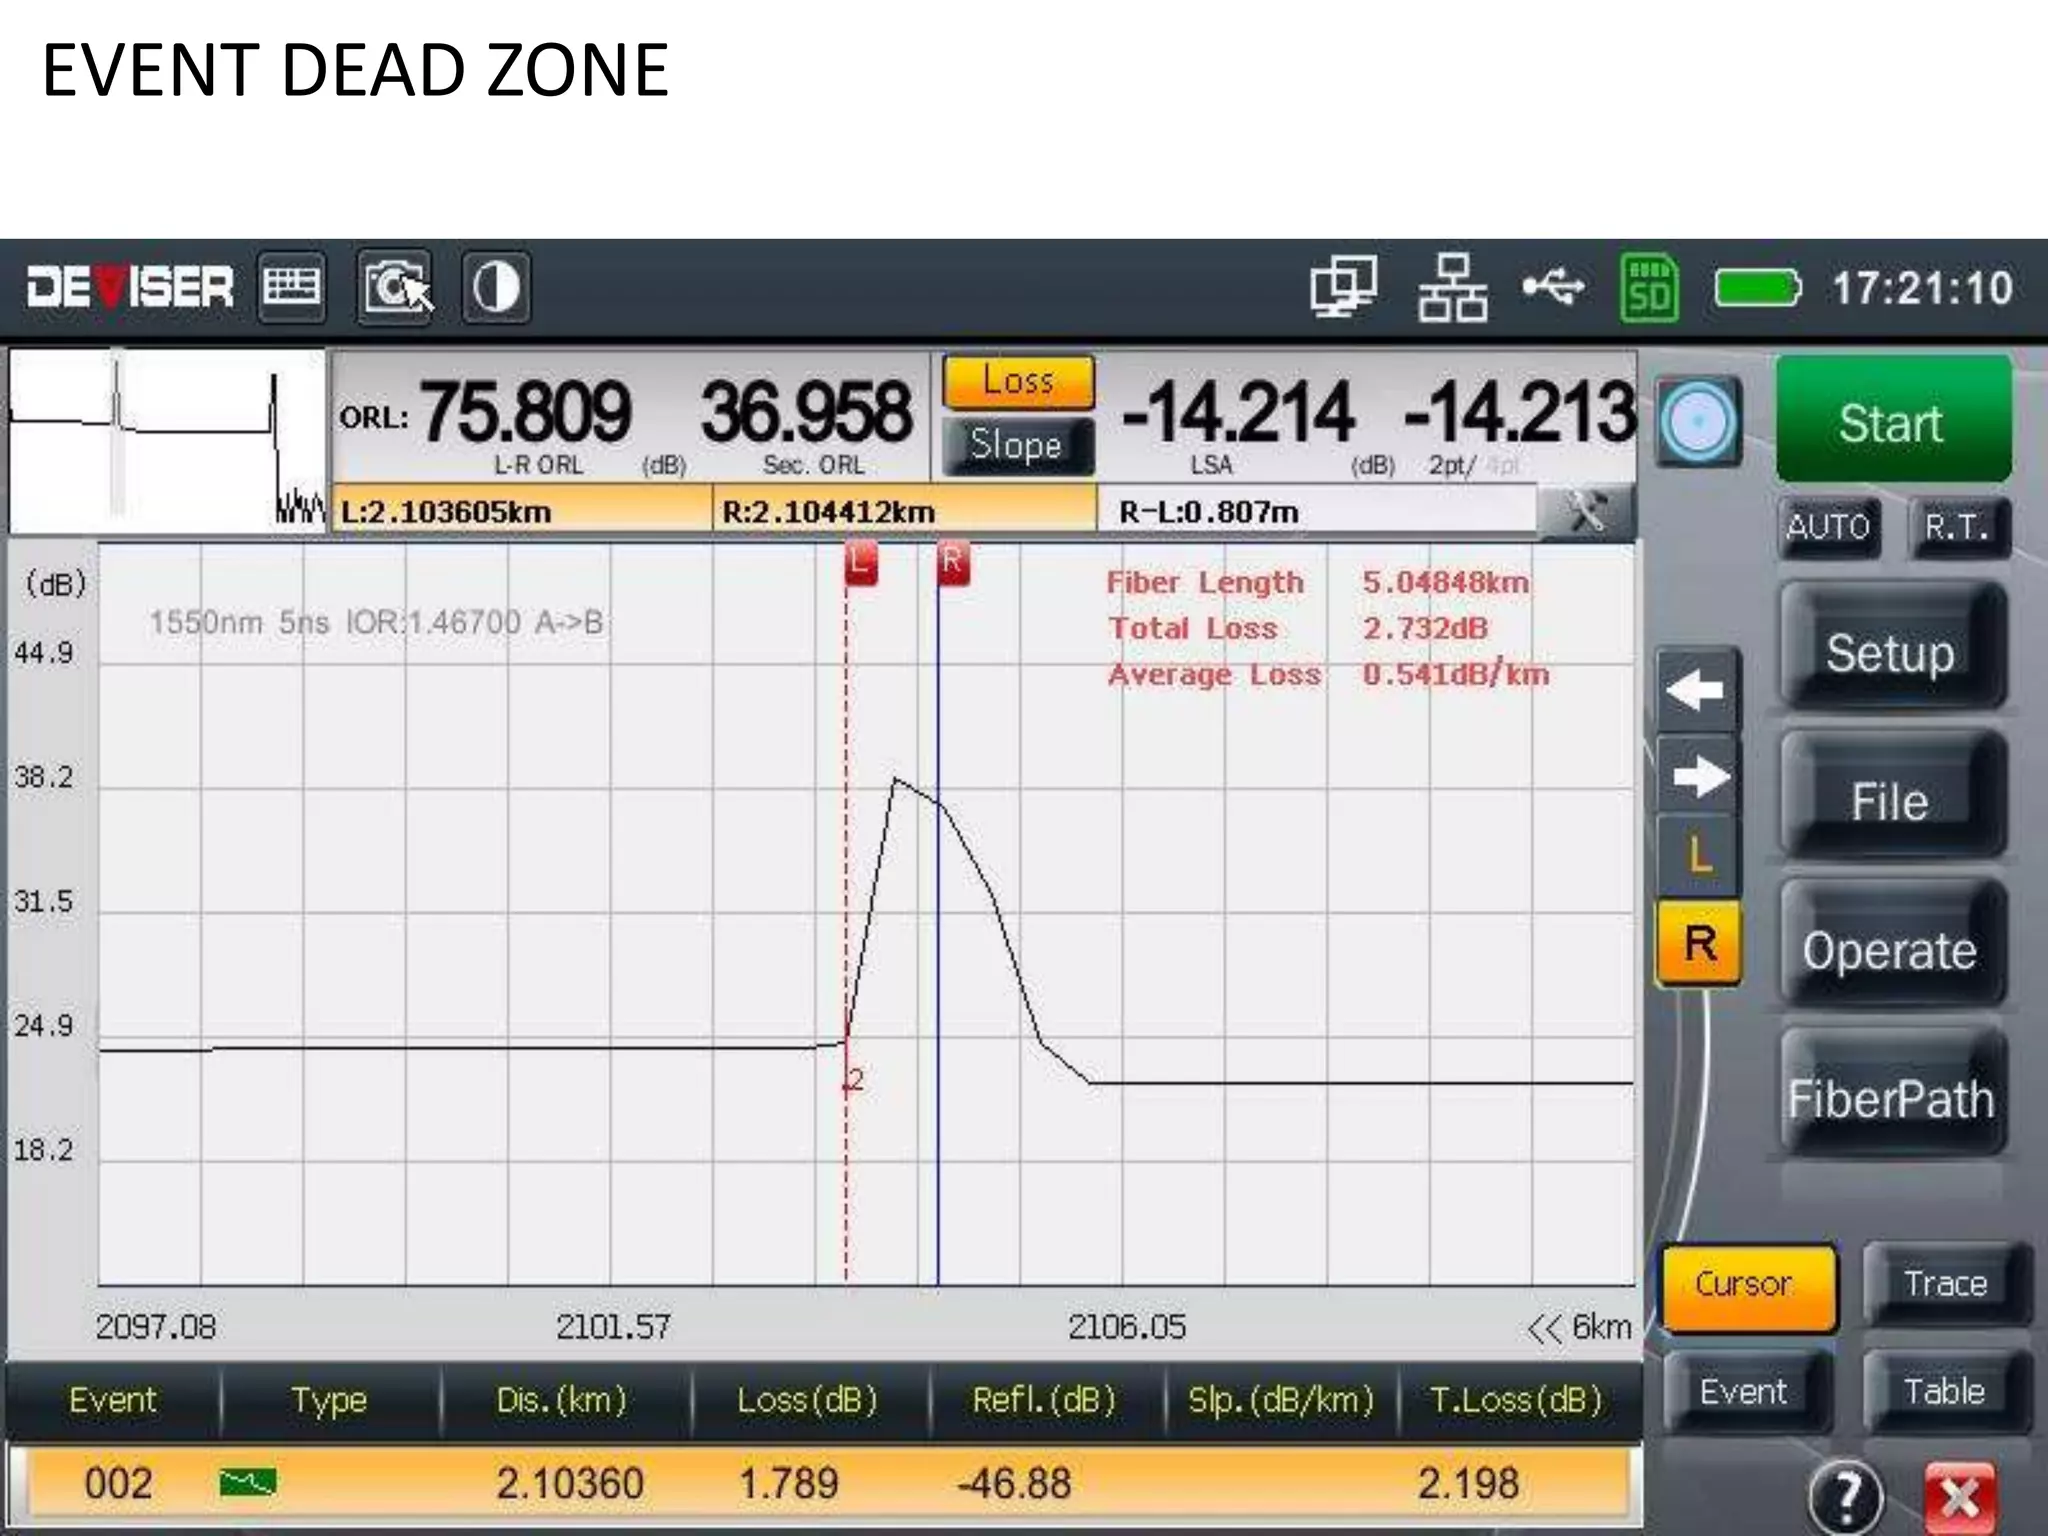
![●Connection Loss
When fibers connecting, the light enter from (P1) to (P2) there some losses will
be occur whether it connected through splice or connector.
P1
P2
[d B]L=-10log
10
Entering Light Power
P1
Outgoing Light Power
P2
LOSS(dB) Transmittance(%)
0.01 0.998
0.05 0.989
0.10 0.977
0.20 0.955
0.30 0.933
0.40 0.912
0.50 0.891
1.00 0.794
→ Fusion Splicing(Avg.)
→ Connector Loss(Avg.)
→ Connector Loss(Max.)](https://image.slidesharecdn.com/otdrslideshare-200420044117/75/OTDR-OPTICAL-TIME-DOMAIN-REFLECTOMETER-8-2048.jpg)
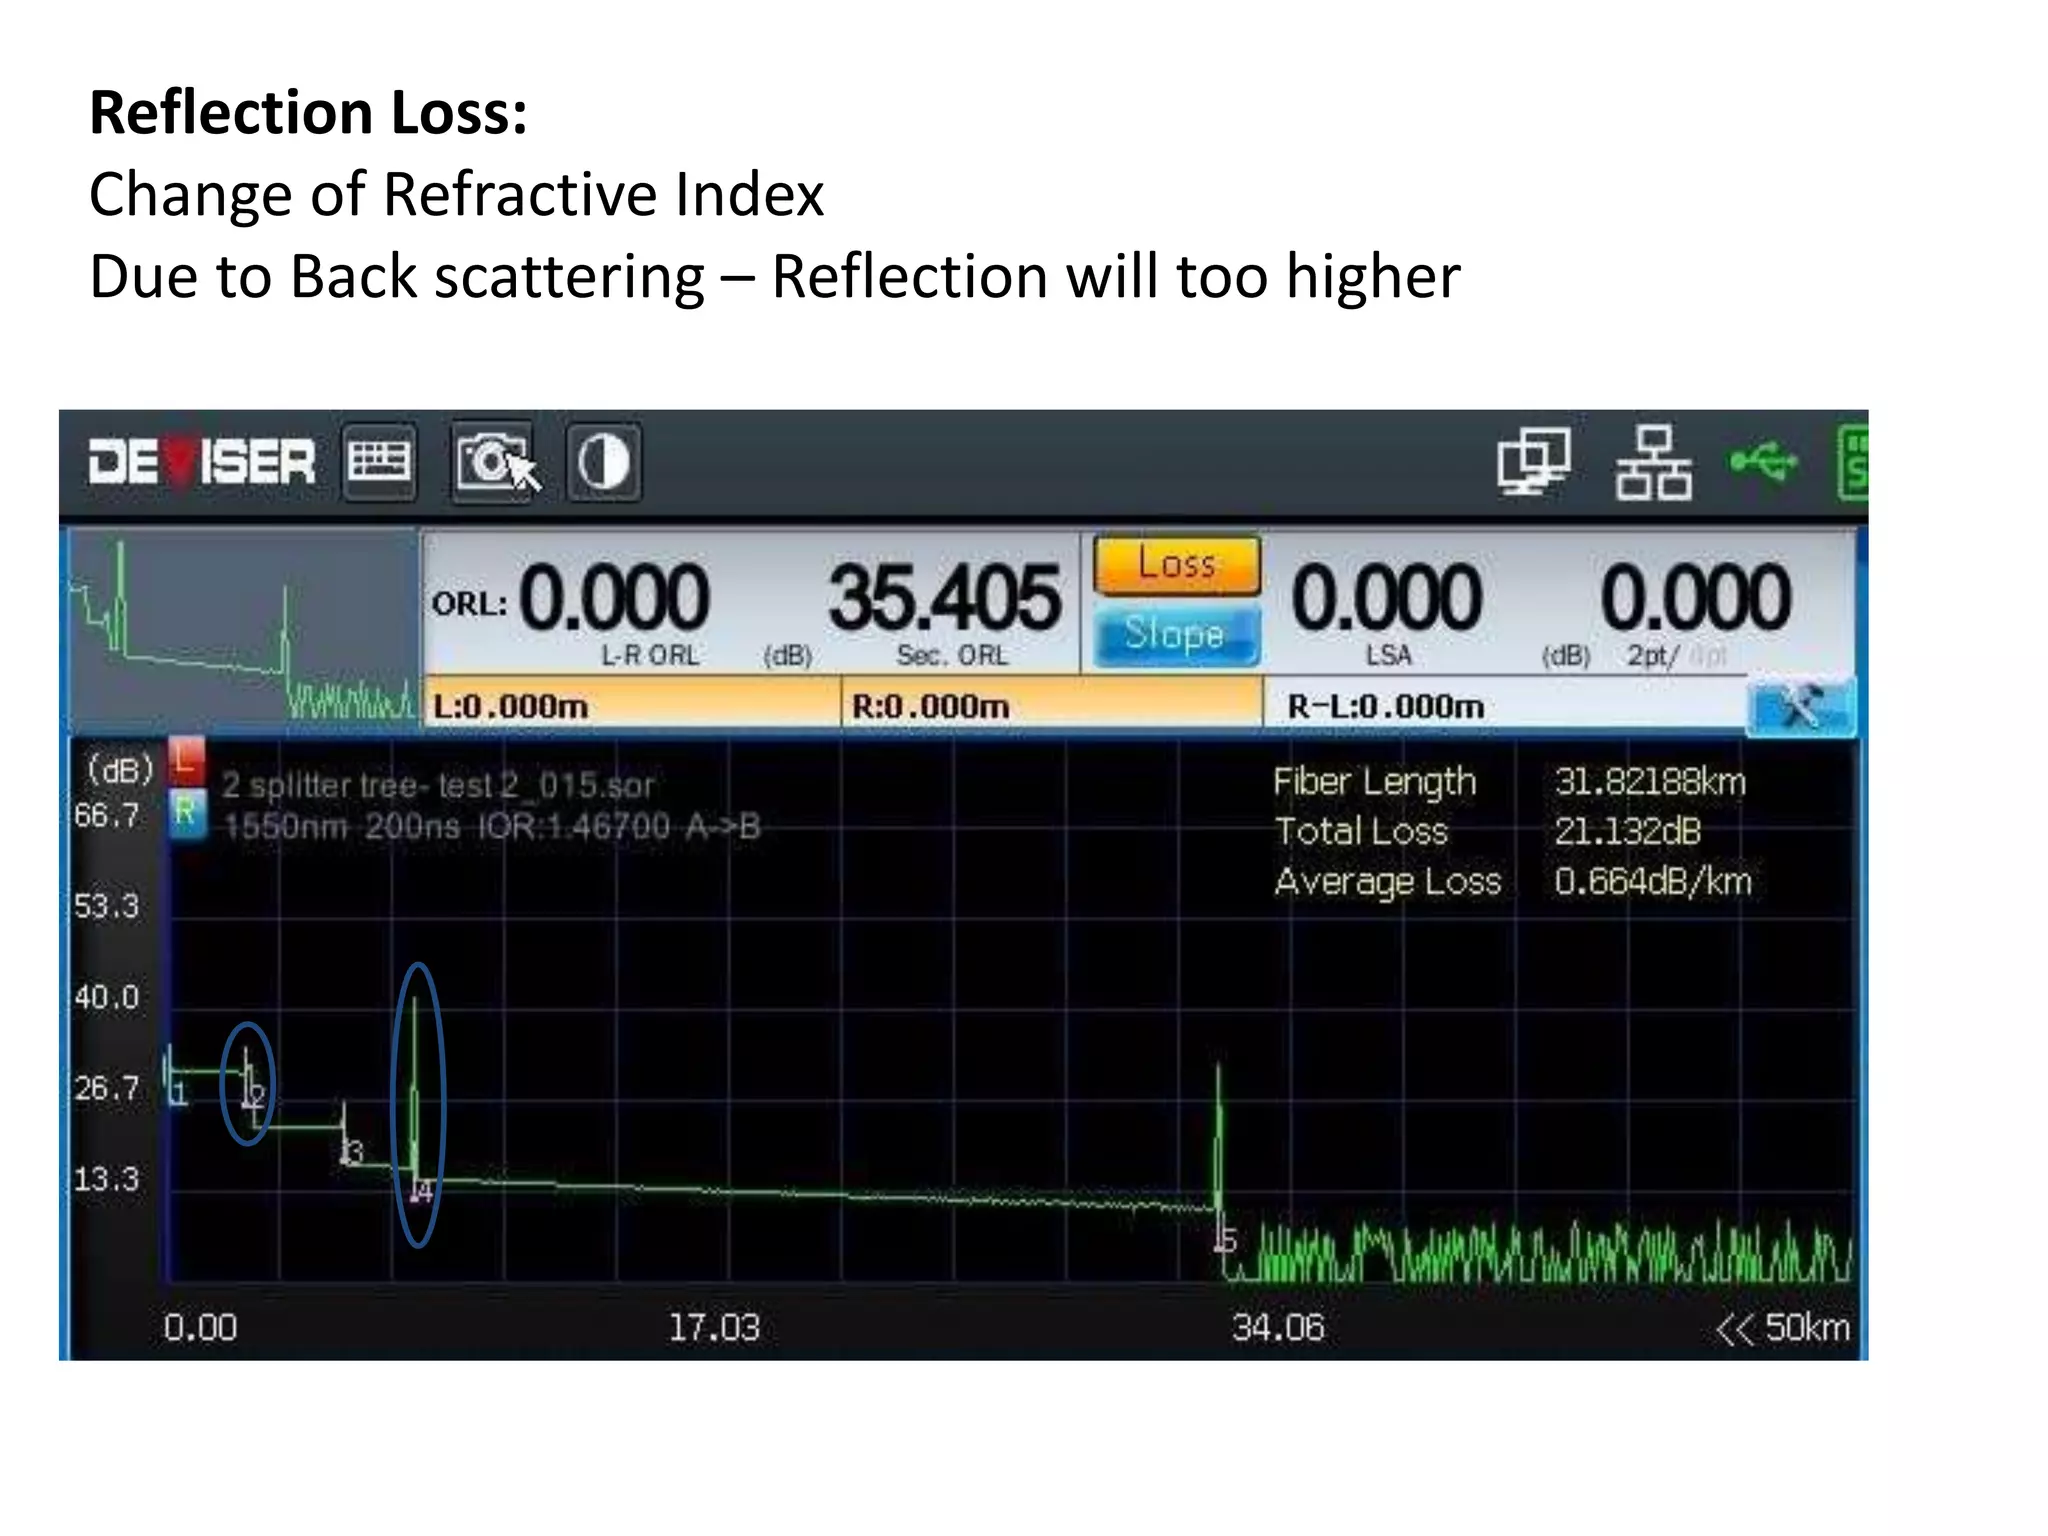
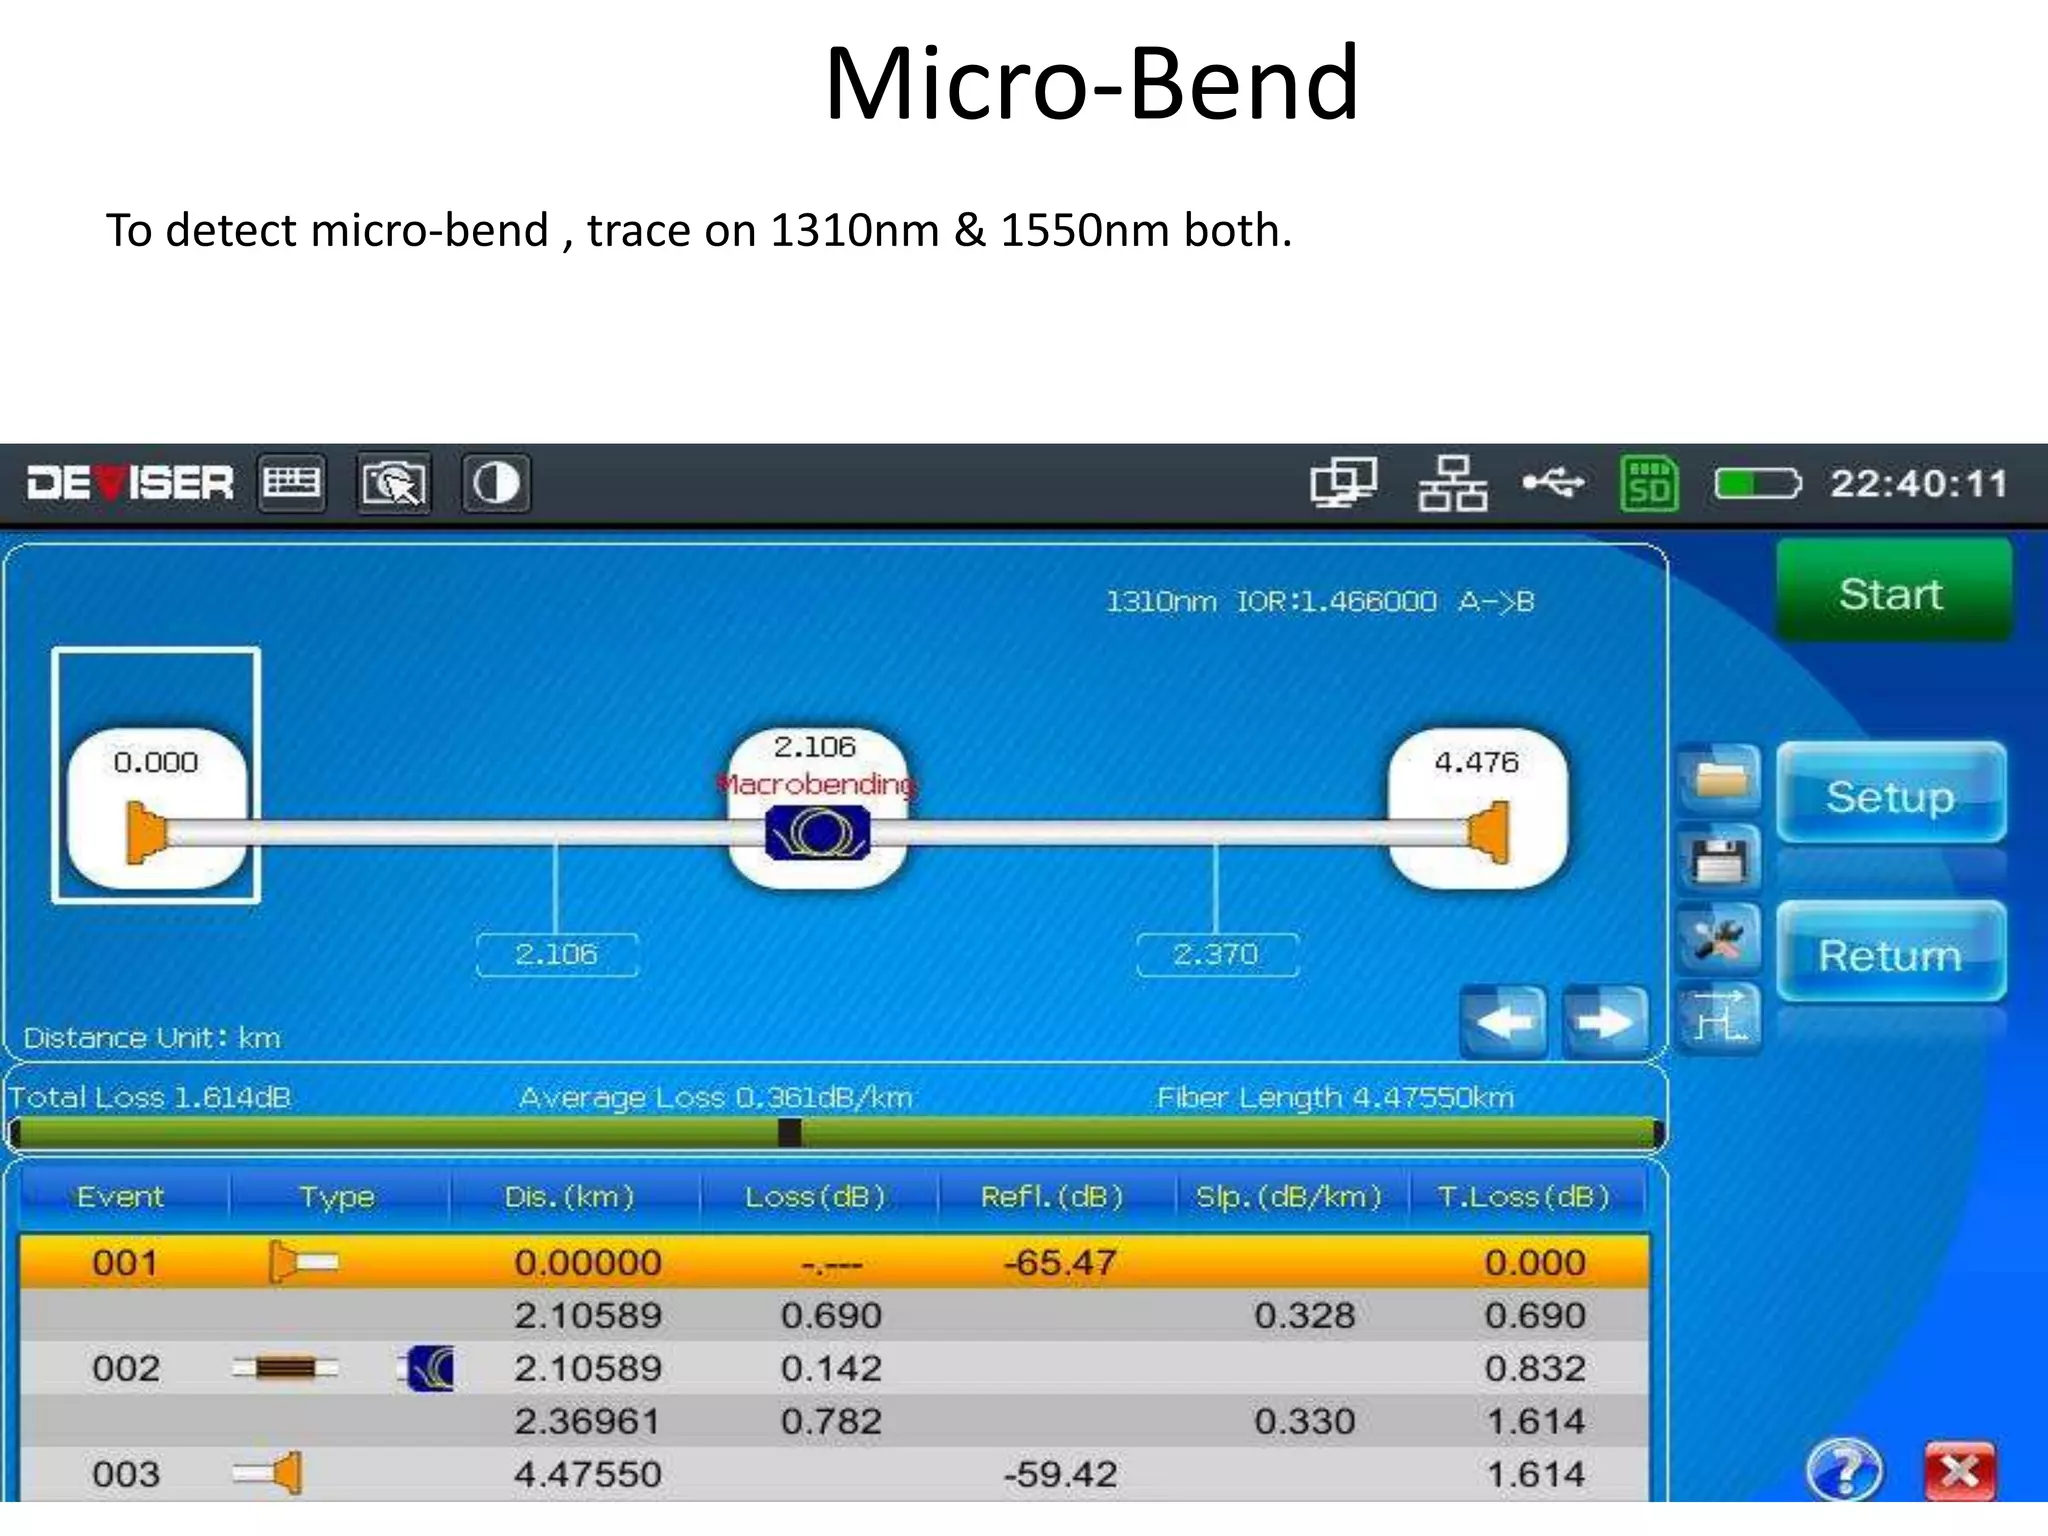
![●Return Loss
P3(Return Loss)
Entering Light Power
P1
Outgoing Light Power
P2
Connected
Face P1
L=-10log
P3
[d B]
Fresnel reflection is due to the light reflecting off a boundary
of two optical mediums, each having a different refractive
indexes (IOR).
Medium RI
Vacuum 1.0
Air 1.0003
Water 1.3
Silica(Fiber) 1.5
Diamond 2.4](https://image.slidesharecdn.com/otdrslideshare-200420044117/75/OTDR-OPTICAL-TIME-DOMAIN-REFLECTOMETER-9-2048.jpg)


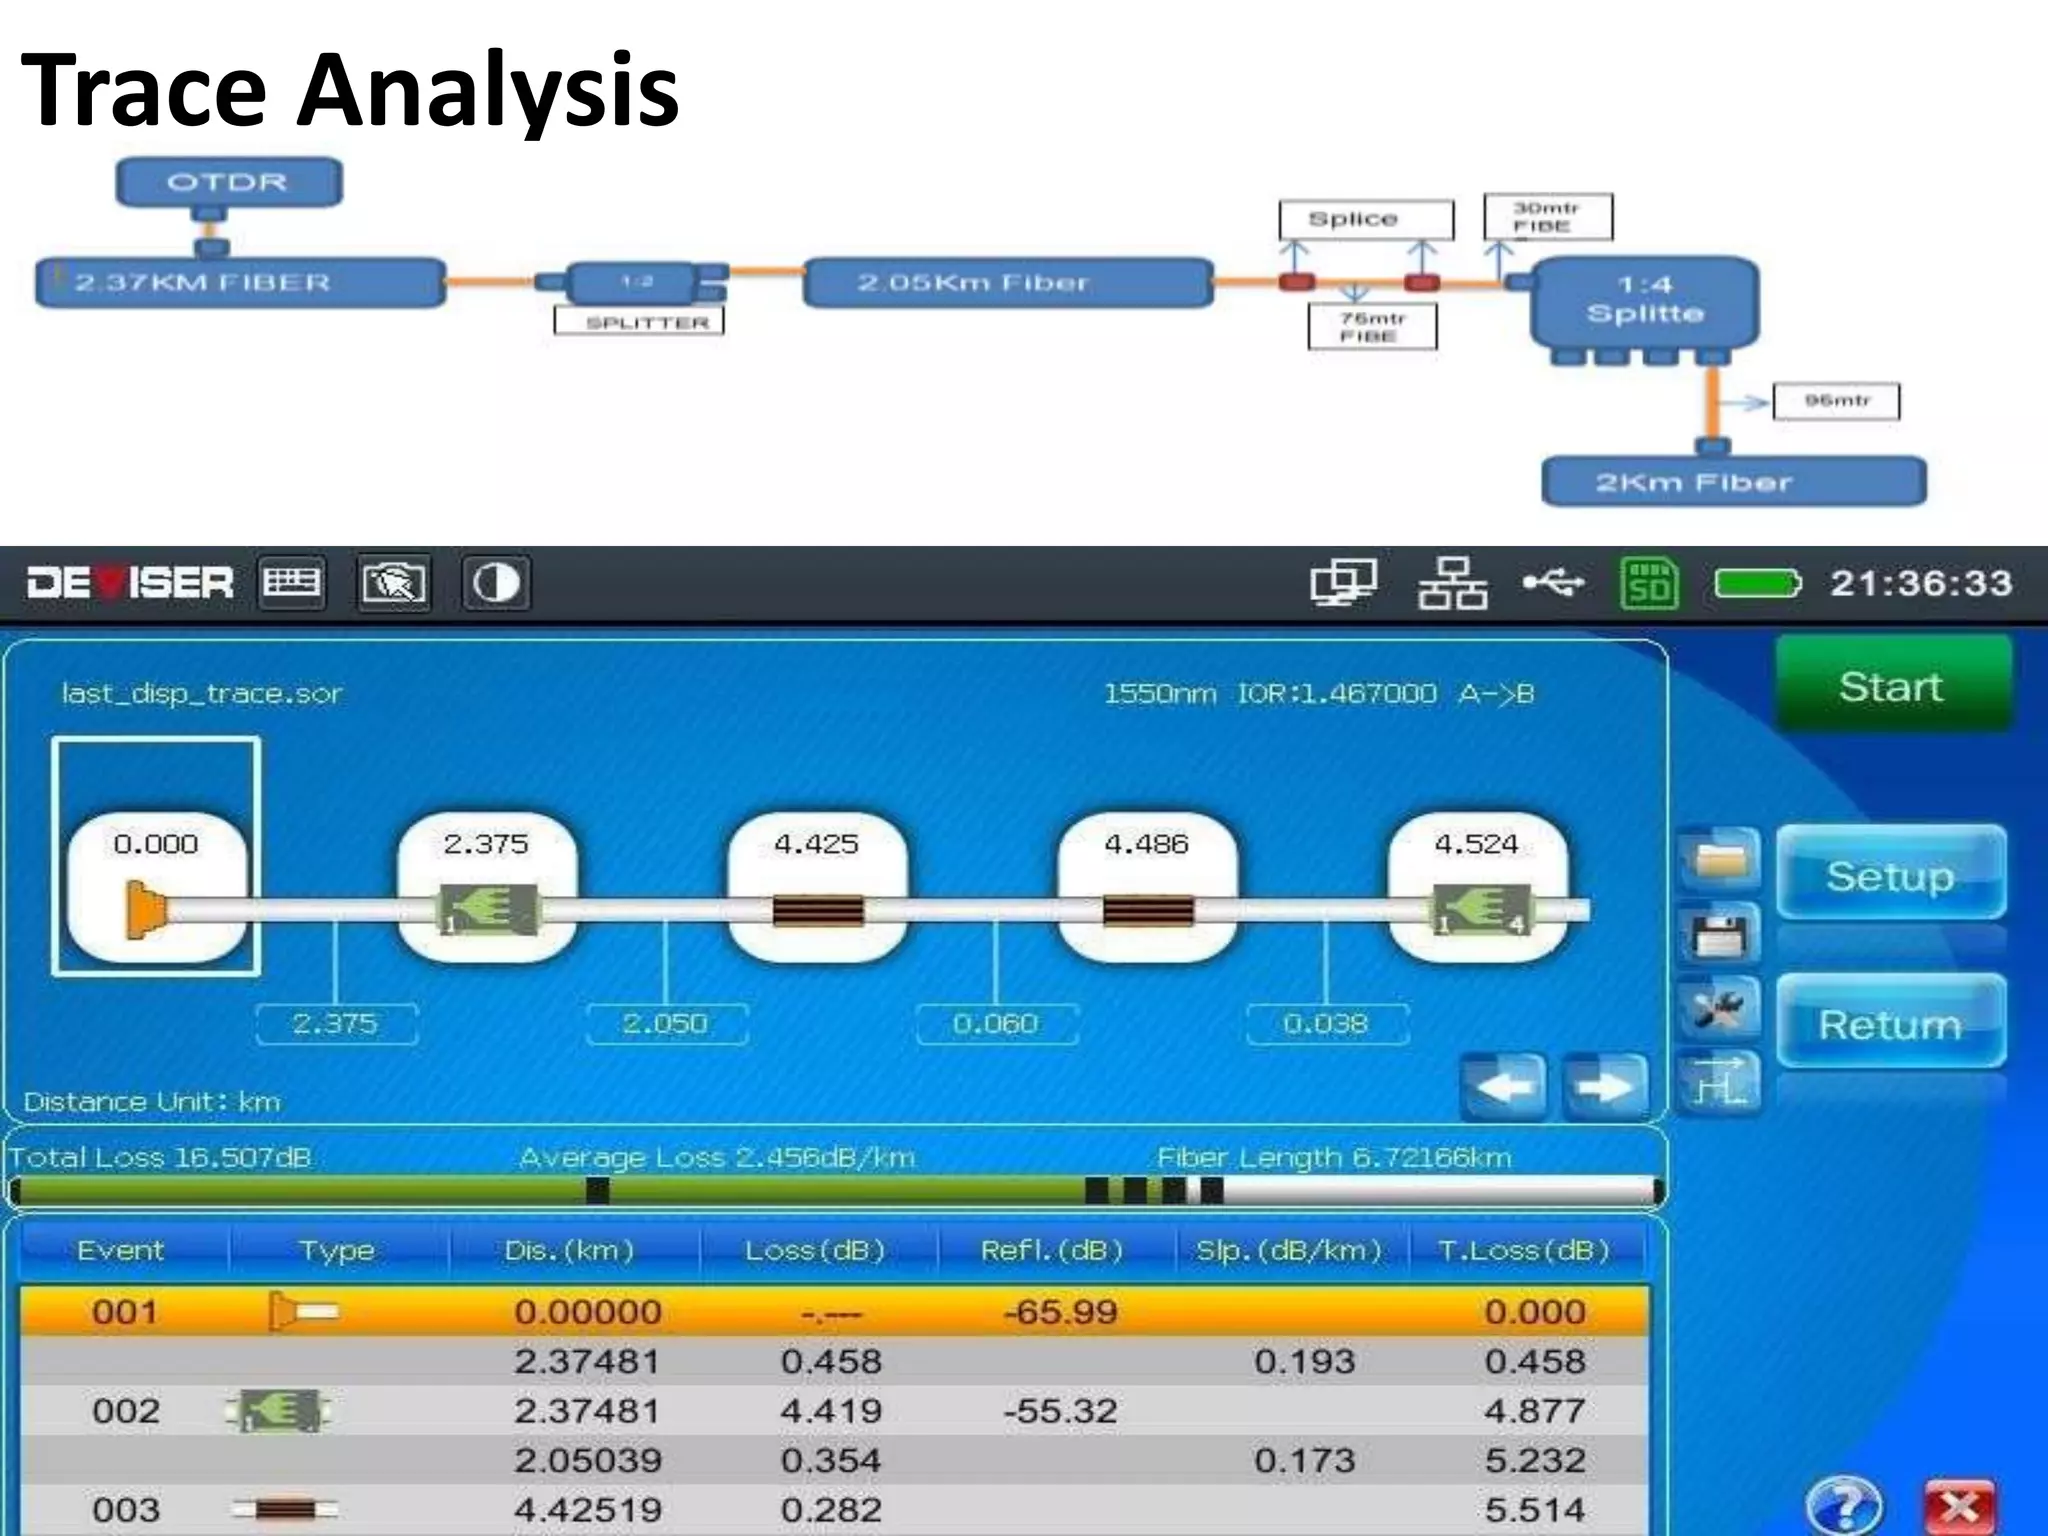
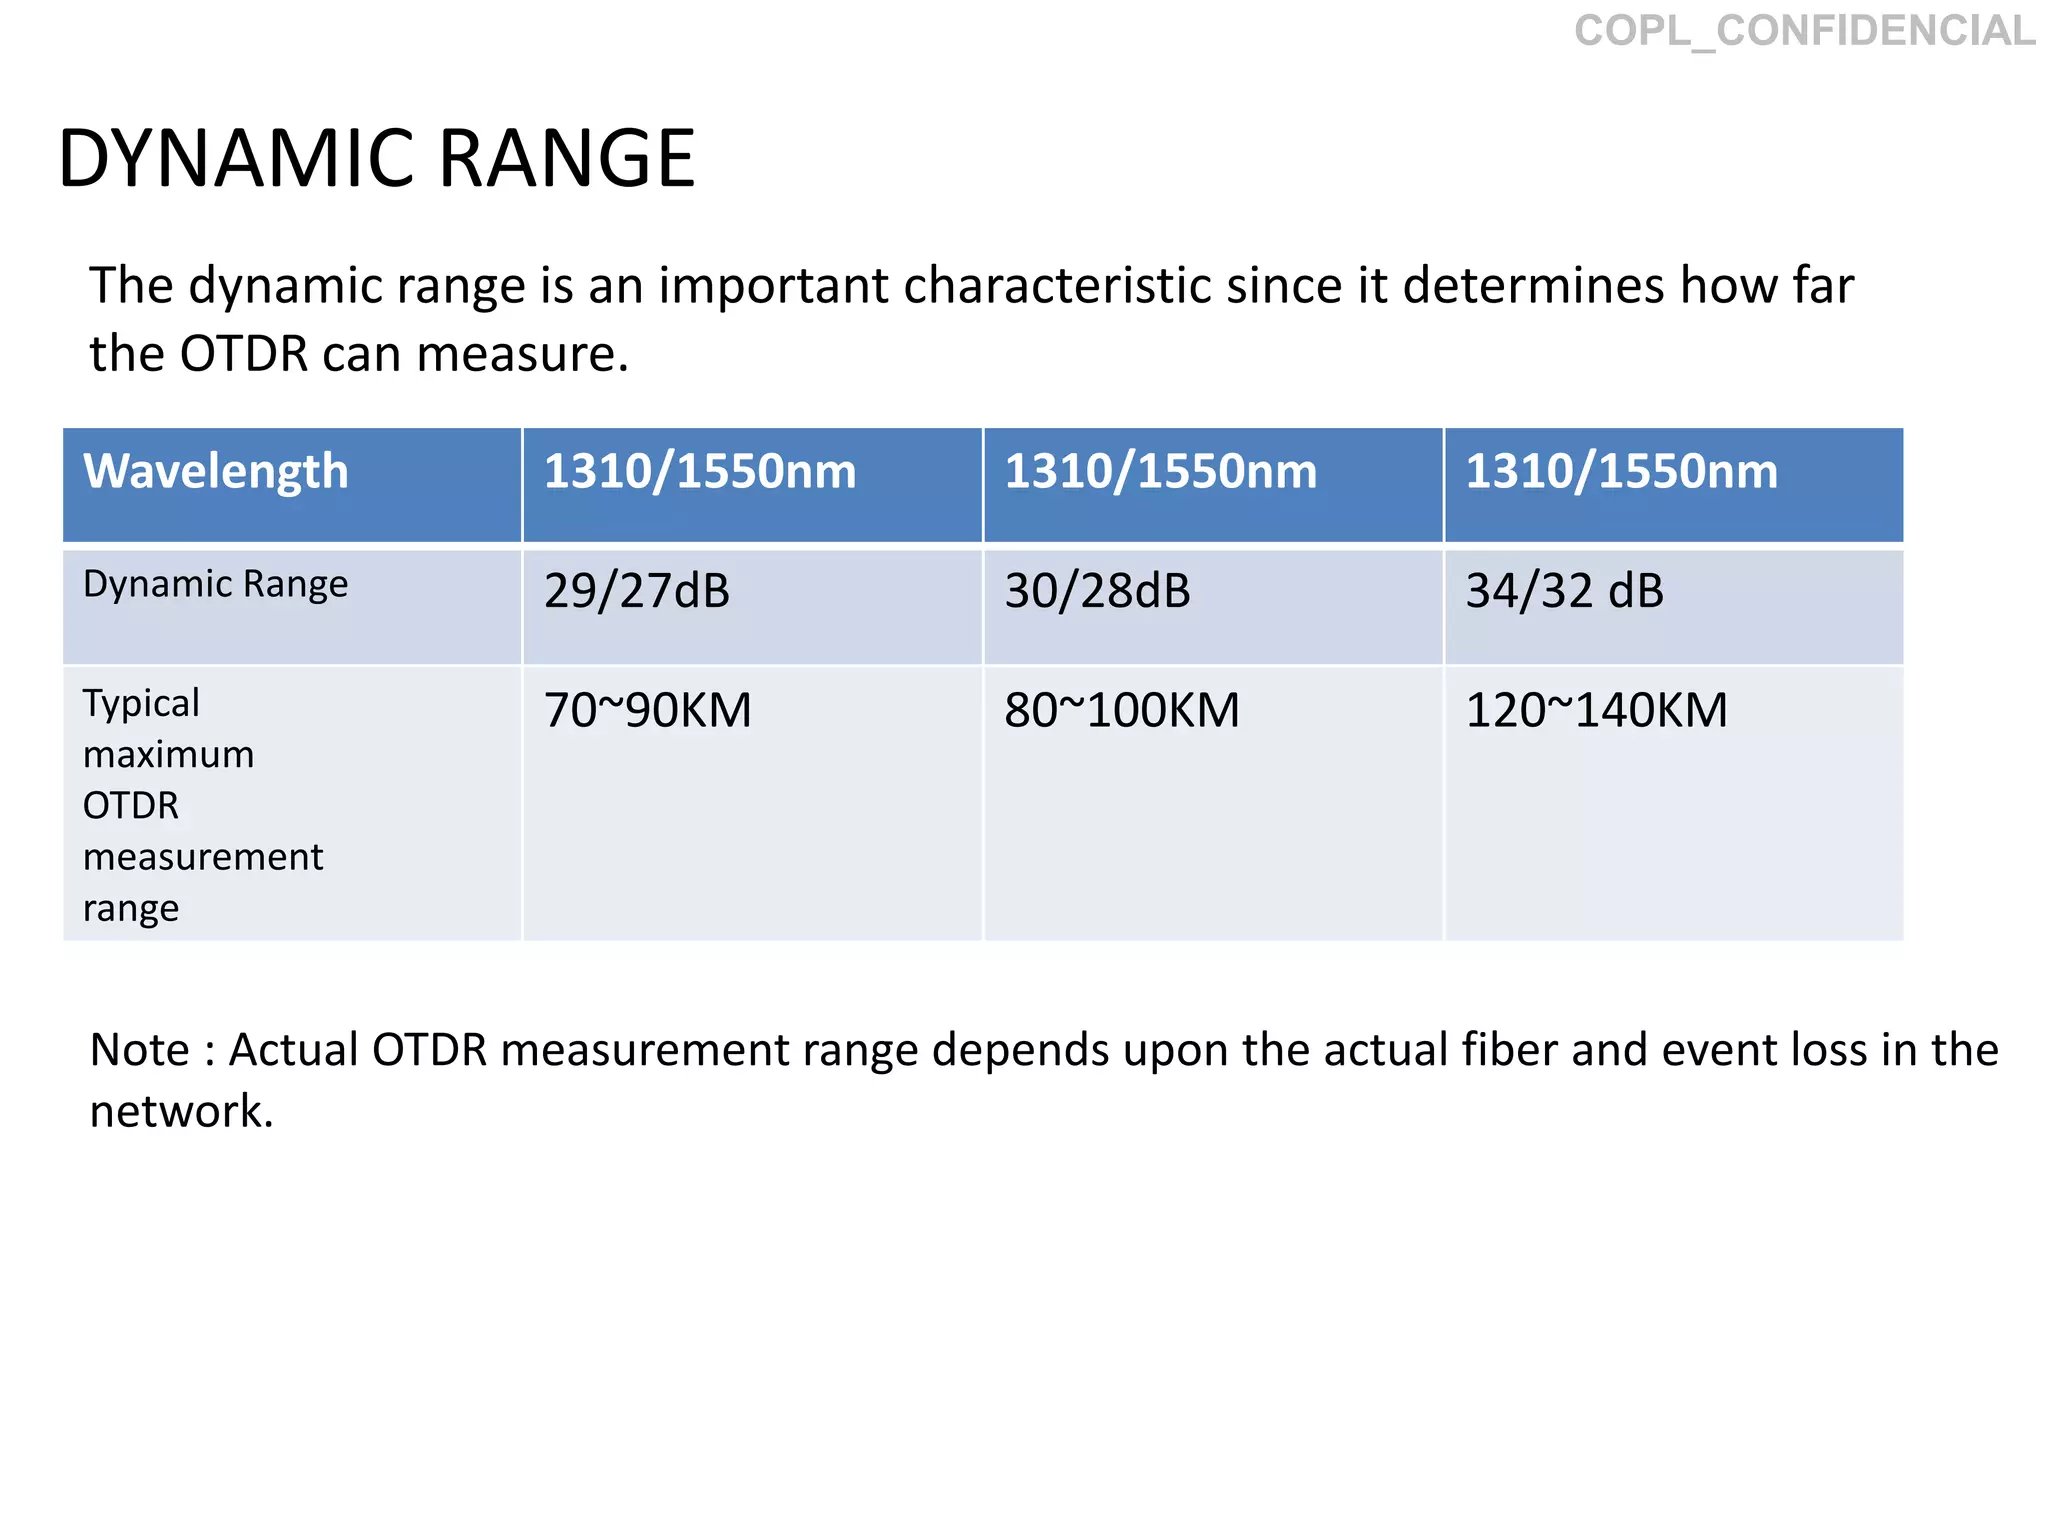
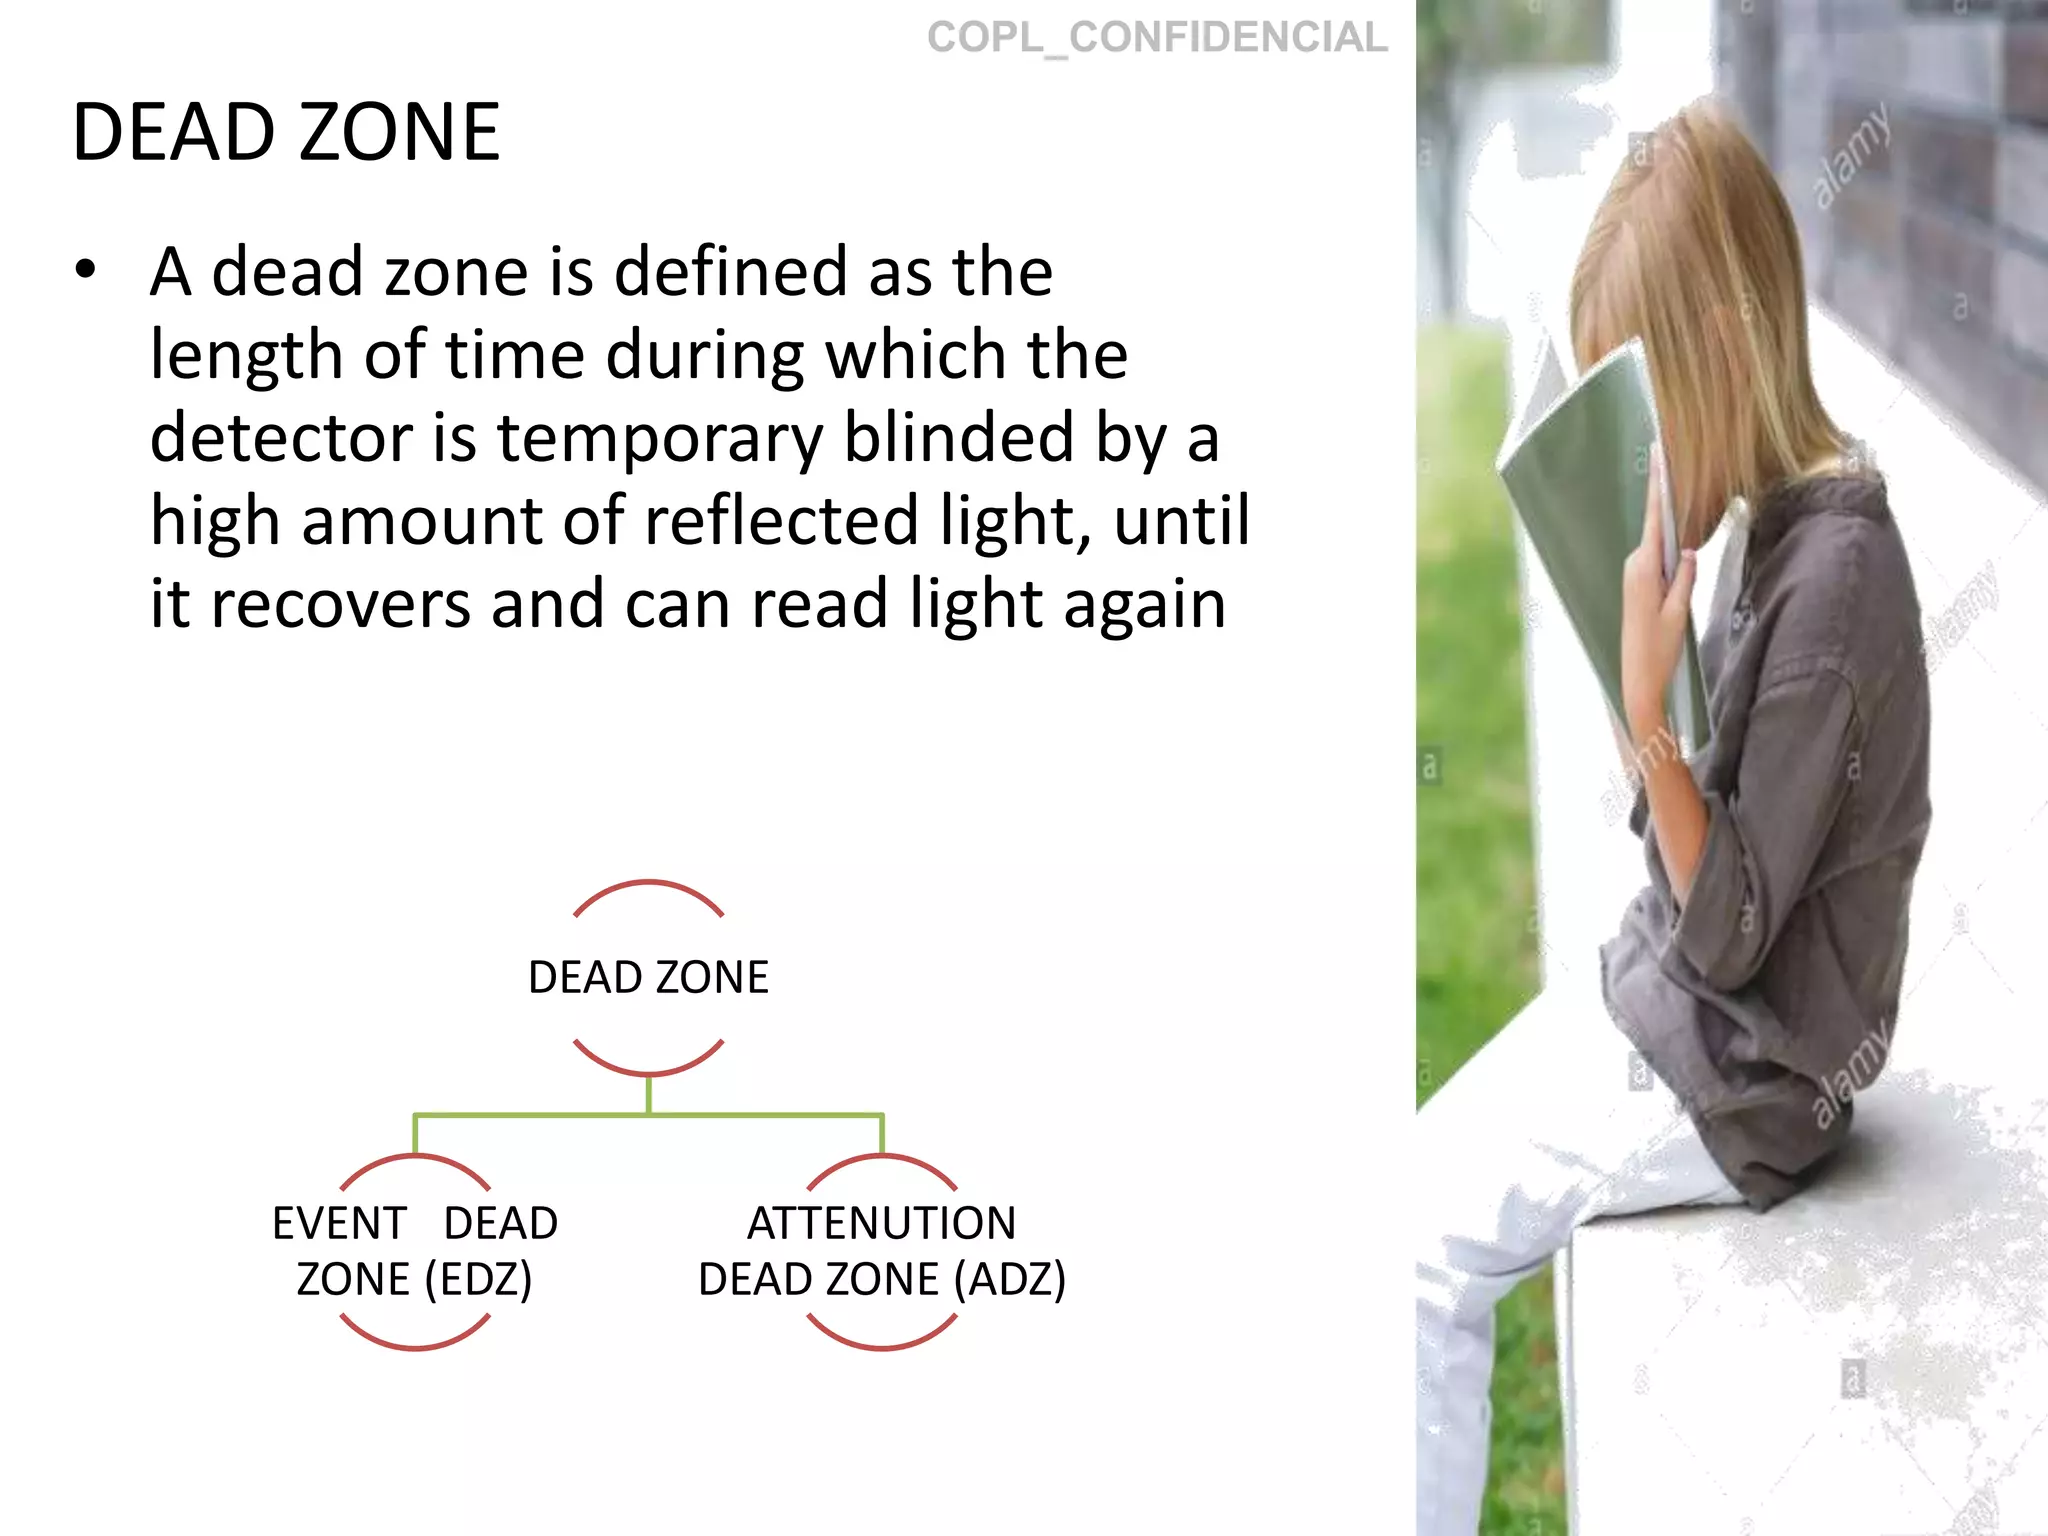
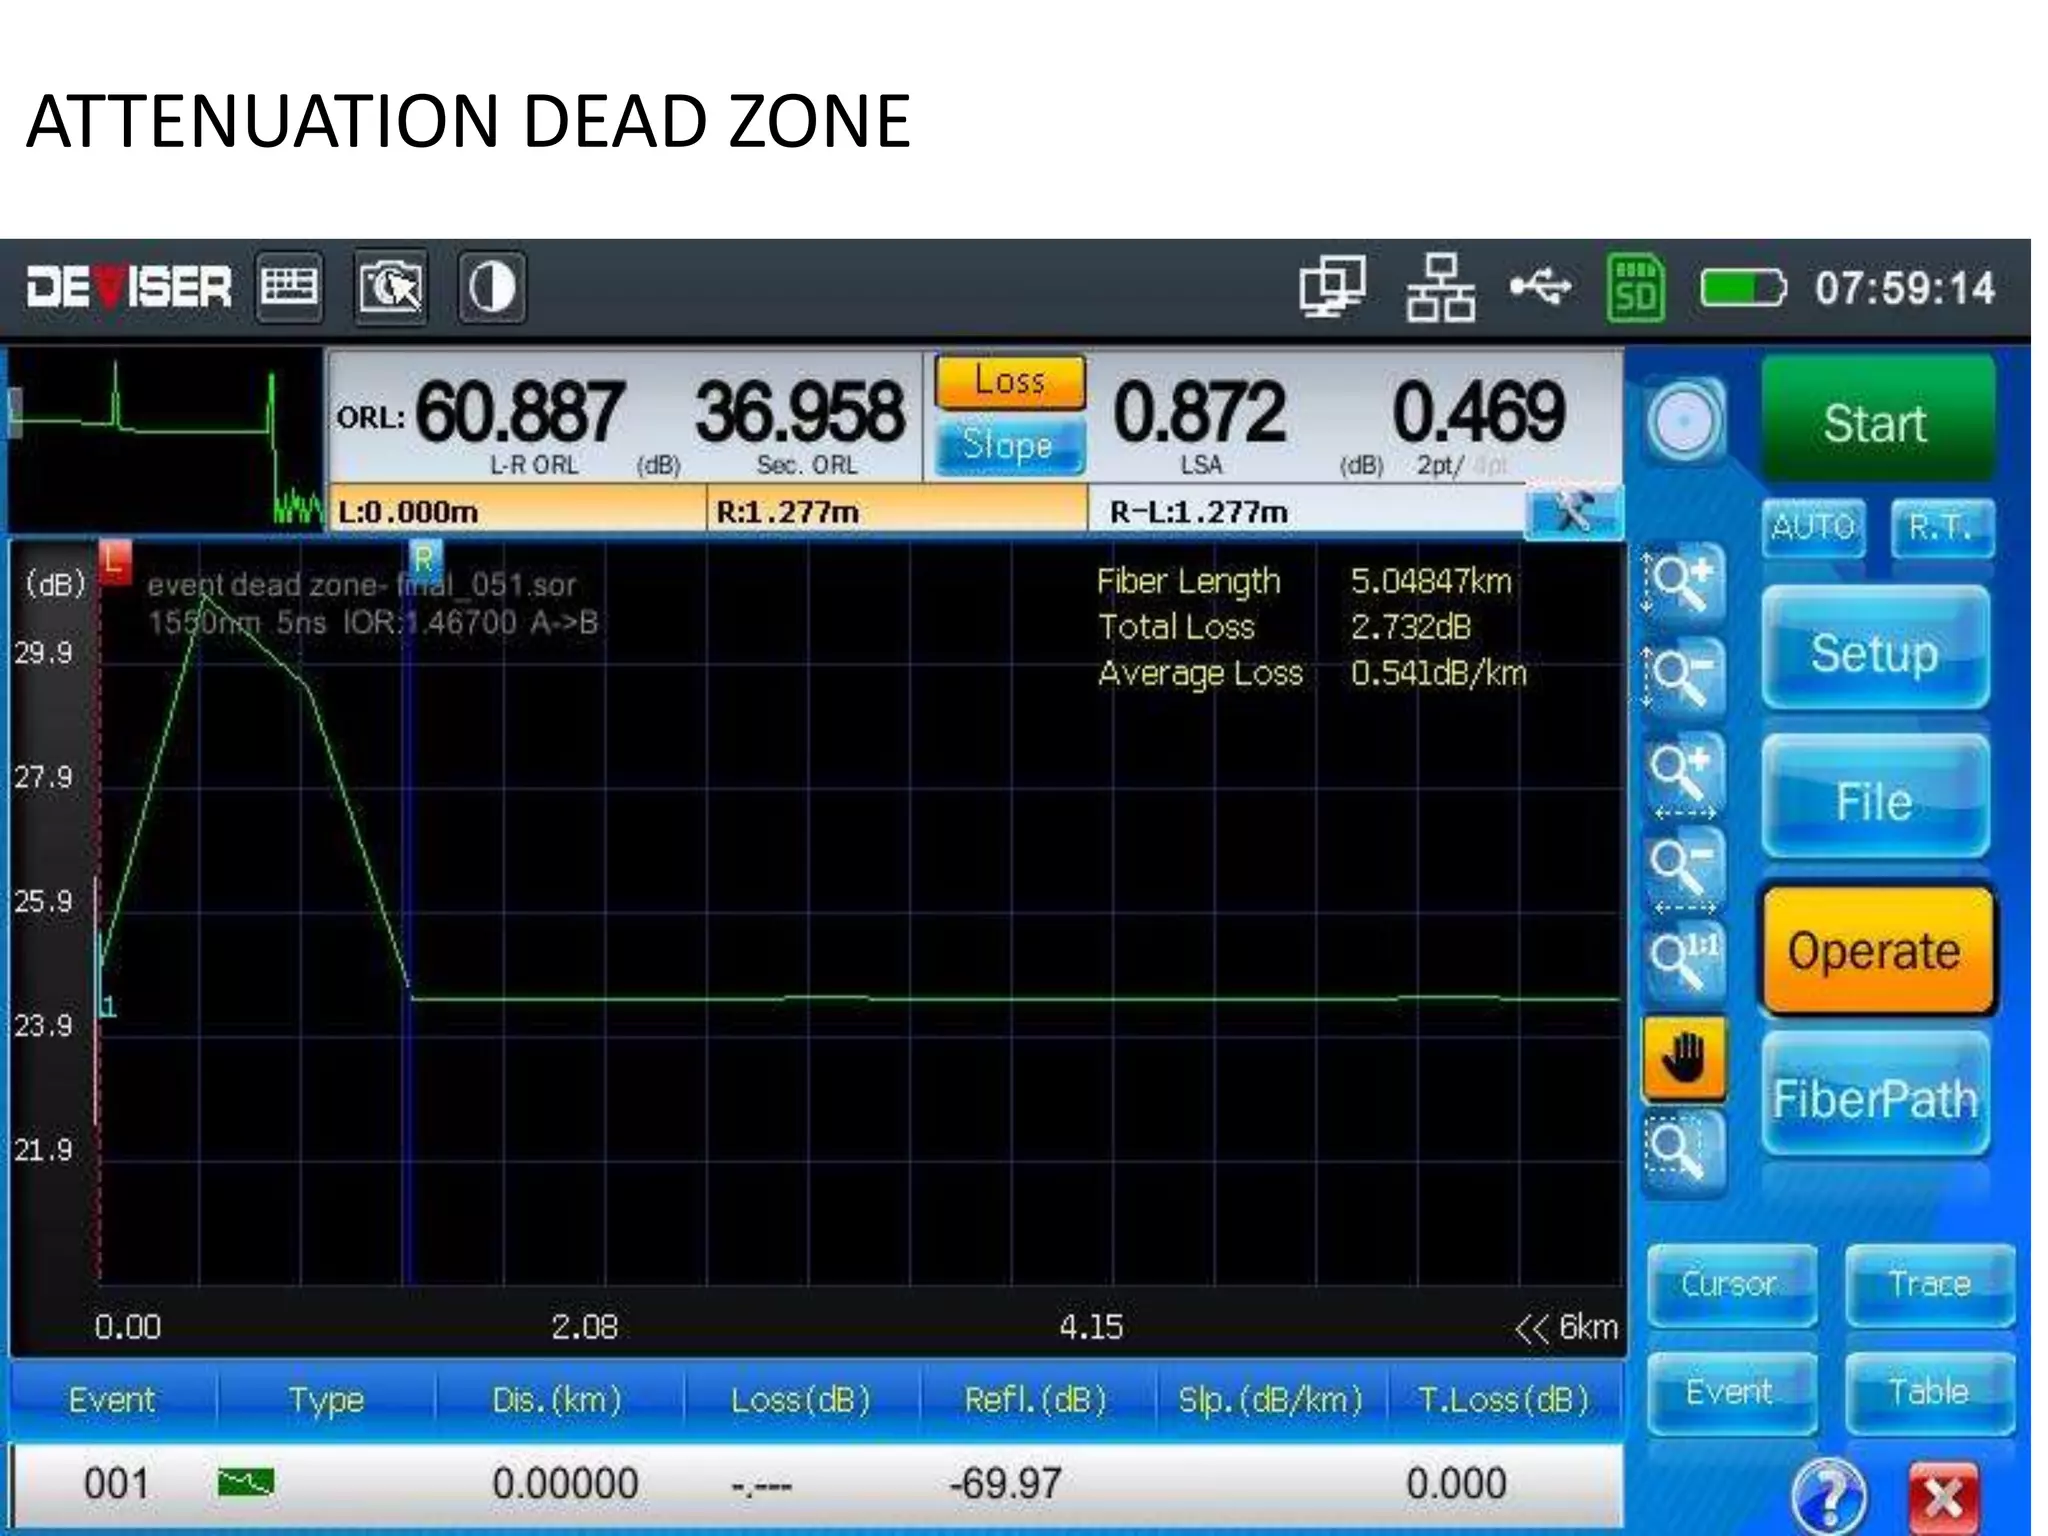


The document provides a comprehensive overview of Optical Time Domain Reflectometers (OTDR), covering key topics such as wavelength basics, optical fiber communication systems, and trace analysis techniques. It discusses the importance of power budget calculations, attenuation factors, and measurements for effective fiber optics communication, along with detailed setup instructions and applications of OTDR technology. Additionally, the document addresses factors affecting signal quality, including connector cleanliness and dead zones, as well as various optional features of OTDR devices.


![Coded Agents – with UiPath SDK + LangGraph [Virtual Hands-on Workshop]](https://cdn.slidesharecdn.com/ss_thumbnails/codedagentsdeck-251215155422-5497c599-thumbnail.jpg?width=640&height=640&fit=bounds)