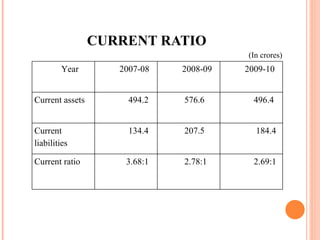
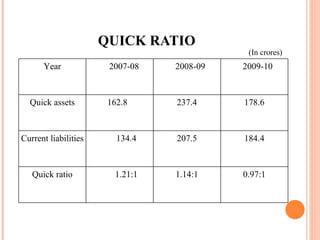
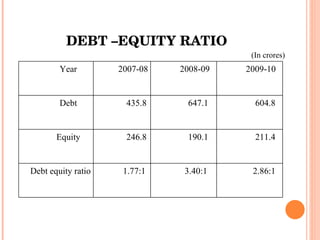
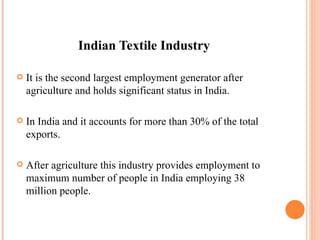
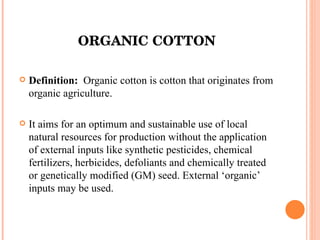
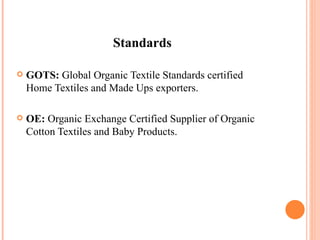
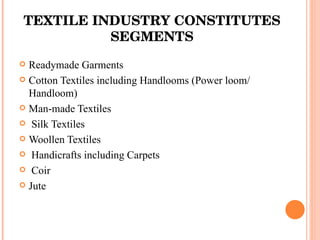
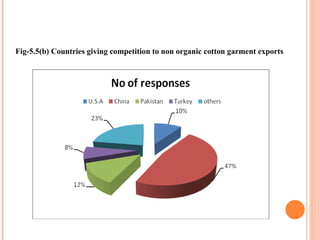
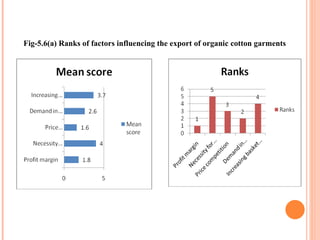
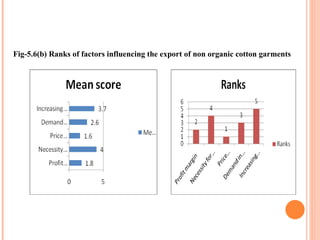
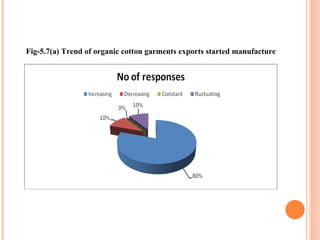
Summer Training Project on  Comparative study of Organic & Non  organic garments exports from India  Undertaken at     ORIENT CRAFT LIMITED Presented by: Sahil Mehra MBA-IB (2B) Roll No. 94972238306
ORIENT CRAFT LIMITED The name behind names
 
ORIENT CRAFT…. AN OVERVIEW Started its operations in 1978 Orient Craft has a most modern manufacturing plant with over 3,50,000 sq.. ft. of covered area in one location It deploys over 8000 imported sewing machines for its manufacturing operation It has in-house testing laboratory well equipped to test all parameters .
CONTD…. It has a specialized home furnishing division exporting to names like DKNY, Tommy Hilfiger It has three 100% E.O.U.’s Advanced washing plants and dry cleaning machines. There is one single thread that runs through their 35000 employees, 30 factories and 50 clients.
It export  products to leading international fashion houses and retail chains throughout the world. Manufactures garments and home furnishes out of its 18 factories situated in and around Delhi. Privately held (deemed public limited)   Annual Turnover : Rs 874 cr  2009-10 Set up a 100% Wholly Owned Subsidiary in US.
Owns one of the country’s biggest embroidery unit housing over 70 multi- headed computerized embroidery machines. Production capacity is 75,000 dozen per month. Major export Markets are U.S.A & Europe.
Group Companies:  Orient Craft Denims & Special Finishes Ltd Orient Design Private Ltd Orient Craft USA Inc Orient Craft Infrastructure Ltd Orient Craft Brand Ltd Orient Craft S. Oliver Private Ltd Orient Craft Crochets(P)  Ltd
MISSION “  Establish a healthy a business environment for a close and mutually beneficial relationships among the manufacturers, exporters and importers in the process ensuring a steady growth in the foreign exchange earnings of the country”
VISION “ So many dreams yet to be realized, tasks yet to be accomplished, destinations yet to be reached, targets yet to be met, words yet to be spoken, promises yet to be kept..” 
BRANDS Michael Kors Oilily  Marc Jacobs S. Oliver Forth Towne Levis Pepe Jeans Gap Tommy Hilifiger Banana Republic Old Navy Macy’s
MAJOR PRODUCTS T shirts Knitted shirts Kids wear Men’s shirts Pants shorts Jackets Dresses Skirts
MAJOR CUSTOMERS Dillards (USA) Tommy Hilfiger Denim (Europe) Tommy Hilfiger (USA) May & Company Miss Sixty Tom Tailor (Europe) Ann Taylor The Hilt (Europe) J-crew The Limited (USA) Club Monaco DKNY (USA) Hollister Sean John (USA) Monsoon Calvein Klein Jeans (USA) Victoria Secret Oilily-infants, children Polo Jeans Banana Republic Izod-kelwood Pepe Jeans Charming In GAP Marc Jacob Marks & Spencer
TOP EXECUTIVES Mr. Sudhir Dhingra Managing Director Mr. K.K. Kohli Jt. Managing Director Mr. Anoop Thatai Jt. Managing Director Mr. Sahil Dhingra Director Mr. Ashok Munjal Independent Director Mr. LV. Saptharishi Independent Director Mr. Ajit Kumar Sahay Independent Director
DETAILS OF OWNERSHIP OF THE COMPANY Sudhir Dhingra and Mr. K.K. Kohli promoted on 28/02/1978.  Mr. K.K. Kohli joined the company as promoter director. Mr. Anoop Thatai is an MBA and joined the company as Executive Director. Mr. Sahil Dhingra joined as a Director. Mr. Ashok Munjal, Mr. LV. Saptharishi and Mr. Ajit Kumar Sahay as Independent Director.
ORIENT CRAFT’S CULTURE & ITS ASPECTS Professionalism System Approach Commitment To Quality Excellence With Economy Cost Consciousness Human Resource Regarded As Valuable Asset Customer Focus
Quality Policy At orient Craft quality initiatives are taken at every stage of garment manufacturing. Each department in the factory is subjected to the quality norms set by the buyer or by the company itself .
QUALITY OBJECTIVES 1.  Raw material stage Quality control using the 4 point AQL system. Physical checking of trims Checking of color differences Lab testing of  fabric, trims  2 . Order processing stage Production package checked Spreading ,cutting, notching ,marking, bundling ,sewing, pressing Operating conditions of machinery
3.  End line checking and finishing Replacement of defective /fabric section Redoing an operation Mending an operation 4.  Packaging Packing manual reference Needle policy Poly bag checking Carton checking
MANAGEMENT PRACTICES Production, Planning and Control To produce the required product with minimum total cost and time for the delivery required. Monitors the progress of the production of any and every product from the receipt of raw materials to the shipment order. Schedule ‘What’ and ‘where’ an activity has to be done and ‘when’.
LOGISTICS AND RESEARCH & DEVELOPMENT The file is forwarded to this department with important documents like: Garment inspection report Pre production comment sheet Fabric reference sample Fabric test report Accessories and trim card Purchase order sheet Fabric order sheet Design work sheet
AWARDS AND ACCOLADES Nominator Award Year Macy’s Store Vendor of the Year 2008 Marks and Spencer Outstanding Supplier Contribution Award 2008 Resource. Com Outstanding Performance Award 2005 May Department Store Company Outstanding Vendor Award 2003 Monsoon Accessories Outstanding Vendor Award 2004-05
Business Initiatives Directions International Quality Crown Award Platinum Category 2003 The Clothing Manufactures Association Of India Award 2003 Ministry of Commerce Golden Status Certificate 2002 Business Initiatives Directions International Quality Crown Award Excellence in Business Category 2002 May Department Store Company Export Excellence Award 2002
ORGANIZATION STRUCTURE OF TRAINING UNIT
FUNCTIONING OF DEPARTMENTS Production Department Finance Department HRD Department Marketing Packaging
 
STRENGTHS Good brand image Good technological base for production Close supervision
WEAKNESSES Less innovative minds Lesser degree of promotional activity High labor turnover
OPPORTUNITIES Favorable demand conditions-large, growing international market. Untapped domestic and foreign markets
THREATS   Increasing competition with other garment exporters Fluctuations in foreign currency
FINANCIAL ANALYSIS
LIQUIDITY RATIOS
CURRENT RATIO (In crores) Year  2007-08 2008-09 2009-10 Current assets 494.2 576.6 496.4 Current liabilities 134.4 207.5 184.4 Current ratio 3.68:1 2.78:1 2.69:1
QUICK RATIO (In crores) Year  2007-08 2008-09 2009-10 Quick assets 162.8  237.4 178.6 Current liabilities 134.4 207.5 184.4 Quick ratio 1.21:1 1.14:1 0.97:1
LEVERAGE OR CAPITAL STRUCTURE RATIOS
DEBT –EQUITY RATIO (In crores) Year  2007-08 2008-09 2009-10 Debt  435.8 647.1 604.8 Equity  246.8 190.1 211.4 Debt equity ratio 1.77:1 3.40:1 2.86:1
PROPRIETARY RATIO (In crores) Year  2007-08 2008-09 2009-10 Equity 246.8 190.1 211.4 Total asset 829.4 1051.9 1010 Proprietary ratio 29.76% 18.01% 20.93%
SOLVENCY RATIO (In crores) Year  2007-08 2008-09 2009-10 Proprietary  37% 71% 30% Solvency ratio 70.24% 81.99% 79.07%
PROFITABILITY RATIOS
GROSS PROFIT RATIO (In crores) Year 2007-08 2008-09 2009-10 Gross profit 208.98 365.68 238.6 Net sales 686.18 802.48 874 Gross profit ratio 30.46% 45.57% 27.3%
NET PROFIT RATIO (In crores) Year  2007-08 2008-09 2009-10 Net profit 19.25 (53.7) 16.9 Net sales 686.18 802.48 874 Net profit ratio 5.2% (4.49%) 3.96%
RETURN ON SHAREHOLDERS’ EQUITY (In crores) Year 2007-08 2008-09 2009-10 Net profit after taxes 19.25 (53.7) 16.9 Shareholders’ fund 246.8 190.1 211.4 Return on shareholders’ equity 7.80% (28.25%) 7.99
ACTIVITY RATIOS
INVENTORY TURNOVER RATIO (In crores) Year 2007-08 2008-09 2009-10 Cost of goods sold 477.2 436.8 635.4 Average inventory 294.1 335.3 294.05 Inventory turnover ratio  ( in times) 1.62 1.3 2.16 Inventory holding period ( in days) 225 280 169
DEBTOR TURNOVER RATIO (In crores) Year 2007-08 2008-09 2009-10 Net credit sales 686.18 802.48 874 Average debtors 121.65 335.3 162.2 Debtors turnover ratio 5.64 2.39 5.3 Debtor conversion period 65 153 69
CREDITOR TURNOVER RATIO (In crores) Year  2007-08 2008-09 2009-10 Net credit purchases 445.54 433.8 302.2 Average creditors 60.32 96.2 119.81 Creditor turnover ratio( in times ) 7.39 4.5 2.52 Average payment period ( in days ) 49 81 145
TREND ANALYSIS
T REND  O F  T URNOVER Years Sales (Rs. In Crores) Trend ( In %) 2005-06 744.8 100 2006-07 745.7 100.12 2007-08 686.2 92.1 2008-09 802.4 107.7 2009-10 874.1 117.4
TREND OF NET PROFIT / LOSS Years  Net Profit (Rs. In Crores) Trend ( In %) 2005-06 28.72 100 2006-07 40.36 140.5 2007-08 19.25 67.02 2008-09 (53.78) (282.75) 2009-10 16.9 58.84
Introduction to the Project
Indian Textile Industry It is the second largest employment generator after agriculture and holds significant status in India. In India and it accounts for more than 30% of the total exports. After agriculture this industry provides employment to maximum number of people in India employing 38 million people.
ORGANIC COTTON Definition:  Organic cotton is cotton that originates from organic agriculture. It aims for an optimum and sustainable use of local natural resources for production without the application of external inputs like synthetic pesticides, chemical fertilizers, herbicides, defoliants and chemically treated or genetically modified (GM) seed. External ‘organic’ inputs may be used.
Standards  GOTS:  Global Organic Textile Standards certified Home Textiles and Made Ups exporters. OE:  Organic Exchange Certified Supplier of Organic Cotton Textiles and Baby Products.
TEXTILE INDUSTRY CONSTITUTES SEGMENTS Readymade Garments Cotton Textiles including Handlooms (Power loom/ Handloom)  Man-made Textiles Silk Textiles Woollen Textiles Handicrafts including Carpets Coir Jute
The main markets for Indian textiles and apparels are USA, UAE, UK, Germany, France, Italy, Russia, Canada, Bangladesh and Japan. Following are some major players in Indian Textile Industry: Arvind Mills Raymonds  Reliance Textiles  Vardhman Spinning  Welspun India
STRENGTHS OF INDIAN TEXTILE INDUSTRY India has rich resources of raw materials of textile industry. India is rich in highly trained manpower.  India is highly competitive in spinning sector. Indian garment industry is very diverse in size, manufacturing facility, type of apparel produced, quantity and quality of output, cost, requirement for fabric etc.
  WEAKNESSES OF INDIAN TEXTILE INDUSTRY Indian textile industry is highly fragmented in industry structure, and is led by small scale companies.  Indian labor laws are relatively unfavorable to the trades and there is an urgent need for labor reforms in India.
FUTURE OUTLOOK Indian textile industry will grow at an annualized rate of 16% between 2007 and 2012. It is expected to reach a level of $115 billion by 2012. Indian textile exports are projected to increase from $19.24 billion in 2006-2007 to $55 billion in 2012 - an annualized growth rate of over 22$. 17.37 million new jobs will be created by the textile industry in next three years - 12.02 direct and 5.35 indirect.
ORGANIC CLOTHING Organic farming methods are not limited to food production. The use of organic production and processing practices has now expanded into other crops, such as cotton. Unlike conventional cotton that accounts for about 25% of the global insecticides market by value and about 10% of the pesticides market, organic cotton is grown and processed without toxic pesticides, herbicides and synthetic fertilizers.
SHOCKING FACTS ABOUT CONVENTIONAL (NON ORGANIC) COTTON Uses 2.03 billion pounds of synthetic fertilizers (formaldehyde, Sodium Lauryl Sulphate, parabens, chemical dyes etc) per year. Uses 25% of the world’s insecticides . Uses only about 3% of the farmland but consumes approximately 25 percent of the chemical pesticides and fertilizers (84 million pounds of chemical pesticides per year)
ORGANIC COTTON SAVES LIVES No pesticides, hazardous chemicals (believed to cause up to a million cases of poisoning a year and 20,000 deaths) No formaldehyde (used as a finish): According to a National Cancer Institute (NCI)study, there is a link between formaldehyde exposure and cancer of the nasopharynx (the uppermost part of the throat) No nickel which can cause skin rashes.
STANDARDS Global Organic Textile Standard (GOTS) To be labelled “organic” requires fiber to be at least 95% organic. (The remaining 5% can be conventional fiber, but not of the same fiber as the organic portion) OE 100 and OE Blended OE 100 only allows a minimum of 95% organic fiber (exclusive of threads or non-textile accessories). The remaining 5% cannot be cotton. OE Blended requires at least 5% organic cotton content for the blended standard allowing the remaining fiber to be any fiber, including conventional cotton.
TITLE OF THE RESEARCH Comparative study of organic and non organic cotton garment exports from India
OBJECTIVES OF THE RESEARCH To analyze the direction and composition of organic & non organic garments exports from India. To highlight the factors influencing the export of organic and non organic garment exports from India. To study the competitive position of organic and non organic garment exports in International Market.
Research Methodology
Research Design: The research design of the project is  descriptive  as it describes data and view points of the  garments  manufacturers & exporters in Delhi and Gurgaon. Descriptive research is used to obtain information concerning the current status of the phenomena to describe "what exists" with respect to variables in a given situation
S ampling Design: Sampling refers to selecting some of the elements in a population by which one can draw conclusions about the entire population. Universe: Universe is the infinite number of elements which the researcher is targeting in the study. Since the study is restricted to Delhi and Gurgaon the universe for the study consists of  all the exporters of organic and non organic cotton garments. Population: Population is the finite number of elements which the researcher is going to target in a particular area. The population consist of  all   exporters of organic and non organic cotton garments in Delhi and Gurgaon.
Sampling Unit: Sampling Unit is the single unit of the population. The sampling unit for this research is any  single individual or firm who export organic and non organic cotton garments. Extent: Extent refers to the geographical area where there is a scope of population. The extent of the study is Delhi and Gurgaon.   Time: Time involved for the study conducted is  1 month . Sampling Technique: The selection of the respondents was done on the basis of  convenience sampling technique  and  snowball  technique based on the  non probability  method of sampling.
Sample size: Sample size is the size of sample drawn from the population which is the true representative of the research. The number of respondents included in the study was  25  for convenience in evaluating and analyzing the data and because of time constraint.
LIMITATIONS OF THE STUDY While every effort was made to get the questionnaire filled personally, even then some elements of biasness might have crept in. Only 25 respondents have been contacted due to time constraint. Sample may not be the true representative of the universe. Generally the respondents were busy in their work and were not interested in responding. The study was conducted within the boundaries of mentioned areas only.
DATA ANALYSIS AND INTERPRETATION
Fig-5.1 No of manufactures and traders
Table-5.2 Types of cotton garments exported Products Organic Non organic Knitted Woven Knitted Woven No of responses 8 9 18 22 Total no of responses 17 17 40 40 Percentage 47.06%% 52.94% 45% 55% Percentage of people exporting organic & non organic garments 40% 100%
Fig-5.3(a) Type of organic cotton garment exported
Fig-5.3(b) Type of non organic cotton garment exported
Fig-5.4(a) Export countries of organic cotton garments
Fig-5.4(b) Export countries of non organic cotton garments
Fig-5.5(a) Countries giving competition to organic cotton garment exports
Fig-5.5(b) Countries giving competition to non organic cotton garment exports
Fig-5.6(a) Ranks of factors influencing the export of organic cotton garments
Fig-5.6(b) Ranks of factors influencing the export of non organic cotton garments
Fig-5.7(a) Trend of organic cotton garments exports started manufacture
Fig-5.7(b) Trend of non organic cotton garments exports started manufacture
Table 5.8- Proportion of export of organic cotton garments out of out of total exports Proportion of exports No of responses Percentage  0% 15 60% 1-25% 9 36% 25-50% 0 0% 50-75% 1 4% 75-100% 0 0% 100% 0 0% Total  25 100%
Fig-5.9(a)-Rating of quality of organic cotton garments better than non organic  cotton garments
Fig-5.9(b)-Rating of people in foreign countries are using more organic  garments than non organic cotton garments
Fig-5.9(c)-Rating of export of organic cotton garments more than non  organic cotton garments
Fig-5.9(d)-Rating of organic cotton garments are more eco-friendly than  non organic cotton garments
Fig-5.9(e)-Rating of lengthy procedure in certification of organic  cotton garments
Fig-5.9(f)-Rating of production technology of organic cotton garments complex  than non organic cotton garments
Table 5.10-Combined result of all the above factors  Factors  Mean  Rank  Quality of garments produced from organic cotton is substantially better than non organic 0.88 2 People of foreign countries  are using more organic garments than non organic one 0.56 4 Export of organic garments is more than non organic garment 0.08 6 Organic cotton garments are more eco friendly than non organic 1 1 Lengthy procedure in certification of organic cotton garments 0.76 3 Production technology of organic cotton garments is complex than non organic cotton garments 0.24 5
FINDINGS 30% of the organic exporters export women dresses and 27% of non organic exporters export shirts. 40% of the exporters produce organic cotton garments and 100% produce non organic cotton garments Most favorable export country for organic and non organic cotton garments is USA & Europe. In case of competition – organic garments exporters faces competition with Syria but non organic garments exporters with China Factor which influences the export of – organic is profit margin and for non organic is price competitiveness.
CONTD …. Trend of both organic and non organic is increasing but still there much export of non organic cotton garments. People agree to the fact that organic cotton garments are more eco friendly then non organic. Demand for organic garments is increasing in foreign markets. Quality of organic is better then non organic Organic cotton garments involve highly complex technology and certification procedure
SUGGESTIONS The company should engage more in organic garments as it is a growing market and not many people are there in this business As organic cotton garments involves high profit so the company can look for more earnings. There are still huge markets which are still untapped so the company can get into this and increase its market share. When there are less competitors the company can have an edge over the others in organic cotton garments business.
CONTD …… In the future “go green” will be the new concept so organic clothes will be in demand more. In case of non organic sector there are many competitors so the profit margin will be less. Very less percentage of organic cotton textile products are exported from Delhi and Gurgaon There is more scope of export of organic cotton textile products in U.S. & European markets.
THANKS

Orient Craft Ltd

  • 1.
    Summer Training Projecton Comparative study of Organic & Non organic garments exports from India Undertaken at   ORIENT CRAFT LIMITED Presented by: Sahil Mehra MBA-IB (2B) Roll No. 94972238306
  • 2.
    ORIENT CRAFT LIMITEDThe name behind names
  • 3.
  • 4.
    ORIENT CRAFT…. ANOVERVIEW Started its operations in 1978 Orient Craft has a most modern manufacturing plant with over 3,50,000 sq.. ft. of covered area in one location It deploys over 8000 imported sewing machines for its manufacturing operation It has in-house testing laboratory well equipped to test all parameters .
  • 5.
    CONTD…. It hasa specialized home furnishing division exporting to names like DKNY, Tommy Hilfiger It has three 100% E.O.U.’s Advanced washing plants and dry cleaning machines. There is one single thread that runs through their 35000 employees, 30 factories and 50 clients.
  • 6.
    It export products to leading international fashion houses and retail chains throughout the world. Manufactures garments and home furnishes out of its 18 factories situated in and around Delhi. Privately held (deemed public limited) Annual Turnover : Rs 874 cr 2009-10 Set up a 100% Wholly Owned Subsidiary in US.
  • 7.
    Owns one ofthe country’s biggest embroidery unit housing over 70 multi- headed computerized embroidery machines. Production capacity is 75,000 dozen per month. Major export Markets are U.S.A & Europe.
  • 8.
    Group Companies: Orient Craft Denims & Special Finishes Ltd Orient Design Private Ltd Orient Craft USA Inc Orient Craft Infrastructure Ltd Orient Craft Brand Ltd Orient Craft S. Oliver Private Ltd Orient Craft Crochets(P) Ltd
  • 9.
    MISSION “ Establish a healthy a business environment for a close and mutually beneficial relationships among the manufacturers, exporters and importers in the process ensuring a steady growth in the foreign exchange earnings of the country”
  • 10.
    VISION “ Somany dreams yet to be realized, tasks yet to be accomplished, destinations yet to be reached, targets yet to be met, words yet to be spoken, promises yet to be kept..” 
  • 11.
    BRANDS Michael KorsOilily Marc Jacobs S. Oliver Forth Towne Levis Pepe Jeans Gap Tommy Hilifiger Banana Republic Old Navy Macy’s
  • 12.
    MAJOR PRODUCTS Tshirts Knitted shirts Kids wear Men’s shirts Pants shorts Jackets Dresses Skirts
  • 13.
    MAJOR CUSTOMERS Dillards(USA) Tommy Hilfiger Denim (Europe) Tommy Hilfiger (USA) May & Company Miss Sixty Tom Tailor (Europe) Ann Taylor The Hilt (Europe) J-crew The Limited (USA) Club Monaco DKNY (USA) Hollister Sean John (USA) Monsoon Calvein Klein Jeans (USA) Victoria Secret Oilily-infants, children Polo Jeans Banana Republic Izod-kelwood Pepe Jeans Charming In GAP Marc Jacob Marks & Spencer
  • 14.
    TOP EXECUTIVES Mr.Sudhir Dhingra Managing Director Mr. K.K. Kohli Jt. Managing Director Mr. Anoop Thatai Jt. Managing Director Mr. Sahil Dhingra Director Mr. Ashok Munjal Independent Director Mr. LV. Saptharishi Independent Director Mr. Ajit Kumar Sahay Independent Director
  • 15.
    DETAILS OF OWNERSHIPOF THE COMPANY Sudhir Dhingra and Mr. K.K. Kohli promoted on 28/02/1978. Mr. K.K. Kohli joined the company as promoter director. Mr. Anoop Thatai is an MBA and joined the company as Executive Director. Mr. Sahil Dhingra joined as a Director. Mr. Ashok Munjal, Mr. LV. Saptharishi and Mr. Ajit Kumar Sahay as Independent Director.
  • 16.
    ORIENT CRAFT’S CULTURE& ITS ASPECTS Professionalism System Approach Commitment To Quality Excellence With Economy Cost Consciousness Human Resource Regarded As Valuable Asset Customer Focus
  • 17.
    Quality Policy Atorient Craft quality initiatives are taken at every stage of garment manufacturing. Each department in the factory is subjected to the quality norms set by the buyer or by the company itself .
  • 18.
    QUALITY OBJECTIVES 1. Raw material stage Quality control using the 4 point AQL system. Physical checking of trims Checking of color differences Lab testing of fabric, trims 2 . Order processing stage Production package checked Spreading ,cutting, notching ,marking, bundling ,sewing, pressing Operating conditions of machinery
  • 19.
    3. Endline checking and finishing Replacement of defective /fabric section Redoing an operation Mending an operation 4. Packaging Packing manual reference Needle policy Poly bag checking Carton checking
  • 20.
    MANAGEMENT PRACTICES Production,Planning and Control To produce the required product with minimum total cost and time for the delivery required. Monitors the progress of the production of any and every product from the receipt of raw materials to the shipment order. Schedule ‘What’ and ‘where’ an activity has to be done and ‘when’.
  • 21.
    LOGISTICS AND RESEARCH& DEVELOPMENT The file is forwarded to this department with important documents like: Garment inspection report Pre production comment sheet Fabric reference sample Fabric test report Accessories and trim card Purchase order sheet Fabric order sheet Design work sheet
  • 22.
    AWARDS AND ACCOLADESNominator Award Year Macy’s Store Vendor of the Year 2008 Marks and Spencer Outstanding Supplier Contribution Award 2008 Resource. Com Outstanding Performance Award 2005 May Department Store Company Outstanding Vendor Award 2003 Monsoon Accessories Outstanding Vendor Award 2004-05
  • 23.
    Business Initiatives DirectionsInternational Quality Crown Award Platinum Category 2003 The Clothing Manufactures Association Of India Award 2003 Ministry of Commerce Golden Status Certificate 2002 Business Initiatives Directions International Quality Crown Award Excellence in Business Category 2002 May Department Store Company Export Excellence Award 2002
  • 24.
  • 25.
    FUNCTIONING OF DEPARTMENTSProduction Department Finance Department HRD Department Marketing Packaging
  • 26.
  • 27.
    STRENGTHS Good brandimage Good technological base for production Close supervision
  • 28.
    WEAKNESSES Less innovativeminds Lesser degree of promotional activity High labor turnover
  • 29.
    OPPORTUNITIES Favorable demandconditions-large, growing international market. Untapped domestic and foreign markets
  • 30.
    THREATS Increasing competition with other garment exporters Fluctuations in foreign currency
  • 31.
  • 32.
  • 33.
    CURRENT RATIO (Incrores) Year 2007-08 2008-09 2009-10 Current assets 494.2 576.6 496.4 Current liabilities 134.4 207.5 184.4 Current ratio 3.68:1 2.78:1 2.69:1
  • 34.
    QUICK RATIO (Incrores) Year 2007-08 2008-09 2009-10 Quick assets 162.8 237.4 178.6 Current liabilities 134.4 207.5 184.4 Quick ratio 1.21:1 1.14:1 0.97:1
  • 35.
    LEVERAGE OR CAPITALSTRUCTURE RATIOS
  • 36.
    DEBT –EQUITY RATIO(In crores) Year 2007-08 2008-09 2009-10 Debt 435.8 647.1 604.8 Equity 246.8 190.1 211.4 Debt equity ratio 1.77:1 3.40:1 2.86:1
  • 37.
    PROPRIETARY RATIO (Incrores) Year 2007-08 2008-09 2009-10 Equity 246.8 190.1 211.4 Total asset 829.4 1051.9 1010 Proprietary ratio 29.76% 18.01% 20.93%
  • 38.
    SOLVENCY RATIO (Incrores) Year 2007-08 2008-09 2009-10 Proprietary 37% 71% 30% Solvency ratio 70.24% 81.99% 79.07%
  • 39.
  • 40.
    GROSS PROFIT RATIO(In crores) Year 2007-08 2008-09 2009-10 Gross profit 208.98 365.68 238.6 Net sales 686.18 802.48 874 Gross profit ratio 30.46% 45.57% 27.3%
  • 41.
    NET PROFIT RATIO(In crores) Year 2007-08 2008-09 2009-10 Net profit 19.25 (53.7) 16.9 Net sales 686.18 802.48 874 Net profit ratio 5.2% (4.49%) 3.96%
  • 42.
    RETURN ON SHAREHOLDERS’EQUITY (In crores) Year 2007-08 2008-09 2009-10 Net profit after taxes 19.25 (53.7) 16.9 Shareholders’ fund 246.8 190.1 211.4 Return on shareholders’ equity 7.80% (28.25%) 7.99
  • 43.
  • 44.
    INVENTORY TURNOVER RATIO(In crores) Year 2007-08 2008-09 2009-10 Cost of goods sold 477.2 436.8 635.4 Average inventory 294.1 335.3 294.05 Inventory turnover ratio ( in times) 1.62 1.3 2.16 Inventory holding period ( in days) 225 280 169
  • 45.
    DEBTOR TURNOVER RATIO(In crores) Year 2007-08 2008-09 2009-10 Net credit sales 686.18 802.48 874 Average debtors 121.65 335.3 162.2 Debtors turnover ratio 5.64 2.39 5.3 Debtor conversion period 65 153 69
  • 46.
    CREDITOR TURNOVER RATIO(In crores) Year 2007-08 2008-09 2009-10 Net credit purchases 445.54 433.8 302.2 Average creditors 60.32 96.2 119.81 Creditor turnover ratio( in times ) 7.39 4.5 2.52 Average payment period ( in days ) 49 81 145
  • 47.
  • 48.
    T REND O F T URNOVER Years Sales (Rs. In Crores) Trend ( In %) 2005-06 744.8 100 2006-07 745.7 100.12 2007-08 686.2 92.1 2008-09 802.4 107.7 2009-10 874.1 117.4
  • 49.
    TREND OF NETPROFIT / LOSS Years Net Profit (Rs. In Crores) Trend ( In %) 2005-06 28.72 100 2006-07 40.36 140.5 2007-08 19.25 67.02 2008-09 (53.78) (282.75) 2009-10 16.9 58.84
  • 50.
  • 51.
    Indian Textile IndustryIt is the second largest employment generator after agriculture and holds significant status in India. In India and it accounts for more than 30% of the total exports. After agriculture this industry provides employment to maximum number of people in India employing 38 million people.
  • 52.
    ORGANIC COTTON Definition: Organic cotton is cotton that originates from organic agriculture. It aims for an optimum and sustainable use of local natural resources for production without the application of external inputs like synthetic pesticides, chemical fertilizers, herbicides, defoliants and chemically treated or genetically modified (GM) seed. External ‘organic’ inputs may be used.
  • 53.
    Standards GOTS: Global Organic Textile Standards certified Home Textiles and Made Ups exporters. OE: Organic Exchange Certified Supplier of Organic Cotton Textiles and Baby Products.
  • 54.
    TEXTILE INDUSTRY CONSTITUTESSEGMENTS Readymade Garments Cotton Textiles including Handlooms (Power loom/ Handloom) Man-made Textiles Silk Textiles Woollen Textiles Handicrafts including Carpets Coir Jute
  • 55.
    The main marketsfor Indian textiles and apparels are USA, UAE, UK, Germany, France, Italy, Russia, Canada, Bangladesh and Japan. Following are some major players in Indian Textile Industry: Arvind Mills Raymonds Reliance Textiles Vardhman Spinning Welspun India
  • 56.
    STRENGTHS OF INDIANTEXTILE INDUSTRY India has rich resources of raw materials of textile industry. India is rich in highly trained manpower. India is highly competitive in spinning sector. Indian garment industry is very diverse in size, manufacturing facility, type of apparel produced, quantity and quality of output, cost, requirement for fabric etc.
  • 57.
      WEAKNESSES OFINDIAN TEXTILE INDUSTRY Indian textile industry is highly fragmented in industry structure, and is led by small scale companies. Indian labor laws are relatively unfavorable to the trades and there is an urgent need for labor reforms in India.
  • 58.
    FUTURE OUTLOOK Indiantextile industry will grow at an annualized rate of 16% between 2007 and 2012. It is expected to reach a level of $115 billion by 2012. Indian textile exports are projected to increase from $19.24 billion in 2006-2007 to $55 billion in 2012 - an annualized growth rate of over 22$. 17.37 million new jobs will be created by the textile industry in next three years - 12.02 direct and 5.35 indirect.
  • 59.
    ORGANIC CLOTHING Organicfarming methods are not limited to food production. The use of organic production and processing practices has now expanded into other crops, such as cotton. Unlike conventional cotton that accounts for about 25% of the global insecticides market by value and about 10% of the pesticides market, organic cotton is grown and processed without toxic pesticides, herbicides and synthetic fertilizers.
  • 60.
    SHOCKING FACTS ABOUTCONVENTIONAL (NON ORGANIC) COTTON Uses 2.03 billion pounds of synthetic fertilizers (formaldehyde, Sodium Lauryl Sulphate, parabens, chemical dyes etc) per year. Uses 25% of the world’s insecticides . Uses only about 3% of the farmland but consumes approximately 25 percent of the chemical pesticides and fertilizers (84 million pounds of chemical pesticides per year)
  • 61.
    ORGANIC COTTON SAVESLIVES No pesticides, hazardous chemicals (believed to cause up to a million cases of poisoning a year and 20,000 deaths) No formaldehyde (used as a finish): According to a National Cancer Institute (NCI)study, there is a link between formaldehyde exposure and cancer of the nasopharynx (the uppermost part of the throat) No nickel which can cause skin rashes.
  • 62.
    STANDARDS Global OrganicTextile Standard (GOTS) To be labelled “organic” requires fiber to be at least 95% organic. (The remaining 5% can be conventional fiber, but not of the same fiber as the organic portion) OE 100 and OE Blended OE 100 only allows a minimum of 95% organic fiber (exclusive of threads or non-textile accessories). The remaining 5% cannot be cotton. OE Blended requires at least 5% organic cotton content for the blended standard allowing the remaining fiber to be any fiber, including conventional cotton.
  • 63.
    TITLE OF THERESEARCH Comparative study of organic and non organic cotton garment exports from India
  • 64.
    OBJECTIVES OF THERESEARCH To analyze the direction and composition of organic & non organic garments exports from India. To highlight the factors influencing the export of organic and non organic garment exports from India. To study the competitive position of organic and non organic garment exports in International Market.
  • 65.
  • 66.
    Research Design: Theresearch design of the project is descriptive as it describes data and view points of the garments manufacturers & exporters in Delhi and Gurgaon. Descriptive research is used to obtain information concerning the current status of the phenomena to describe "what exists" with respect to variables in a given situation
  • 67.
    S ampling Design:Sampling refers to selecting some of the elements in a population by which one can draw conclusions about the entire population. Universe: Universe is the infinite number of elements which the researcher is targeting in the study. Since the study is restricted to Delhi and Gurgaon the universe for the study consists of all the exporters of organic and non organic cotton garments. Population: Population is the finite number of elements which the researcher is going to target in a particular area. The population consist of all exporters of organic and non organic cotton garments in Delhi and Gurgaon.
  • 68.
    Sampling Unit: SamplingUnit is the single unit of the population. The sampling unit for this research is any single individual or firm who export organic and non organic cotton garments. Extent: Extent refers to the geographical area where there is a scope of population. The extent of the study is Delhi and Gurgaon. Time: Time involved for the study conducted is 1 month . Sampling Technique: The selection of the respondents was done on the basis of convenience sampling technique and snowball technique based on the non probability method of sampling.
  • 69.
    Sample size: Samplesize is the size of sample drawn from the population which is the true representative of the research. The number of respondents included in the study was 25 for convenience in evaluating and analyzing the data and because of time constraint.
  • 70.
    LIMITATIONS OF THESTUDY While every effort was made to get the questionnaire filled personally, even then some elements of biasness might have crept in. Only 25 respondents have been contacted due to time constraint. Sample may not be the true representative of the universe. Generally the respondents were busy in their work and were not interested in responding. The study was conducted within the boundaries of mentioned areas only.
  • 71.
    DATA ANALYSIS ANDINTERPRETATION
  • 72.
    Fig-5.1 No ofmanufactures and traders
  • 73.
    Table-5.2 Types ofcotton garments exported Products Organic Non organic Knitted Woven Knitted Woven No of responses 8 9 18 22 Total no of responses 17 17 40 40 Percentage 47.06%% 52.94% 45% 55% Percentage of people exporting organic & non organic garments 40% 100%
  • 74.
    Fig-5.3(a) Type oforganic cotton garment exported
  • 75.
    Fig-5.3(b) Type ofnon organic cotton garment exported
  • 76.
    Fig-5.4(a) Export countriesof organic cotton garments
  • 77.
    Fig-5.4(b) Export countriesof non organic cotton garments
  • 78.
    Fig-5.5(a) Countries givingcompetition to organic cotton garment exports
  • 79.
    Fig-5.5(b) Countries givingcompetition to non organic cotton garment exports
  • 80.
    Fig-5.6(a) Ranks offactors influencing the export of organic cotton garments
  • 81.
    Fig-5.6(b) Ranks offactors influencing the export of non organic cotton garments
  • 82.
    Fig-5.7(a) Trend oforganic cotton garments exports started manufacture
  • 83.
    Fig-5.7(b) Trend ofnon organic cotton garments exports started manufacture
  • 84.
    Table 5.8- Proportionof export of organic cotton garments out of out of total exports Proportion of exports No of responses Percentage 0% 15 60% 1-25% 9 36% 25-50% 0 0% 50-75% 1 4% 75-100% 0 0% 100% 0 0% Total 25 100%
  • 85.
    Fig-5.9(a)-Rating of qualityof organic cotton garments better than non organic cotton garments
  • 86.
    Fig-5.9(b)-Rating of peoplein foreign countries are using more organic garments than non organic cotton garments
  • 87.
    Fig-5.9(c)-Rating of exportof organic cotton garments more than non organic cotton garments
  • 88.
    Fig-5.9(d)-Rating of organiccotton garments are more eco-friendly than non organic cotton garments
  • 89.
    Fig-5.9(e)-Rating of lengthyprocedure in certification of organic cotton garments
  • 90.
    Fig-5.9(f)-Rating of productiontechnology of organic cotton garments complex than non organic cotton garments
  • 91.
    Table 5.10-Combined resultof all the above factors Factors Mean Rank Quality of garments produced from organic cotton is substantially better than non organic 0.88 2 People of foreign countries are using more organic garments than non organic one 0.56 4 Export of organic garments is more than non organic garment 0.08 6 Organic cotton garments are more eco friendly than non organic 1 1 Lengthy procedure in certification of organic cotton garments 0.76 3 Production technology of organic cotton garments is complex than non organic cotton garments 0.24 5
  • 92.
    FINDINGS 30% ofthe organic exporters export women dresses and 27% of non organic exporters export shirts. 40% of the exporters produce organic cotton garments and 100% produce non organic cotton garments Most favorable export country for organic and non organic cotton garments is USA & Europe. In case of competition – organic garments exporters faces competition with Syria but non organic garments exporters with China Factor which influences the export of – organic is profit margin and for non organic is price competitiveness.
  • 93.
    CONTD …. Trendof both organic and non organic is increasing but still there much export of non organic cotton garments. People agree to the fact that organic cotton garments are more eco friendly then non organic. Demand for organic garments is increasing in foreign markets. Quality of organic is better then non organic Organic cotton garments involve highly complex technology and certification procedure
  • 94.
    SUGGESTIONS The companyshould engage more in organic garments as it is a growing market and not many people are there in this business As organic cotton garments involves high profit so the company can look for more earnings. There are still huge markets which are still untapped so the company can get into this and increase its market share. When there are less competitors the company can have an edge over the others in organic cotton garments business.
  • 95.
    CONTD …… Inthe future “go green” will be the new concept so organic clothes will be in demand more. In case of non organic sector there are many competitors so the profit margin will be less. Very less percentage of organic cotton textile products are exported from Delhi and Gurgaon There is more scope of export of organic cotton textile products in U.S. & European markets.
  • 96.