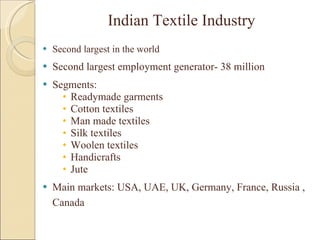
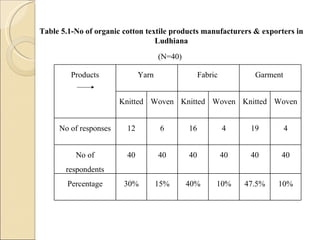
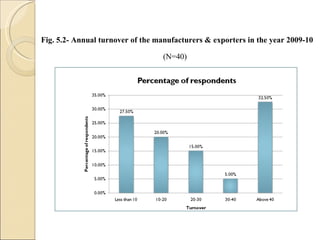
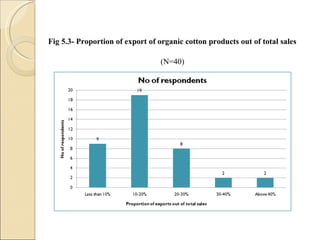
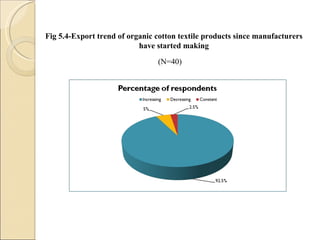
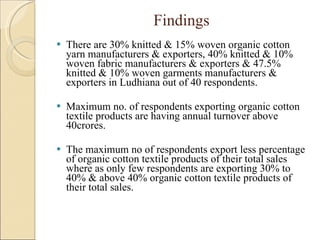
Summer Training Project on Organic Cotton: An Opportunity for Ludhiana textile industry to trade in Global textile market   Undertaken at AARTI INTERNATIONAL LIMITED Presented by: Nitin Goel MBA-IB (2B) Roll No. 94972238291
Indian Textile Industry Second largest in the world Second largest employment generator- 38 million Segments: Readymade garments Cotton textiles  Man made textiles Silk textiles Woolen textiles Handicrafts Jute Main markets: USA, UAE, UK, Germany, France, Russia , Canada
Major players   Arvind Mills Raymonds Vardhaman Spinning  Welspun India Alok Industries Ltd Madura Garments
Future Outlook Will grow at an annualized rate of 16% between 2007 and 2012 Expected to reach a level of $115 billion by 2012 Share in world textile trade to increase from current 3% to 7% Exports projected to increase from $19.24 billion in 2006-2007 to $55 billion in 2012 17.37 million new jobs will be created in next five years - 12.02 direct and 5.35 indirect
Introduction to Aarti Group
Group Profile Registered office/Corporate office  :  G.T. Road, Millar Ganj, Ludhiana Year of Incorporation  :  1977 The Aarti Group comprises of: Aarti Steels Limited Aarti International Limited Aarti Theatre Deepak hospital
Brief History Incorporated in 1977 in the name of Aarti Steels Limited at Ludhiana Steel Plant with a capacity of 1.25lacs tones per annum Steel Plant in Orissa (India) with the capacity of 0.5 million tons per annum Diversified into yarn manufacturing in 1996 with the installe d capacity of 27000 spindles Deepak Memorial Hospital located in Ludhiana is a multi specialty Hospital with 24*7 medical emergency facilities Cinema which has been a constant source of joy to the residents
Mission & Vision Mission “ Providing efficient & reliable services to the customer by adding genuine value to the product” Vision “ To be globally recognized as a supplier of choice in this highly competitive global economy”
Business Portfolio SHARE OF EACH BUSINESS IN GROUP TURNOVER
Product Range   Yarn  Single yarn in count range of Ne 16s/1 to Ne 80s/1 100% Cotton- Combed Compact Yarn Hosiery Yarn Double yarn in count range of Ne 16s/2 to Ne 80s/2 100% Cotton- Combed  Compact Yarn Hosiery Yarn
Steel Carbon Spring Steel Low Alloy Steels Wire Rods Wires drawn and galvanized Coal Washer Sponge Iron
Introduction to Aarti International Ltd.
Aarti Yarn Range   Single yarn in count range of Ne 16s/1 to Ne 80s/1   100% Cotton- Combed Yarn   100% Cotton-Compact Yarn   100% Cotton-Hosiery Yarn Double yarn in count range of Ne 16s/2 to Ne 80s/2 100% Cotton- Combed Yarn   100% Cotton-Compact Yarn   100% Cotton-Hosiery Yarn
Philosophies    Focus on Value Added Yarn Improvement in Capacity Utilization Focus on high value customers Focus on improving yields
Quality policy Committed to meet the customer expectations by continuous efforts to improve process & technology Quality objectives To provide better human resources To achieve maximum utilization of resources
Departments Production Department Research & Development Department Maintenance & Engineering Department Human Resource Department Stores & Purchase Department Excise & Dispatch Department Marketing Department Finance Department
Markets   Major export destinations are as follows: Hong Kong China South Korea Taiwan Bangladesh European Union
Major domestic market destinations are as follows: Gujarat Mumbai Uttar Pradesh Delhi Haryana Punjab
Accolades & awards USTERIZED quality certificate from USTER, Switzerland. Supima Licence Cotton USA Licence from Cotton Council International. Spirituality at Workplace Award
 
Strengths   Good brand equity Good technological base High Production Capacity
Weaknesses Comparatively high prices Lesser degree of promotional activity High labor turnover
Opportunities Favorable demand conditions-large, growing domestic & international market India - Ban on Cotton exports The government allows 100 per cent FDI in the textiles sector under the automatic route
Threats   Cotton prices soar Growing competition from yarn producing units in the unorganized sector Competition from other established groups like Nahar, Vardhman, Anshupati Textiles, Malwa etc.
Ratio Analysis of Aarti International Ltd.
Liquidity Ratios
Current ratio ( Fig. In Crores ) Year  2006-07 2007-08 2008-09 Current assets 167 193 186 Current liabilities 85 93 87 Current ratio 1.96:1  2.07:1 2.14:1
Quick Ratio ( Fig. In Crores ) Year  2006-07 2007-08 2008-09 Quick assets 71 62 76 Current liabilities 85 93 87 Quick ratio 0.84:1 0.67:1 0.87:1
Activity Ratios
Inventory turnover ratio ( Fig. In Crores ) Year  2006-07 2007-08 2008-09 Cost of goods sold 284 218 278 Average inventory 98.5 115 121 Inventory turnover ratio ( in times) 2.88 1.89 2.3 Inventory holding period ( in days) 126.7 192.3 158.7
Debtor turnover ratio ( Fig. In Crores ) Year  2006-07 2007-08 2008-09 Net credit sales 275 276 345 Average debtors 64 61 64 Debtors turnover ratio 4.24 4.49 5.43 Debtor conversion period 86.1 81.3 67.2
Creditor turnover ratio ( Fig. In Crores ) Year  2006-07 2007-08 2008-09 Net credit purchases 248.5 190.7 187.9 Average creditors 10.57 11.43 11 Creditor turnover ratio ( in times ) 23.51 16.68 17.08 Average payment period ( in days ) 15.52 21.88 21.37
Capital structure ratios
Debt –equity ratio ( Fig. In Crores ) Year  2006-07 2007-08 2008-09 Debt  256 368 362 Equity  163 170 162 Debt equity ratio 1.57:1 2.16:1 2.23:1
Proprietary ratio  ( Fig. In Crores ) Year  2006-07 2007-08 2008-09 Shareholder fund 162 170 162 Equity  444 238 536 Proprietary ratio 37% 71% 30%
Solvency ratio Year  2006-07 2007-08 2008-09 Proprietary  37% 71% 30% Solvency ratio 63% 29% 70%
Profitability ratios
  Gross profit ratio ( Fig. In Crores ) Year  2006-07 2007-08 2008-09 Gross profit 73 58 68 Net sales 275 276 345 Gross profit ratio 26.6% 20.9% 19.6%
Net profit ratio ( Fig. In Crores ) Year  2006-07 2007-08 2008-09 Net profit 14.35 12.4 10.97 Net sales 275 276 345 Net profit ratio 5.2% 4.49% 3.96%
Operating profit ratio ( Fig. In Crores ) Year  2006-07 2007-08 2008-09 Operating profit 56 41 35 Net sales 275 276 345 Operating ratio 20.34% 15% 9.08%
Return on shareholders’ equity ( Fig. In Crores ) Year  2006-07 2007-08 2008-09 Net profit after taxes 14.35 12.4 10.97 Shareholders’ fund 275 170 170 Return on shareholders’ equity 5.22% 7.3% 6.45%
Trend analysis
Trend of  Turnover Years  Sales (Rs. In Crores) Trend ( In %) 2004-05 143.68 100 2005-06 154.28 107.38 2006-07 274.92 191.34 2007-08 276.09 192.16 2008-09 345.43 240.42
Trend of Net Profit / Loss Years  Net Profit (Rs. In Crores) Trend ( In %) 2004-05 17.49 100 2005-06 18.61 106.4 2006-07 14.35 82.05 2007-08 12.41 70.95 2008-09 10.97 62.72
Trend of EPS Years  EPS (Rs.) Trend (In %) 2004-05 25.98 100 2005-06 25.29 97.34 2006-07 16.61 63.93 2007-08 14.03 54 2008-09 11.47 (31.25)
Introduction to the Project
Organic cotton Originates from organic agriculture Certified ‘organic’ by certification bodies Aims for an optimum and sustainable use of local natural resources No application of external inputs like pesticides, chemical fertilizers, herbicides and chemically treated or genetically modified (GM) seed External ‘organic’ inputs may be used More labour intensive Yields are lower
Standards Global Organic Textile Standard (GOTS) To be labelled “organic” requires fiber to be at least 95% organic. (The remaining 5% can be conventional fiber, but not of the same fiber as the organic portion) OE 100 and OE Blended OE 100 only allows a minimum of 95% organic fiber (exclusive of threads or non-textile accessories). The remaining 5% cannot be cotton. OE Blended requires at least 5% organic cotton content for the blended standard allowing the remaining fiber to be any fiber, including conventional cotton.
Global Organic Cotton Market Retailers C&A (Belgium) Nike, Inc. (Oregon, USA) Walmart (Arkansas, USA) Williams-Sonoma, Inc. (California, USA and recorded last year as Pottery Barn) H&M (Sweden) Knitwear (New York, USA) Coop Switzerland Green source Organic Clothing Co. (Washington, USA) Levi Strauss & Co. (California, USA) Target (Minnesota, USA) Adidas (Germany) Nordstrom
Manufacturers Organic cotton yarns, fabrics, and finished goods producing regions includes: China Southeast Asia Indonesia India Pakistan Bangladesh Turkey Mexico United States
 
Global retail sales of organic cotton products Source: Organic Exchange 2009 Market Report
Future outlook According to OE forecasts: Global organic cotton market will grow 20 to 40 percent in both 2010 and 2011  Reaching about $5.1 billion market in 2010 and $6.0 billion market in 2011
Title of the Research Organic cotton:  An opportunity for Ludhiana textile industry to trade in global textile market
Objectives of the research To know the trend of export of organic cotton textile products from Ludhiana & the reasons for such trend. To know the companies’ integration with valid operational certificate for manufacturing & trading organic cotton textile product. To know the factors considered while procuring raw material for organic cotton textile product.  To know the factors influencing people to enter into organic cotton textile industry.
Research Methodology
Research Design The research design of the project is  descriptive  as it describes data and view points of the organic cotton textile products manufacturers & exporters in Ludhiana.
Universe All the manufacturers & exporters of organic cotton textile products Population All the manufacturers & exporters of organic cotton textile products in Ludhiana Sampling Unit Any single individual or firm who manufactures & exports organic cotton textile products Sampling Technique Convenience sampling technique and Snowball technique  Sample size 40
Limitations of the study Elements of biasness might have crept in Only 40 respondents have been contacted due to time constraint Generally the respondents were busy in their work and were not interested in responding Respondents were reluctant to disclose complete and correct information about themselves and their organizations
Data Analysis and Interpretation
Table 5.1-No of organic cotton textile products manufacturers & exporters in Ludhiana (N=40) Products Yarn  Fabric  Garment  Knitted Woven Knitted Woven Knitted Woven No of responses 12 6 16 4 19 4 No of respondents 40 40 40 40 40 40 Percentage 30% 15% 40% 10% 47.5% 10%
Fig. 5.2- Annual turnover of the manufacturers & exporters in the year 2009-10 (N=40)
Fig 5.3- Proportion of export of organic cotton products out of total sales (N=40)
Fig 5.4-Export trend of organic cotton textile products since manufacturers have started making (N=40)
Fig 5.5-Factors resulting in an increasing demand of organic cotton textile products (N=40)
Fig 5.6-Factors resulting in decreasing & constant demand of organic cotton textile products (N=40)
Fig 5.7-No. holders of valid operational certificate applicable for the production/ trade of organic cotton textile products (N=40)
Fig 5.8-Holders of different types of operational certificate (N=40)
Consideration of various parameters while procuring raw material for organic cotton textile products  Table 5.9(a)-Rating of payment terms factor (N=40) Rating No. of respondents Product Most considered (+2) 23 46 More considered (+1) 8 8 Neutral (0) 8 0 Less considered (-1) 1 -1 Least considered (-2) 0 0 Total  40 53 Mean  1.325
Table 5.9(b)-Rating of price factor (N=40) Rating No. of respondents Product Most considered (+2) 26 52 More considered (+1) 13 13 Neutral (0) 1 0 Less considered (-1) 0 0 Least considered (-2) 0 0 Total  Mean  40 65 1.625
Table 5.9(c)-Rating of quality factor (N=40) Rating No. of respondents Product Most considered (+2) 16 32 More considered (+1) 14 14 Neutral (0) 9 0 Less considered (-1) 1 -1 Least considered (-2) 0 0 Total  40 45 Mean  1.125
Table 5.9(d)-Rating of lead time factor (N=40) Rating No. of respondents Product Most considered (+2) 4 8 More considered (+1) 14 14 Neutral (0) 14 0 Less considered (-1) 6 -6 Least considered (-2) 2 -4 Total  40 12 Mean  0.30
Table 5.9(e)-Rating of long term relationship factor (N=40) Rating No. of respondents Product Most considered (+2) 12 24 More considered (+1) 12 12 Neutral (0) 8 0 Less considered (-1) 3 -3 Least considered (-2) 5 -10 Total  40 23 Mean  0.575
Table 5.9(f)-Rating of reputation of supplier factor (N=40) Rating No. of respondents Product Most considered (+2) 7 14 More considered (+1) 12 12 Neutral (0) 11 0 Less considered (-1) 7 -7 Least considered (-2) 3 -6 Total  40 13 Mean  0.325
Fig 5.10-Combined result of various parameters while procuring raw material
Factors influencing people to enter in to organic cotton textile products business Table 5.11(a)-Rating of increasing basket size factor (N=40) Rating No. of respondents Product Most influencing (+2) 17 34 More influencing (+1) 11 11 Neutral (0) 5 0 Less influencing (-1) 4 -4 Least influencing (-2) 3 -6 Total  40 35 Mean  0.875
Table 5.11(b)-Rating of Highly profitable factor (N=40) Rating No. of respondents Product Most influencing (+2) 4 8 More influencing (+1) 18 18 Neutral (0) 14 0 Less influencing (-1) 2 -2 Least influencing (-2) 1 -2 Total  40 22 Mean  0.55
Table 5.11(c)-Rating of Necessary for survival factor (N=40) Rating No. of respondents Product Most influencing (+2) 3 6 More influencing (+1) 16 16 Neutral (0) 14 0 Less influencing (-1) 7 -7 Least influencing (-2) 0 0 Total  40 15 Mean  0.375
Table 5.11(d)-Rating of to remain competitive factor (N=40) Rating No. of respondents Product Most influencing (+2) 11 22 More influencing (+1) 18 18 Neutral (0) 6 0 Less influencing (-1) 4 -4 Least influencing (-2) 1 -2 Total  40 34 Mean  0.85
Table 5.11(e)-Rating of helps in branding or differentiation factor (N=40) Rating No. of respondents Product Most influencing (+2) 1 2 More influencing (+1) 12 12 Neutral (0) 9 0 Less influencing (-1) 13 -13 Least influencing (-2) 5 -10 Total  40 -9 Mean  0.225
Table 5.11(f)-Rating of global demand factor (N=40) Rating No. of respondents Product Most influencing (+2) 19 38 More influencing (+1) 10 10 Neutral (0) 7 0 Less influencing (-1) 3 -3 Least influencing (-2) 1 -2 Total  40 43 Mean  1.075
Combined result of factors influencing people to enter into organic cotton textile products business Fig 5.12-Factors influencing people to enter into organic cotton textile products business
Table 5.13-Steps that government should take to boost the sales of organic cotton textile products in the global textile market (N=40) Steps  Regulate prices Favourable global policies Create awareness of eco-friendly products Encourage farming of organic cotton Incentives to farmers to grow organic cotton Others No of responses 24 7 17 9 6 1 No of respondents 40 40 40 40 40 40 Percentage  60% 17.5% 42.5% 22.5% 15% 2.5%
Findings There are 30% knitted & 15% woven organic cotton yarn manufacturers & exporters, 40% knitted & 10% woven fabric manufacturers & exporters & 47.5% knitted & 10% woven garments manufacturers & exporters in Ludhiana out of 40 respondents. Maximum no. of respondents exporting organic cotton textile products are having annual turnover above 40crores. The maximum no of respondents export less percentage of organic cotton textile products of their total sales where as only few respondents are exporting 30% to 40% & above 40% organic cotton textile products of their total sales.
An increasing demand of organic cotton textile product in the overseas market has resulted in an increase in the exports of organic cotton textile products. High prices & availability of substitutes are the most important factors which have resulted in constant & decreasing exports of their organic cotton textile products.  All the respondents have valid operational certificate for the production & trading of organic cotton textile products. Maximum no of respondents dealing in organic cotton textile products hold both GOTS & OE certificates & there are 35% of total respondents who holds only GOTS certificate & 2.5% of total respondents hold only OE certificate.
Price is the most important factor which is most considered at the time of purchase of raw material for organic cotton textile products.  Global demand, competition & increasing basket size has more influenced the respondents to enter into organic cotton textile products business.  Government should more regulate prices of organic cotton textile products, create awareness of eco-friendly products, encourage farming of organic cotton & make favourable policies so as to boost the sales of organic cotton textile products in the global textile market.
Conclusion and Suggestions
Conclusion Demand for organic cotton textile products is increasing in the global textile market because it is of better quality & skin friendly. Very less percentage of organic cotton textile products are exported from Ludhiana. High prices & availability of substitutes can lead to decrease in the demand of organic cotton textile products. All the manufacturers & exporters hold valid operational certificate for manufacturing & trading organic cotton textile products.
Price, payment terms & quality factors are more considered at the time of procurement of raw material for organic cotton textile products. Increasing global demand, high profit margin & increasing competition are attracting more people to enter into organic cotton textile products business. There is less government support in promoting export of organic cotton textile products from Ludhiana.
Suggestions and Recommendations Awareness should be created among the consumer towards environment friendly & skin friendly products. The manufacturers & exporters of organic cotton textile products should be more cautious while purchasing raw material & should consider lead time. The manufacturers & exporters of organic cotton textile products should try to maintain strong relationship with the supplier so that their own supply should not get affected.
Government should regulate the prices of organic cotton textile products because products of organic cotton are more costly than its substitutes. Government should provide incentives to the farmers to encourage organic farming. There is more scope of export of organic cotton textile products in U.S. & European markets.
THANK YOU

Presentation On Aarti International Ltd

  • 1.
    Summer Training Projecton Organic Cotton: An Opportunity for Ludhiana textile industry to trade in Global textile market   Undertaken at AARTI INTERNATIONAL LIMITED Presented by: Nitin Goel MBA-IB (2B) Roll No. 94972238291
  • 2.
    Indian Textile IndustrySecond largest in the world Second largest employment generator- 38 million Segments: Readymade garments Cotton textiles Man made textiles Silk textiles Woolen textiles Handicrafts Jute Main markets: USA, UAE, UK, Germany, France, Russia , Canada
  • 3.
    Major players Arvind Mills Raymonds Vardhaman Spinning Welspun India Alok Industries Ltd Madura Garments
  • 4.
    Future Outlook Willgrow at an annualized rate of 16% between 2007 and 2012 Expected to reach a level of $115 billion by 2012 Share in world textile trade to increase from current 3% to 7% Exports projected to increase from $19.24 billion in 2006-2007 to $55 billion in 2012 17.37 million new jobs will be created in next five years - 12.02 direct and 5.35 indirect
  • 5.
  • 6.
    Group Profile Registeredoffice/Corporate office : G.T. Road, Millar Ganj, Ludhiana Year of Incorporation : 1977 The Aarti Group comprises of: Aarti Steels Limited Aarti International Limited Aarti Theatre Deepak hospital
  • 7.
    Brief History Incorporatedin 1977 in the name of Aarti Steels Limited at Ludhiana Steel Plant with a capacity of 1.25lacs tones per annum Steel Plant in Orissa (India) with the capacity of 0.5 million tons per annum Diversified into yarn manufacturing in 1996 with the installe d capacity of 27000 spindles Deepak Memorial Hospital located in Ludhiana is a multi specialty Hospital with 24*7 medical emergency facilities Cinema which has been a constant source of joy to the residents
  • 8.
    Mission & VisionMission “ Providing efficient & reliable services to the customer by adding genuine value to the product” Vision “ To be globally recognized as a supplier of choice in this highly competitive global economy”
  • 9.
    Business Portfolio SHAREOF EACH BUSINESS IN GROUP TURNOVER
  • 10.
    Product Range  Yarn Single yarn in count range of Ne 16s/1 to Ne 80s/1 100% Cotton- Combed Compact Yarn Hosiery Yarn Double yarn in count range of Ne 16s/2 to Ne 80s/2 100% Cotton- Combed Compact Yarn Hosiery Yarn
  • 11.
    Steel Carbon SpringSteel Low Alloy Steels Wire Rods Wires drawn and galvanized Coal Washer Sponge Iron
  • 12.
    Introduction to AartiInternational Ltd.
  • 13.
    Aarti Yarn Range  Single yarn in count range of Ne 16s/1 to Ne 80s/1   100% Cotton- Combed Yarn   100% Cotton-Compact Yarn   100% Cotton-Hosiery Yarn Double yarn in count range of Ne 16s/2 to Ne 80s/2 100% Cotton- Combed Yarn   100% Cotton-Compact Yarn   100% Cotton-Hosiery Yarn
  • 14.
    Philosophies    Focuson Value Added Yarn Improvement in Capacity Utilization Focus on high value customers Focus on improving yields
  • 15.
    Quality policy Committedto meet the customer expectations by continuous efforts to improve process & technology Quality objectives To provide better human resources To achieve maximum utilization of resources
  • 16.
    Departments Production DepartmentResearch & Development Department Maintenance & Engineering Department Human Resource Department Stores & Purchase Department Excise & Dispatch Department Marketing Department Finance Department
  • 17.
    Markets Major export destinations are as follows: Hong Kong China South Korea Taiwan Bangladesh European Union
  • 18.
    Major domestic marketdestinations are as follows: Gujarat Mumbai Uttar Pradesh Delhi Haryana Punjab
  • 19.
    Accolades & awardsUSTERIZED quality certificate from USTER, Switzerland. Supima Licence Cotton USA Licence from Cotton Council International. Spirituality at Workplace Award
  • 20.
  • 21.
    Strengths Good brand equity Good technological base High Production Capacity
  • 22.
    Weaknesses Comparatively highprices Lesser degree of promotional activity High labor turnover
  • 23.
    Opportunities Favorable demandconditions-large, growing domestic & international market India - Ban on Cotton exports The government allows 100 per cent FDI in the textiles sector under the automatic route
  • 24.
    Threats Cotton prices soar Growing competition from yarn producing units in the unorganized sector Competition from other established groups like Nahar, Vardhman, Anshupati Textiles, Malwa etc.
  • 25.
    Ratio Analysis ofAarti International Ltd.
  • 26.
  • 27.
    Current ratio (Fig. In Crores ) Year 2006-07 2007-08 2008-09 Current assets 167 193 186 Current liabilities 85 93 87 Current ratio 1.96:1 2.07:1 2.14:1
  • 28.
    Quick Ratio (Fig. In Crores ) Year 2006-07 2007-08 2008-09 Quick assets 71 62 76 Current liabilities 85 93 87 Quick ratio 0.84:1 0.67:1 0.87:1
  • 29.
  • 30.
    Inventory turnover ratio( Fig. In Crores ) Year 2006-07 2007-08 2008-09 Cost of goods sold 284 218 278 Average inventory 98.5 115 121 Inventory turnover ratio ( in times) 2.88 1.89 2.3 Inventory holding period ( in days) 126.7 192.3 158.7
  • 31.
    Debtor turnover ratio( Fig. In Crores ) Year 2006-07 2007-08 2008-09 Net credit sales 275 276 345 Average debtors 64 61 64 Debtors turnover ratio 4.24 4.49 5.43 Debtor conversion period 86.1 81.3 67.2
  • 32.
    Creditor turnover ratio( Fig. In Crores ) Year 2006-07 2007-08 2008-09 Net credit purchases 248.5 190.7 187.9 Average creditors 10.57 11.43 11 Creditor turnover ratio ( in times ) 23.51 16.68 17.08 Average payment period ( in days ) 15.52 21.88 21.37
  • 33.
  • 34.
    Debt –equity ratio( Fig. In Crores ) Year 2006-07 2007-08 2008-09 Debt 256 368 362 Equity 163 170 162 Debt equity ratio 1.57:1 2.16:1 2.23:1
  • 35.
    Proprietary ratio ( Fig. In Crores ) Year 2006-07 2007-08 2008-09 Shareholder fund 162 170 162 Equity 444 238 536 Proprietary ratio 37% 71% 30%
  • 36.
    Solvency ratio Year 2006-07 2007-08 2008-09 Proprietary 37% 71% 30% Solvency ratio 63% 29% 70%
  • 37.
  • 38.
      Gross profitratio ( Fig. In Crores ) Year 2006-07 2007-08 2008-09 Gross profit 73 58 68 Net sales 275 276 345 Gross profit ratio 26.6% 20.9% 19.6%
  • 39.
    Net profit ratio( Fig. In Crores ) Year 2006-07 2007-08 2008-09 Net profit 14.35 12.4 10.97 Net sales 275 276 345 Net profit ratio 5.2% 4.49% 3.96%
  • 40.
    Operating profit ratio( Fig. In Crores ) Year 2006-07 2007-08 2008-09 Operating profit 56 41 35 Net sales 275 276 345 Operating ratio 20.34% 15% 9.08%
  • 41.
    Return on shareholders’equity ( Fig. In Crores ) Year 2006-07 2007-08 2008-09 Net profit after taxes 14.35 12.4 10.97 Shareholders’ fund 275 170 170 Return on shareholders’ equity 5.22% 7.3% 6.45%
  • 42.
  • 43.
    Trend of Turnover Years Sales (Rs. In Crores) Trend ( In %) 2004-05 143.68 100 2005-06 154.28 107.38 2006-07 274.92 191.34 2007-08 276.09 192.16 2008-09 345.43 240.42
  • 44.
    Trend of NetProfit / Loss Years Net Profit (Rs. In Crores) Trend ( In %) 2004-05 17.49 100 2005-06 18.61 106.4 2006-07 14.35 82.05 2007-08 12.41 70.95 2008-09 10.97 62.72
  • 45.
    Trend of EPSYears EPS (Rs.) Trend (In %) 2004-05 25.98 100 2005-06 25.29 97.34 2006-07 16.61 63.93 2007-08 14.03 54 2008-09 11.47 (31.25)
  • 46.
  • 47.
    Organic cotton Originatesfrom organic agriculture Certified ‘organic’ by certification bodies Aims for an optimum and sustainable use of local natural resources No application of external inputs like pesticides, chemical fertilizers, herbicides and chemically treated or genetically modified (GM) seed External ‘organic’ inputs may be used More labour intensive Yields are lower
  • 48.
    Standards Global OrganicTextile Standard (GOTS) To be labelled “organic” requires fiber to be at least 95% organic. (The remaining 5% can be conventional fiber, but not of the same fiber as the organic portion) OE 100 and OE Blended OE 100 only allows a minimum of 95% organic fiber (exclusive of threads or non-textile accessories). The remaining 5% cannot be cotton. OE Blended requires at least 5% organic cotton content for the blended standard allowing the remaining fiber to be any fiber, including conventional cotton.
  • 49.
    Global Organic CottonMarket Retailers C&A (Belgium) Nike, Inc. (Oregon, USA) Walmart (Arkansas, USA) Williams-Sonoma, Inc. (California, USA and recorded last year as Pottery Barn) H&M (Sweden) Knitwear (New York, USA) Coop Switzerland Green source Organic Clothing Co. (Washington, USA) Levi Strauss & Co. (California, USA) Target (Minnesota, USA) Adidas (Germany) Nordstrom
  • 50.
    Manufacturers Organic cottonyarns, fabrics, and finished goods producing regions includes: China Southeast Asia Indonesia India Pakistan Bangladesh Turkey Mexico United States
  • 51.
  • 52.
    Global retail salesof organic cotton products Source: Organic Exchange 2009 Market Report
  • 53.
    Future outlook Accordingto OE forecasts: Global organic cotton market will grow 20 to 40 percent in both 2010 and 2011 Reaching about $5.1 billion market in 2010 and $6.0 billion market in 2011
  • 54.
    Title of theResearch Organic cotton: An opportunity for Ludhiana textile industry to trade in global textile market
  • 55.
    Objectives of theresearch To know the trend of export of organic cotton textile products from Ludhiana & the reasons for such trend. To know the companies’ integration with valid operational certificate for manufacturing & trading organic cotton textile product. To know the factors considered while procuring raw material for organic cotton textile product. To know the factors influencing people to enter into organic cotton textile industry.
  • 56.
  • 57.
    Research Design Theresearch design of the project is descriptive as it describes data and view points of the organic cotton textile products manufacturers & exporters in Ludhiana.
  • 58.
    Universe All themanufacturers & exporters of organic cotton textile products Population All the manufacturers & exporters of organic cotton textile products in Ludhiana Sampling Unit Any single individual or firm who manufactures & exports organic cotton textile products Sampling Technique Convenience sampling technique and Snowball technique Sample size 40
  • 59.
    Limitations of thestudy Elements of biasness might have crept in Only 40 respondents have been contacted due to time constraint Generally the respondents were busy in their work and were not interested in responding Respondents were reluctant to disclose complete and correct information about themselves and their organizations
  • 60.
    Data Analysis andInterpretation
  • 61.
    Table 5.1-No oforganic cotton textile products manufacturers & exporters in Ludhiana (N=40) Products Yarn Fabric Garment Knitted Woven Knitted Woven Knitted Woven No of responses 12 6 16 4 19 4 No of respondents 40 40 40 40 40 40 Percentage 30% 15% 40% 10% 47.5% 10%
  • 62.
    Fig. 5.2- Annualturnover of the manufacturers & exporters in the year 2009-10 (N=40)
  • 63.
    Fig 5.3- Proportionof export of organic cotton products out of total sales (N=40)
  • 64.
    Fig 5.4-Export trendof organic cotton textile products since manufacturers have started making (N=40)
  • 65.
    Fig 5.5-Factors resultingin an increasing demand of organic cotton textile products (N=40)
  • 66.
    Fig 5.6-Factors resultingin decreasing & constant demand of organic cotton textile products (N=40)
  • 67.
    Fig 5.7-No. holdersof valid operational certificate applicable for the production/ trade of organic cotton textile products (N=40)
  • 68.
    Fig 5.8-Holders ofdifferent types of operational certificate (N=40)
  • 69.
    Consideration of variousparameters while procuring raw material for organic cotton textile products Table 5.9(a)-Rating of payment terms factor (N=40) Rating No. of respondents Product Most considered (+2) 23 46 More considered (+1) 8 8 Neutral (0) 8 0 Less considered (-1) 1 -1 Least considered (-2) 0 0 Total 40 53 Mean 1.325
  • 70.
    Table 5.9(b)-Rating ofprice factor (N=40) Rating No. of respondents Product Most considered (+2) 26 52 More considered (+1) 13 13 Neutral (0) 1 0 Less considered (-1) 0 0 Least considered (-2) 0 0 Total Mean 40 65 1.625
  • 71.
    Table 5.9(c)-Rating ofquality factor (N=40) Rating No. of respondents Product Most considered (+2) 16 32 More considered (+1) 14 14 Neutral (0) 9 0 Less considered (-1) 1 -1 Least considered (-2) 0 0 Total 40 45 Mean 1.125
  • 72.
    Table 5.9(d)-Rating oflead time factor (N=40) Rating No. of respondents Product Most considered (+2) 4 8 More considered (+1) 14 14 Neutral (0) 14 0 Less considered (-1) 6 -6 Least considered (-2) 2 -4 Total 40 12 Mean 0.30
  • 73.
    Table 5.9(e)-Rating oflong term relationship factor (N=40) Rating No. of respondents Product Most considered (+2) 12 24 More considered (+1) 12 12 Neutral (0) 8 0 Less considered (-1) 3 -3 Least considered (-2) 5 -10 Total 40 23 Mean 0.575
  • 74.
    Table 5.9(f)-Rating ofreputation of supplier factor (N=40) Rating No. of respondents Product Most considered (+2) 7 14 More considered (+1) 12 12 Neutral (0) 11 0 Less considered (-1) 7 -7 Least considered (-2) 3 -6 Total 40 13 Mean 0.325
  • 75.
    Fig 5.10-Combined resultof various parameters while procuring raw material
  • 76.
    Factors influencing peopleto enter in to organic cotton textile products business Table 5.11(a)-Rating of increasing basket size factor (N=40) Rating No. of respondents Product Most influencing (+2) 17 34 More influencing (+1) 11 11 Neutral (0) 5 0 Less influencing (-1) 4 -4 Least influencing (-2) 3 -6 Total 40 35 Mean 0.875
  • 77.
    Table 5.11(b)-Rating ofHighly profitable factor (N=40) Rating No. of respondents Product Most influencing (+2) 4 8 More influencing (+1) 18 18 Neutral (0) 14 0 Less influencing (-1) 2 -2 Least influencing (-2) 1 -2 Total 40 22 Mean 0.55
  • 78.
    Table 5.11(c)-Rating ofNecessary for survival factor (N=40) Rating No. of respondents Product Most influencing (+2) 3 6 More influencing (+1) 16 16 Neutral (0) 14 0 Less influencing (-1) 7 -7 Least influencing (-2) 0 0 Total 40 15 Mean 0.375
  • 79.
    Table 5.11(d)-Rating ofto remain competitive factor (N=40) Rating No. of respondents Product Most influencing (+2) 11 22 More influencing (+1) 18 18 Neutral (0) 6 0 Less influencing (-1) 4 -4 Least influencing (-2) 1 -2 Total 40 34 Mean 0.85
  • 80.
    Table 5.11(e)-Rating ofhelps in branding or differentiation factor (N=40) Rating No. of respondents Product Most influencing (+2) 1 2 More influencing (+1) 12 12 Neutral (0) 9 0 Less influencing (-1) 13 -13 Least influencing (-2) 5 -10 Total 40 -9 Mean 0.225
  • 81.
    Table 5.11(f)-Rating ofglobal demand factor (N=40) Rating No. of respondents Product Most influencing (+2) 19 38 More influencing (+1) 10 10 Neutral (0) 7 0 Less influencing (-1) 3 -3 Least influencing (-2) 1 -2 Total 40 43 Mean 1.075
  • 82.
    Combined result offactors influencing people to enter into organic cotton textile products business Fig 5.12-Factors influencing people to enter into organic cotton textile products business
  • 83.
    Table 5.13-Steps thatgovernment should take to boost the sales of organic cotton textile products in the global textile market (N=40) Steps Regulate prices Favourable global policies Create awareness of eco-friendly products Encourage farming of organic cotton Incentives to farmers to grow organic cotton Others No of responses 24 7 17 9 6 1 No of respondents 40 40 40 40 40 40 Percentage 60% 17.5% 42.5% 22.5% 15% 2.5%
  • 84.
    Findings There are30% knitted & 15% woven organic cotton yarn manufacturers & exporters, 40% knitted & 10% woven fabric manufacturers & exporters & 47.5% knitted & 10% woven garments manufacturers & exporters in Ludhiana out of 40 respondents. Maximum no. of respondents exporting organic cotton textile products are having annual turnover above 40crores. The maximum no of respondents export less percentage of organic cotton textile products of their total sales where as only few respondents are exporting 30% to 40% & above 40% organic cotton textile products of their total sales.
  • 85.
    An increasing demandof organic cotton textile product in the overseas market has resulted in an increase in the exports of organic cotton textile products. High prices & availability of substitutes are the most important factors which have resulted in constant & decreasing exports of their organic cotton textile products. All the respondents have valid operational certificate for the production & trading of organic cotton textile products. Maximum no of respondents dealing in organic cotton textile products hold both GOTS & OE certificates & there are 35% of total respondents who holds only GOTS certificate & 2.5% of total respondents hold only OE certificate.
  • 86.
    Price is themost important factor which is most considered at the time of purchase of raw material for organic cotton textile products. Global demand, competition & increasing basket size has more influenced the respondents to enter into organic cotton textile products business. Government should more regulate prices of organic cotton textile products, create awareness of eco-friendly products, encourage farming of organic cotton & make favourable policies so as to boost the sales of organic cotton textile products in the global textile market.
  • 87.
  • 88.
    Conclusion Demand fororganic cotton textile products is increasing in the global textile market because it is of better quality & skin friendly. Very less percentage of organic cotton textile products are exported from Ludhiana. High prices & availability of substitutes can lead to decrease in the demand of organic cotton textile products. All the manufacturers & exporters hold valid operational certificate for manufacturing & trading organic cotton textile products.
  • 89.
    Price, payment terms& quality factors are more considered at the time of procurement of raw material for organic cotton textile products. Increasing global demand, high profit margin & increasing competition are attracting more people to enter into organic cotton textile products business. There is less government support in promoting export of organic cotton textile products from Ludhiana.
  • 90.
    Suggestions and RecommendationsAwareness should be created among the consumer towards environment friendly & skin friendly products. The manufacturers & exporters of organic cotton textile products should be more cautious while purchasing raw material & should consider lead time. The manufacturers & exporters of organic cotton textile products should try to maintain strong relationship with the supplier so that their own supply should not get affected.
  • 91.
    Government should regulatethe prices of organic cotton textile products because products of organic cotton are more costly than its substitutes. Government should provide incentives to the farmers to encourage organic farming. There is more scope of export of organic cotton textile products in U.S. & European markets.
  • 92.