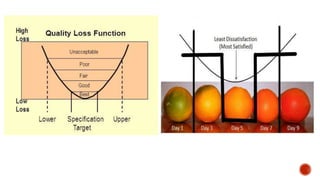
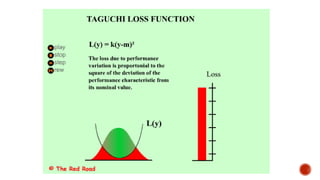
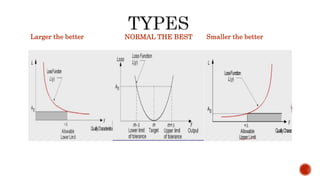
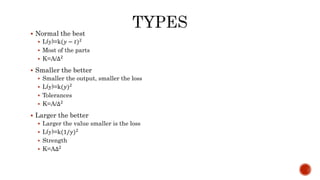
By
N. Sesha Sai
Baba
9916009256
 Loss refers to reduction in quality, productivity and performance of the product
 Loss can be related to
 Customer dissatisfaction,
 Loss of market,
 Increase in stock,
 Performance drop
 The Taguchi loss function is graphical depiction of loss
 It is a graphical representation of how an increase in variation within specification
limits leads to an exponential increase in customer dissatisfaction
 Quality loss function is a method of measuring losses that are incurred due to
imperfections.
 It depends on the type of quality characteristics.
 It is a revolutionary approach to product quality assurance.
 Two types of factors interact with the functional characteristics of
the product
 Controllable, which can be easily inspected and maintained,
 Interference, which control is difficult and often impossible.
 External,
 e.g.: resulting from the impact of weather conditions and environment,
 Internal
 e.g.: ageing of equipment, tolerances due to deterioration, between products
noise that is caused by imperfections in manufacturing processes
 Cause deviations between individual copies of the product
 These are responsible for deviation of functional characteristics from
the desired value.
 The measurement of these factors is expensive and often even impossible,
 So, in the Taguchi method we don't try to identify them, and then control,
 Rather select such values of controllable factors that minimize product and
process sensitivity to changes in interfering factors.
 Instead of seeking out and eliminating the causes, we try to reduce the impact of
these causes.
 This type of procedure allows to create a product resistant to interference.
 It reduces the product development time and processing time thereby improves
productivity.
 It helps in improving the quality of the product by relieving it from interference
factors to a great extent.
 Parameters design is a key step in the Taguchi method
 Selection of parameters that can best satisfy the condition of
improving quality without a relative increase in costs.
 Activities related to the design of the system include:
 selection of materials and components,
 selection of test parameters of the product,
 choice of production equipment
 Design parameters include pre-trial testing of fixed nominal values
followed by determining the best combination of performance levels
of products so that they are most resistant to changes in
the external environment and to other confounding factors.
 Tolerance design is used in cases where the elimination of deviations
achieved during the design parameters is unsatisfactory.
 This design determines the exact tolerances for these indicators of a
product or process whose deviation from the nominal value exert a strong
influence on the final product.
 But still loss is a value that progressively increases as variation
increases from the intended condition
 The loss generated by one unit is calculated using the formula
L(y)=k(𝑦 − 𝑡)2
k=c/𝑑2
L(y) - the loss in currency
k – Quality Loss Coefficient
y - actual value of quality characteristic,
T - target value of quality characteristic,
c - loss associated with the specification limit,
d - deviation of the specification from the target value.
 In Taguchi's view tolerance specifications are given by engineers and not by
customers
 what the customer experiences is loss
 If loss is to be calculated for multiple products the loss function is given by
L(y)=k(( 𝑦 − 𝑡)2+𝑆2)
 where 𝑆2 is the variance of product size and 𝑦is the average product size.
 The reason for making use of parabolic curve is it has the least possibility of
failures and it has more probability of getting products which are good
 The interpretation of Taguchi Quality Loss Function is shown in figure below
 It can be expressed as follows
NORMAL THE BESTLarger the better Smaller the better
 Normal the best
 L(y)=k(𝑦 − 𝑡)2
 Most of the parts
 K=A/∆2
 Smaller the better
 Smaller the output, smaller the loss
 L(y)=k(𝑦)2
 Tolerances
 K=A/∆2
 Larger the better
 Larger the value smaller is the loss
 L(y)=k(1/𝑦)2
 Strength
 K=A∆2
 The asymmetric quality loss function implies that variations can have different
impact on loss level.
 If that happens, one side of the function will be different from another side
(asymmetry).
 To establish loss of asymmetric function it is necessary to calculate each side's loss
and then add them to get the result.
 Ex: Pressure in Tires; where under pressure leads to gradual bursting(wear) but high
pressure leads to sudden bursting

Taguchi loss function

  • 1.
  • 2.
     Loss refersto reduction in quality, productivity and performance of the product  Loss can be related to  Customer dissatisfaction,  Loss of market,  Increase in stock,  Performance drop  The Taguchi loss function is graphical depiction of loss  It is a graphical representation of how an increase in variation within specification limits leads to an exponential increase in customer dissatisfaction  Quality loss function is a method of measuring losses that are incurred due to imperfections.  It depends on the type of quality characteristics.  It is a revolutionary approach to product quality assurance.
  • 3.
     Two typesof factors interact with the functional characteristics of the product  Controllable, which can be easily inspected and maintained,  Interference, which control is difficult and often impossible.  External,  e.g.: resulting from the impact of weather conditions and environment,  Internal  e.g.: ageing of equipment, tolerances due to deterioration, between products noise that is caused by imperfections in manufacturing processes  Cause deviations between individual copies of the product  These are responsible for deviation of functional characteristics from the desired value.
  • 4.
     The measurementof these factors is expensive and often even impossible,  So, in the Taguchi method we don't try to identify them, and then control,  Rather select such values of controllable factors that minimize product and process sensitivity to changes in interfering factors.  Instead of seeking out and eliminating the causes, we try to reduce the impact of these causes.  This type of procedure allows to create a product resistant to interference.  It reduces the product development time and processing time thereby improves productivity.  It helps in improving the quality of the product by relieving it from interference factors to a great extent.
  • 5.
     Parameters designis a key step in the Taguchi method  Selection of parameters that can best satisfy the condition of improving quality without a relative increase in costs.  Activities related to the design of the system include:  selection of materials and components,  selection of test parameters of the product,  choice of production equipment  Design parameters include pre-trial testing of fixed nominal values followed by determining the best combination of performance levels of products so that they are most resistant to changes in the external environment and to other confounding factors.
  • 6.
     Tolerance designis used in cases where the elimination of deviations achieved during the design parameters is unsatisfactory.  This design determines the exact tolerances for these indicators of a product or process whose deviation from the nominal value exert a strong influence on the final product.  But still loss is a value that progressively increases as variation increases from the intended condition  The loss generated by one unit is calculated using the formula L(y)=k(𝑦 − 𝑡)2 k=c/𝑑2 L(y) - the loss in currency k – Quality Loss Coefficient y - actual value of quality characteristic, T - target value of quality characteristic, c - loss associated with the specification limit, d - deviation of the specification from the target value.
  • 7.
     In Taguchi'sview tolerance specifications are given by engineers and not by customers  what the customer experiences is loss  If loss is to be calculated for multiple products the loss function is given by L(y)=k(( 𝑦 − 𝑡)2+𝑆2)  where 𝑆2 is the variance of product size and 𝑦is the average product size.  The reason for making use of parabolic curve is it has the least possibility of failures and it has more probability of getting products which are good  The interpretation of Taguchi Quality Loss Function is shown in figure below  It can be expressed as follows
  • 10.
    NORMAL THE BESTLargerthe better Smaller the better
  • 11.
     Normal thebest  L(y)=k(𝑦 − 𝑡)2  Most of the parts  K=A/∆2  Smaller the better  Smaller the output, smaller the loss  L(y)=k(𝑦)2  Tolerances  K=A/∆2  Larger the better  Larger the value smaller is the loss  L(y)=k(1/𝑦)2  Strength  K=A∆2
  • 12.
     The asymmetricquality loss function implies that variations can have different impact on loss level.  If that happens, one side of the function will be different from another side (asymmetry).  To establish loss of asymmetric function it is necessary to calculate each side's loss and then add them to get the result.  Ex: Pressure in Tires; where under pressure leads to gradual bursting(wear) but high pressure leads to sudden bursting