Lecture Outline
Lecture Outline
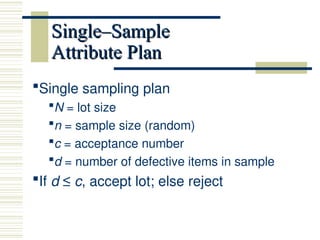
Single-Sample Attribute Plan
Single-Sample Attribute Plan
Operating Characteristic Curve
Operating Characteristic Curve
Developing a Sampling Plan with Excel
Developing a Sampling Plan with Excel
Average Outgoing Quality
Average Outgoing Quality
Double - and Multiple-Sampling Plans
Double - and Multiple-Sampling Plans
3.
Acceptance Sampling
Acceptance Sampling
Accepting or rejecting a production
Accepting or rejecting a production
lot based on the number of defects
lot based on the number of defects
in a sample
in a sample
Not consistent with TQM or Zero
Not consistent with TQM or Zero
Defects philosophy
Defects philosophy
producer and customer agree on the
producer and customer agree on the
number of acceptable defects
number of acceptable defects
a means of identifying not preventing
a means of identifying not preventing
poor quality
poor quality
percent of defective parts versus PPM
percent of defective parts versus PPM
Producer’s and
Producer’s and
Consumer’sRisk
Consumer’s Risk
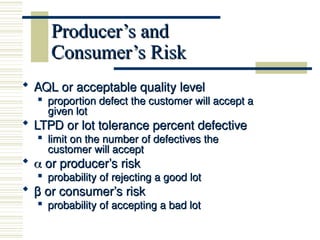
AQL or acceptable quality level
AQL or acceptable quality level
proportion defect the customer will accept a
proportion defect the customer will accept a
given lot
given lot
LTPD or lot tolerance percent defective
LTPD or lot tolerance percent defective
limit on the number of defectives the
limit on the number of defectives the
customer will accept
customer will accept
or producer’s risk
or producer’s risk
probability of rejecting a good lot
probability of rejecting a good lot
β
β or consumer’s risk
or consumer’s risk
probability of accepting a bad lot
probability of accepting a bad lot
6.
Producer’s and
Producer’s and
Consumer’sRisk (cont.)
Consumer’s Risk (cont.)
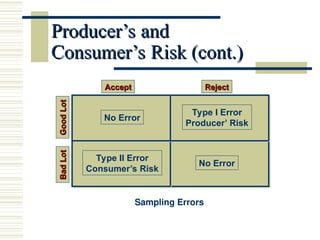
Sampling Errors
Good
Lot
Good
Lot
Bad
Lot
Bad
Lot
Accept
Accept Reject
Reject
No Error
Type I Error
Producer’ Risk
Type II Error
Consumer’s Risk
No Error
7.
Operating Characteristic
Operating Characteristic
(OC)Curve
(OC) Curve
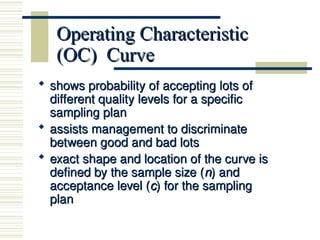
shows probability of accepting lots of
shows probability of accepting lots of
different quality levels for a specific
different quality levels for a specific
sampling plan
sampling plan
assists management to discriminate
assists management to discriminate
between good and bad lots
between good and bad lots
exact shape and location of the curve is
exact shape and location of the curve is
defined by the sample size (
defined by the sample size (n
n) and
) and
acceptance level (
acceptance level (c
c) for the sampling
) for the sampling
plan
plan
8.
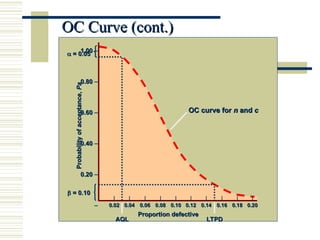
OC Curve (cont.)
OCCurve (cont.)
OC curve for
OC curve for n
n and
and c
c
Proportion defective
Proportion defective
AQL
AQL LTPD
LTPD
Probability
of
acceptance,
Probability
of
acceptance,
Pa
Pa
= 0.10
= 0.10
= 0.05
= 0.05
1.00
1.00 –
0.80
0.80 –
0.60
0.60 –
0.40
0.40 –
0.20
0.20 –
–
|
0.02
0.02
|
0.04
0.04
|
0.06
0.06
|
0.08
0.08
|
0.10
0.10
|
0.12
0.12
|
0.14
0.14
|
0.16
0.16
|
0.18
0.18
|
0.20
0.20
9.
Developing a SamplingPlan
Developing a Sampling Plan
with Excel
with Excel
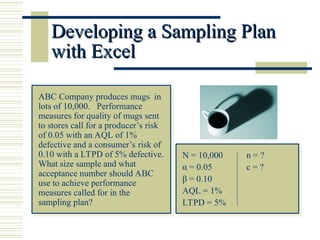
ABC Company produces mugs in
lots of 10,000. Performance
measures for quality of mugs sent
to stores call for a producer’s risk
of 0.05 with an AQL of 1%
defective and a consumer’s risk of
0.10 with a LTPD of 5% defective.
What size sample and what
acceptance number should ABC
use to achieve performance
measures called for in the
sampling plan?
N = 10,000 n = ?
α = 0.05 c = ?
β = 0.10
AQL = 1%
LTPD = 5%
10.
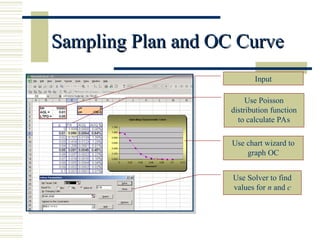
Sampling Plan andOC Curve
Sampling Plan and OC Curve
Input
Use Poisson
distribution function
to calculate PAs
Use chart wizard to
graph OC
Use Solver to find
values for n and c
11.
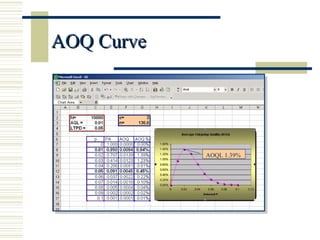
Average Outgoing
Average Outgoing
Quality(AOQ)
Quality (AOQ)
Expected number of defective
Expected number of defective
items that will pass on to
items that will pass on to
customer with a sampling plan
customer with a sampling plan
Average outgoing quality limit
Average outgoing quality limit
(AOQL)
(AOQL)
maximum point on the curve
maximum point on the curve
worst level of outgoing quality
worst level of outgoing quality
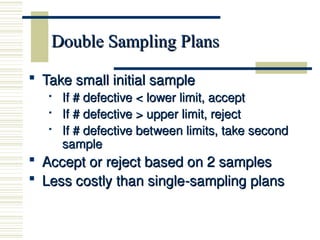
Double Sampling Plans
DoubleSampling Plans
Take small initial sample
Take small initial sample
If # defective < lower limit, accept
If # defective < lower limit, accept
If # defective > upper limit, reject
If # defective > upper limit, reject
If # defective between limits, take second
If # defective between limits, take second
sample
sample
Accept or reject based on 2 samples
Accept or reject based on 2 samples
Less costly than single-sampling plans
Less costly than single-sampling plans
14.
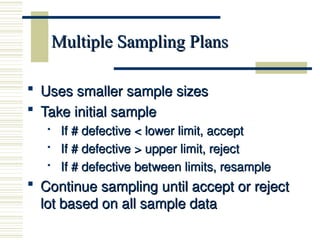
Multiple Sampling Plans
MultipleSampling Plans
Uses smaller sample sizes
Uses smaller sample sizes
Take initial sample
Take initial sample
If # defective < lower limit, accept
If # defective < lower limit, accept
If # defective > upper limit, reject
If # defective > upper limit, reject
If # defective between limits, resample
If # defective between limits, resample
Continue sampling until accept or reject
Continue sampling until accept or reject
lot based on all sample data
lot based on all sample data


![AcceptanceSampling for students uni[1].ppt](https://cdn.slidesharecdn.com/ss_thumbnails/acceptancesampling1-250204230443-7d8ea06b-thumbnail.jpg?width=640&height=640&fit=bounds)


![Acceptance Sampling[1]](https://cdn.slidesharecdn.com/ss_thumbnails/acceptancesampling1-1226960943251212-8-thumbnail.jpg?width=640&height=640&fit=bounds)
![Acceptance Sampling[1]](https://cdn.slidesharecdn.com/ss_thumbnails/acceptancesampling1-1226078569232381-9-thumbnail.jpg?width=640&height=640&fit=bounds)


