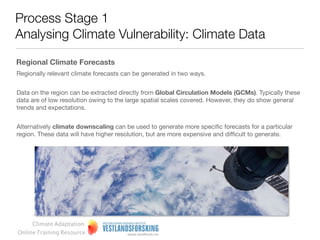
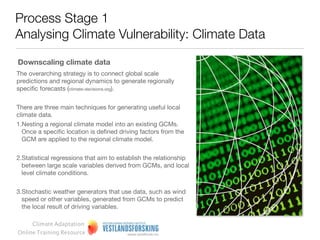
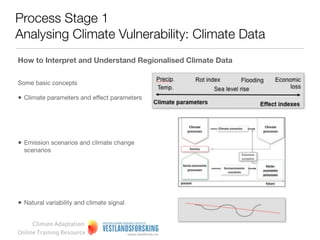
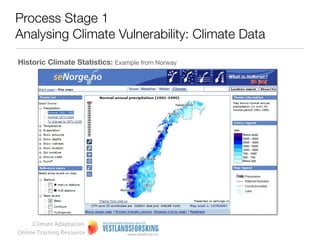
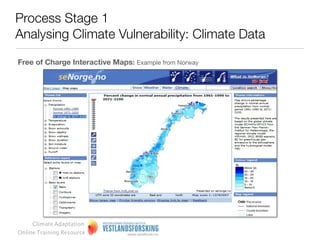
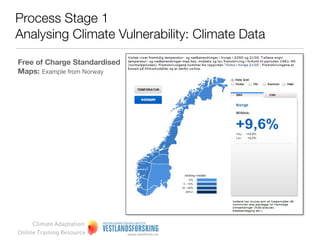
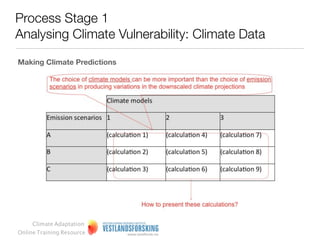
Online Training Resource:      Climate Adaptation

Analysing Climate Vulnerability
Process Stage 1
Analysing Climate Vulnerability: Climate Data


Interpreting Climate Data

This module provides an introduction to climate data and how to effectively use it. The following will be
covered:
• How regionalised climate data is produced
• How to understand and interpret regionalised climate data
• How to identify and communicate uncertainties
      Climate Adaptation
 Online Training Resource
Process Stage 1
Analysing Climate Vulnerability: Climate Data

What is climate data?
To understand climate change and the need to adapt it is important to recognise the difference
between weather and climate (MET Office, UK).


Weather is the temperature, precipitation (rain, hail, sleet and snow) and wind, which change hour by
hour and day by day. When you want to know the weather, time and place are critical - you are
interested in what is going to happen in the immediate future.


Climate data is different; the focus is on spatially and temporally averaged conditions. Climate data is
commonly defined as the weather averaged over a long period of time, however, it can also include
the magnitudes of day-to-day or year-to-year variations. To illustrate this the UK Met Office points out
that while the weather brings different temperatures all over the world on a day to day basis, over a
year we'd expect the global climate to bring an average temperature of about 14 °C.
                                                               http://www.metoffice.gov.uk/climate-change/guide/climate


The difference between climate and weather is usefully summarised by the popular phrase
                                              “Climate is what you expect, weather is what you get.”


     Climate Adaptation
Online Training Resource
Process Stage 1
Analysing Climate Vulnerability: Climate Data

What is climate change?
Climate change refers to a multi-decadal or longer shifts, in
one or more physical, chemical and/or biological
components of the climate system.


It can be statistically measured as a change in some or all of
the features associated with weather, such as temperature,
wind, and precipitation, plus it can involve changes in
average conditions (e.g. mean daily temperature) and the
variability of the weather.


It can also be qualitatively observed and recorded in oral
histories.


Climate change includes persistent changes in fauna and
flora, snow cover, etc., and may occur in a specific region,
or across the whole world.


     Climate Adaptation
Online Training Resource
Process Stage 1
Analysing Climate Vulnerability: Climate Data
Terminology                                                 Definition
Weather               Describes atmospheric conditions at a particular place in terms of air temperature,
                      pressure, humidity, wind speed, and precipitation


Climate               Is often defined as the weather averaged over time (typically, 30 years).


Climate Variability   Refers to variations in the mean state of climate on all temporal and spatial scales
                      beyond that of individual weather events. Examples of climate variability include
                      extended droughts, floods, and conditions that result from periodic El Niño and La
                      Niña events.

Climate Change        Refers to shifts in the mean state of the climate or in its variability, persisting for an
                      extended period (decades or longer). Climate change may be due to natural changes
                      or to persistent anthropogenic changes in the composition of the atmosphere or in
                      land use.

Global Warming        Global warming involves the accumulation of heat in Joules within the climate
                      system, predominantly the oceans.

                                                  Definitions based on IPCC Climate Change 2001 and 2007
                                                               Impacts, Adaptation and Vulnerability reports
     Climate Adaptation
Online Training Resource
Process Stage 1
Analysing Climate Vulnerability: Climate Data

Regional climate forecasts
Regionally relevant climate forecasts can be generated in two ways.


Data on the region can be extracted directly from Global Circulation Models (GCMs). Typically these
data are of low resolution owing to the large spatial scales covered. However, they do show general
trends and expectations.


Alternatively climate downscaling can be used to generate more specific forecasts for a particular
region. These data will have higher resolution, but are more expensive and difficult to generate.


     Climate Adaptation
Online Training Resource
Process Stage 1
Analysing Climate Vulnerability: Climate Data

Downscaling climate data
The overarching strategy is to connect global scale
predictions and regional dynamics to generate regionally
specific forecasts (climate-decisions.org).


There are three main techniques for generating useful local
climate data.
1.Nesting a regional climate model into an existing GCMs.
  Once a specific location is defined driving factors from the
  GCM are applied to the regional climate model.


2.Statistical regressions that aim to establish the relationship
  between large scale variables derived from GCMs, and local
  level climate conditions.


3.Stochastic weather generators that use data, such as wind
  speed or other variables, generated from GCMs to predict
  the local result of driving variables.

     Climate Adaptation
Online Training Resource
Process Stage 1
Analysing Climate Vulnerability: Climate Data

How regionalised climate data is produced

Examples from Norway:

• Historic climate statistics – www.senorge.no (interactive
  maps and statistics) – Local date in some cases – Can be
  ordered from met.no, Bjerknessenteret or Storm Weather
  Centre

• Standardised and free-of charge downscaled climate
  change projections
  – www.senorge.no (interactive maps)
  – www.klimatilpasning.no (ready made maps)

• Customised (and not free-of charge!) downscaled
  climate change projections
  – Can be ordered from met.no, Bjerknessenteret or Storm
  Weather Centre


     Climate Adaptation
Online Training Resource
Process Stage 1
Analysing Climate Vulnerability: Climate Data
How to interpret and understand regionalised climate data

Some basic concepts

• Climate parameters and effect parameters


• Emission scenarios and climate change
  scenarios


• Natural variability and climate signal

     Climate Adaptation
Online Training Resource
Process Stage 1
Analysing Climate Vulnerability: Climate Data

Historic climate statistics: Example from Norway


     Climate Adaptation
Online Training Resource
Process Stage 1
Analysing Climate Vulnerability: Climate Data

Free of charge interactive maps: Example from Norway


     Climate Adaptation
Online Training Resource
Process Stage 1
Analysing Climate Vulnerability: Climate Data

Free of charge standardised
maps: Example from Norway


     Climate Adaptation
Online Training Resource
Process Stage 1
Analysing Climate Vulnerability: Climate Data

Creating regional scenarios
Two factors are particularly important in shaping regional
climate forecasts:
1. The GCM used to generate the forecast; and
2. Assumptions about greenhouse gas (GHG) emission
generation over time.

When combined, these two factors create a wide range
of possible results for the variables being examined.


It should be noted thought that developing regionally
downscaled climate predictions is more difficult than
accessing regionally relevant GCM data.


     Climate Adaptation
Online Training Resource
Process Stage 1
Analysing Climate Vulnerability: Climate Data

Making climate predictions


     Climate Adaptation
Online Training Resource
Process Stage 1
Analysing Climate Vulnerability: Climate Data

Sample climate predictions: Example from Norway


                                                  http://www.vestforsk.no/filearchive/r-ks-
                                                           klimaanalysen-del2.pdf
     Climate Adaptation
Online Training Resource
Process Stage 1
 Analysing Climate Vulnerability: Climate Data

  Sample climate predictions: Example from Norway


                                 Presenting the mean value (and
                                                                           Presenting the whole range of equally
Presenting only the mean value   highlighting this), but also presenting
                                                                           likely values of projections
                                 upper and lower values

                                           www.klimatilpasning.no            http://www.vestforsk.no/filearchive/r-ks-
                                                                                      klimaanalysen-del2.pdf
       Climate Adaptation
  Online Training Resource
Process Stage 1
 Analysing Climate Vulnerability: Climate Data

  Sample climate predictions: Example from Norway


                                 Presenting the mean value (and
                                                                           Presenting the whole range of equally
Presenting only the mean value   highlighting this), but also presenting
                                                                           likely values of projections
                                 upper and lower values
            www.senorge.no                 www.klimatilpasning.no            http://www.vestforsk.no/filearchive/r-ks-
                                                                                      klimaanalysen-del2.pdf
       Climate Adaptation
  Online Training Resource
Process Stage 1
Analysing Climate Vulnerability: Climate Data

Variability v mean values

Often, downscaled climate projections are presented as the
mean value of different climate models.

This average is for instance used by the Norwegian web
portal senorge.no, which presents projections of climate
parameters such as snow duration and temperature for the
time period 2071-2100.

The average is often wrongly interpreted as ‘the most likely
projection’.

This is, however, not entirely true. It is important to include
the entire range of values – also extreme values at either end
– as they all in principle constitute equally likely projections.


     Climate Adaptation
Online Training Resource
Process Stage 1
Analysing Climate Vulnerability: Climate Data

Climate scenarios as tools for policy makers

Scenarios are an invaluable tool for managers or strategists who want to think through the future
dimension of decisions and actions. Using scenarios to explore and rehearse future possibilities
should highlight a number of issues or potential options that require further detailed investigation or
analysis.

Scenarios are most commonly used in a strategic context for the following reasons:

• To help define future vision and strategic priorities
• To rehearse different policy or strategy options to highlight potential strengths and weaknesses, or
  unintended consequences

• To future-proof a decision that is ‘on the table’


     Climate Adaptation
Online Training Resource
Process Stage 1
Analysing Climate Vulnerability: Climate Data
Interpreting climate data: time frames and climate scenarios


Climate change implies a longer time frame (50-100 years) than
what is common in, and relevant for, local policy-making (4-10
years).

This feature of climate policy obviously constitutes a challenge.
Scenarios may be useful tools for policy-makers.

We use the terms past, present, and future climate to refer to the
various time frames:


     Climate Adaptation
Online Training Resource
Process Stage 1
Analysing Climate Vulnerability: Climate Data
Interpreting climate data: time frames and climate scenarios

Past climate:

Climate statistics are actually showing us the climate of the past.
In planning new water and sanitation pipes, we often look at this
kind of data.

However, such data can be also be used to look at vulnerability
aspects associated with existing natural climate variability e.g.
very mild winters some years, very hard winters other years
(particularly apparent in the UK).


     Climate Adaptation
Online Training Resource
Process Stage 1
Analysing Climate Vulnerability: Climate Data
Interpreting climate data: time frames and climate scenarios

Present climate:

Several effects of climate change can already be observed.
Although natural variability accounts for some of the deviations
from the past climate, such effects provide a signal as to what is
underway.

Thus, we should be adapting in ways different from those related
to past climate.


     Climate Adaptation
Online Training Resource
Process Stage 1
Analysing Climate Vulnerability: Climate Data
Interpreting climate data: time frames and climate scenarios

Future climate:

The climate of the future can to some extent be estimated on the
basis of emission scenarios.

Adaptation to climate change (i.e. future climate) is what climate
change adaptation is really about, although many fail to
distinguish between past, present, and future climate both
verbally and in practice.

For example, upgrading a flood-prone road to present
precipitation levels rather than to the precipitation levels
expected in 20 years, constitutes an example of climate
adaptation, but not climate change adaptation.


     Climate Adaptation
Online Training Resource
Process Stage 1
Analysing Climate Vulnerability: Climate Data
Climate scenarios for exploring future possibilities

Scenarios represent a framework for thinking about the future
based on a robust evidence base and set of diverse viewpoints
about what might or could happen in the future.

They are not factual accounts of what is happening today or
forecasts of what will happen in the future.

They are a combination of analysis and judgment about future
possibilities. It is therefore useful to be aware that using
scenarios can represent a challenge, albeit a stimulating one, to
‘traditional’ modes of thinking and ways of working.


     Climate Adaptation
Online Training Resource
Process Stage 1
Analysing Climate Vulnerability: Climate Data

Final key points:

Developing regional scenarios and creating influence diagrams that correlate these scenarios to
regional systems can help make climate data more useful for decision making
However, often, we fail to reflect sufficiently on the notion of change.

Natural variability in the short run vs. climate change in the long run

The term ‘climate’ encompasses statistics of a number of meteorological elements in a given region
over long periods of time. It is important to note that while natural variability can certainly account for
variability in the short run, short-term deviations from the norm are inherently different from long-term
changes in climate. As an example, natural variability can easily explain a couple of summer heat
records within a decade, but several decades of unusually high summer heat records is more likely to
imply long-term climate change.

Depending on the scope of the vulnerability assessment, and the local conditions, you need different
climate data input.

More detailed climate data does not, however, reduce the uncertainties.


     Climate Adaptation
Online Training Resource
Process Stage 1
Analysing Climate Vulnerability: Climate Data

Final key points:

Identify and Communicate Uncertainties

On the one hand, it is important to be clear about the great uncertainty associated with climate
change adaptation

At the same time, it is vital to avoid a state of non-action based on the assumption that
‘everything’ is uncertain

A possible solution to this dilemma is to try and differentiate our understanding of uncertainty


     Climate Adaptation
Online Training Resource
Process Stage 1
Analysing Climate Vulnerability: Climate Data

Final key points:

 ‘Climate modelling is inherently uncertain, but this does not mean that forecasts do not have value.
   One way to make decisions despite this uncertainty is to consider the range of possible climate
  outcomes instead of relying on single forecasts. Because each GCM incorporates slightly different
  assumptions about how the climate works, each generates different results. Decision makers can
   make more resilient decisions by incorporating a range of these results in their considerations.’

                                                         climate-decisions.org
                                                         http://www.climate-decisions.org/2_Climate%20Forecasts.htm


     Climate Adaptation
Online Training Resource

Online Training Resource for Climate Adaptation: Analysing Climate Vulnerability - Interpreting Climate Data

  • 1.
    Online Training Resource: Climate Adaptation Analysing Climate Vulnerability
  • 2.
    Process Stage 1 AnalysingClimate Vulnerability: Climate Data Interpreting Climate Data This module provides an introduction to climate data and how to effectively use it. The following will be covered: • How regionalised climate data is produced • How to understand and interpret regionalised climate data • How to identify and communicate uncertainties Climate Adaptation Online Training Resource
  • 3.
    Process Stage 1 AnalysingClimate Vulnerability: Climate Data What is climate data? To understand climate change and the need to adapt it is important to recognise the difference between weather and climate (MET Office, UK). Weather is the temperature, precipitation (rain, hail, sleet and snow) and wind, which change hour by hour and day by day. When you want to know the weather, time and place are critical - you are interested in what is going to happen in the immediate future. Climate data is different; the focus is on spatially and temporally averaged conditions. Climate data is commonly defined as the weather averaged over a long period of time, however, it can also include the magnitudes of day-to-day or year-to-year variations. To illustrate this the UK Met Office points out that while the weather brings different temperatures all over the world on a day to day basis, over a year we'd expect the global climate to bring an average temperature of about 14 °C. http://www.metoffice.gov.uk/climate-change/guide/climate The difference between climate and weather is usefully summarised by the popular phrase “Climate is what you expect, weather is what you get.” Climate Adaptation Online Training Resource
  • 4.
    Process Stage 1 AnalysingClimate Vulnerability: Climate Data What is climate change? Climate change refers to a multi-decadal or longer shifts, in one or more physical, chemical and/or biological components of the climate system. It can be statistically measured as a change in some or all of the features associated with weather, such as temperature, wind, and precipitation, plus it can involve changes in average conditions (e.g. mean daily temperature) and the variability of the weather. It can also be qualitatively observed and recorded in oral histories. Climate change includes persistent changes in fauna and flora, snow cover, etc., and may occur in a specific region, or across the whole world. Climate Adaptation Online Training Resource
  • 5.
    Process Stage 1 AnalysingClimate Vulnerability: Climate Data Terminology Definition Weather Describes atmospheric conditions at a particular place in terms of air temperature, pressure, humidity, wind speed, and precipitation Climate Is often defined as the weather averaged over time (typically, 30 years). Climate Variability Refers to variations in the mean state of climate on all temporal and spatial scales beyond that of individual weather events. Examples of climate variability include extended droughts, floods, and conditions that result from periodic El Niño and La Niña events. Climate Change Refers to shifts in the mean state of the climate or in its variability, persisting for an extended period (decades or longer). Climate change may be due to natural changes or to persistent anthropogenic changes in the composition of the atmosphere or in land use. Global Warming Global warming involves the accumulation of heat in Joules within the climate system, predominantly the oceans. Definitions based on IPCC Climate Change 2001 and 2007 Impacts, Adaptation and Vulnerability reports Climate Adaptation Online Training Resource
  • 6.
    Process Stage 1 AnalysingClimate Vulnerability: Climate Data Regional climate forecasts Regionally relevant climate forecasts can be generated in two ways. Data on the region can be extracted directly from Global Circulation Models (GCMs). Typically these data are of low resolution owing to the large spatial scales covered. However, they do show general trends and expectations. Alternatively climate downscaling can be used to generate more specific forecasts for a particular region. These data will have higher resolution, but are more expensive and difficult to generate. Climate Adaptation Online Training Resource
  • 7.
    Process Stage 1 AnalysingClimate Vulnerability: Climate Data Downscaling climate data The overarching strategy is to connect global scale predictions and regional dynamics to generate regionally specific forecasts (climate-decisions.org). There are three main techniques for generating useful local climate data. 1.Nesting a regional climate model into an existing GCMs. Once a specific location is defined driving factors from the GCM are applied to the regional climate model. 2.Statistical regressions that aim to establish the relationship between large scale variables derived from GCMs, and local level climate conditions. 3.Stochastic weather generators that use data, such as wind speed or other variables, generated from GCMs to predict the local result of driving variables. Climate Adaptation Online Training Resource
  • 8.
    Process Stage 1 AnalysingClimate Vulnerability: Climate Data How regionalised climate data is produced Examples from Norway: • Historic climate statistics – www.senorge.no (interactive maps and statistics) – Local date in some cases – Can be ordered from met.no, Bjerknessenteret or Storm Weather Centre • Standardised and free-of charge downscaled climate change projections – www.senorge.no (interactive maps) – www.klimatilpasning.no (ready made maps) • Customised (and not free-of charge!) downscaled climate change projections – Can be ordered from met.no, Bjerknessenteret or Storm Weather Centre Climate Adaptation Online Training Resource
  • 9.
    Process Stage 1 AnalysingClimate Vulnerability: Climate Data How to interpret and understand regionalised climate data Some basic concepts • Climate parameters and effect parameters • Emission scenarios and climate change scenarios • Natural variability and climate signal Climate Adaptation Online Training Resource
  • 10.
    Process Stage 1 AnalysingClimate Vulnerability: Climate Data Historic climate statistics: Example from Norway Climate Adaptation Online Training Resource
  • 11.
    Process Stage 1 AnalysingClimate Vulnerability: Climate Data Free of charge interactive maps: Example from Norway Climate Adaptation Online Training Resource
  • 12.
    Process Stage 1 AnalysingClimate Vulnerability: Climate Data Free of charge standardised maps: Example from Norway Climate Adaptation Online Training Resource
  • 13.
    Process Stage 1 AnalysingClimate Vulnerability: Climate Data Creating regional scenarios Two factors are particularly important in shaping regional climate forecasts: 1. The GCM used to generate the forecast; and 2. Assumptions about greenhouse gas (GHG) emission generation over time. When combined, these two factors create a wide range of possible results for the variables being examined. It should be noted thought that developing regionally downscaled climate predictions is more difficult than accessing regionally relevant GCM data. Climate Adaptation Online Training Resource
  • 14.
    Process Stage 1 AnalysingClimate Vulnerability: Climate Data Making climate predictions Climate Adaptation Online Training Resource
  • 15.
    Process Stage 1 AnalysingClimate Vulnerability: Climate Data Sample climate predictions: Example from Norway http://www.vestforsk.no/filearchive/r-ks- klimaanalysen-del2.pdf Climate Adaptation Online Training Resource
  • 16.
    Process Stage 1 Analysing Climate Vulnerability: Climate Data Sample climate predictions: Example from Norway Presenting the mean value (and Presenting the whole range of equally Presenting only the mean value highlighting this), but also presenting likely values of projections upper and lower values www.klimatilpasning.no http://www.vestforsk.no/filearchive/r-ks- klimaanalysen-del2.pdf Climate Adaptation Online Training Resource
  • 17.
    Process Stage 1 Analysing Climate Vulnerability: Climate Data Sample climate predictions: Example from Norway Presenting the mean value (and Presenting the whole range of equally Presenting only the mean value highlighting this), but also presenting likely values of projections upper and lower values www.senorge.no www.klimatilpasning.no http://www.vestforsk.no/filearchive/r-ks- klimaanalysen-del2.pdf Climate Adaptation Online Training Resource
  • 18.
    Process Stage 1 AnalysingClimate Vulnerability: Climate Data Variability v mean values Often, downscaled climate projections are presented as the mean value of different climate models. This average is for instance used by the Norwegian web portal senorge.no, which presents projections of climate parameters such as snow duration and temperature for the time period 2071-2100. The average is often wrongly interpreted as ‘the most likely projection’. This is, however, not entirely true. It is important to include the entire range of values – also extreme values at either end – as they all in principle constitute equally likely projections. Climate Adaptation Online Training Resource
  • 19.
    Process Stage 1 AnalysingClimate Vulnerability: Climate Data Climate scenarios as tools for policy makers Scenarios are an invaluable tool for managers or strategists who want to think through the future dimension of decisions and actions. Using scenarios to explore and rehearse future possibilities should highlight a number of issues or potential options that require further detailed investigation or analysis. Scenarios are most commonly used in a strategic context for the following reasons: • To help define future vision and strategic priorities • To rehearse different policy or strategy options to highlight potential strengths and weaknesses, or unintended consequences • To future-proof a decision that is ‘on the table’ Climate Adaptation Online Training Resource
  • 20.
    Process Stage 1 AnalysingClimate Vulnerability: Climate Data Interpreting climate data: time frames and climate scenarios Climate change implies a longer time frame (50-100 years) than what is common in, and relevant for, local policy-making (4-10 years). This feature of climate policy obviously constitutes a challenge. Scenarios may be useful tools for policy-makers. We use the terms past, present, and future climate to refer to the various time frames: Climate Adaptation Online Training Resource
  • 21.
    Process Stage 1 AnalysingClimate Vulnerability: Climate Data Interpreting climate data: time frames and climate scenarios Past climate: Climate statistics are actually showing us the climate of the past. In planning new water and sanitation pipes, we often look at this kind of data. However, such data can be also be used to look at vulnerability aspects associated with existing natural climate variability e.g. very mild winters some years, very hard winters other years (particularly apparent in the UK). Climate Adaptation Online Training Resource
  • 22.
    Process Stage 1 AnalysingClimate Vulnerability: Climate Data Interpreting climate data: time frames and climate scenarios Present climate: Several effects of climate change can already be observed. Although natural variability accounts for some of the deviations from the past climate, such effects provide a signal as to what is underway. Thus, we should be adapting in ways different from those related to past climate. Climate Adaptation Online Training Resource
  • 23.
    Process Stage 1 AnalysingClimate Vulnerability: Climate Data Interpreting climate data: time frames and climate scenarios Future climate: The climate of the future can to some extent be estimated on the basis of emission scenarios. Adaptation to climate change (i.e. future climate) is what climate change adaptation is really about, although many fail to distinguish between past, present, and future climate both verbally and in practice. For example, upgrading a flood-prone road to present precipitation levels rather than to the precipitation levels expected in 20 years, constitutes an example of climate adaptation, but not climate change adaptation. Climate Adaptation Online Training Resource
  • 24.
    Process Stage 1 AnalysingClimate Vulnerability: Climate Data Climate scenarios for exploring future possibilities Scenarios represent a framework for thinking about the future based on a robust evidence base and set of diverse viewpoints about what might or could happen in the future. They are not factual accounts of what is happening today or forecasts of what will happen in the future. They are a combination of analysis and judgment about future possibilities. It is therefore useful to be aware that using scenarios can represent a challenge, albeit a stimulating one, to ‘traditional’ modes of thinking and ways of working. Climate Adaptation Online Training Resource
  • 25.
    Process Stage 1 AnalysingClimate Vulnerability: Climate Data Final key points: Developing regional scenarios and creating influence diagrams that correlate these scenarios to regional systems can help make climate data more useful for decision making However, often, we fail to reflect sufficiently on the notion of change. Natural variability in the short run vs. climate change in the long run The term ‘climate’ encompasses statistics of a number of meteorological elements in a given region over long periods of time. It is important to note that while natural variability can certainly account for variability in the short run, short-term deviations from the norm are inherently different from long-term changes in climate. As an example, natural variability can easily explain a couple of summer heat records within a decade, but several decades of unusually high summer heat records is more likely to imply long-term climate change. Depending on the scope of the vulnerability assessment, and the local conditions, you need different climate data input. More detailed climate data does not, however, reduce the uncertainties. Climate Adaptation Online Training Resource
  • 26.
    Process Stage 1 AnalysingClimate Vulnerability: Climate Data Final key points: Identify and Communicate Uncertainties On the one hand, it is important to be clear about the great uncertainty associated with climate change adaptation At the same time, it is vital to avoid a state of non-action based on the assumption that ‘everything’ is uncertain A possible solution to this dilemma is to try and differentiate our understanding of uncertainty Climate Adaptation Online Training Resource
  • 27.
    Process Stage 1 AnalysingClimate Vulnerability: Climate Data Final key points: ‘Climate modelling is inherently uncertain, but this does not mean that forecasts do not have value. One way to make decisions despite this uncertainty is to consider the range of possible climate outcomes instead of relying on single forecasts. Because each GCM incorporates slightly different assumptions about how the climate works, each generates different results. Decision makers can make more resilient decisions by incorporating a range of these results in their considerations.’ climate-decisions.org http://www.climate-decisions.org/2_Climate%20Forecasts.htm Climate Adaptation Online Training Resource