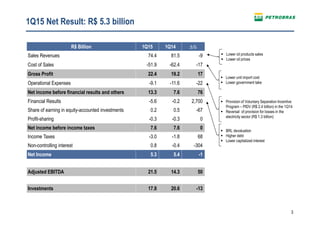
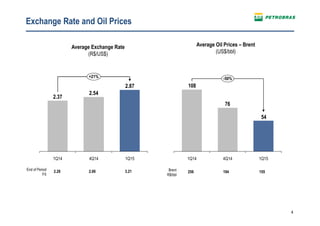
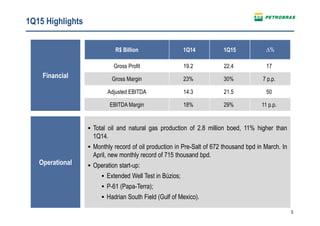
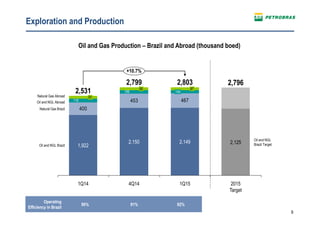
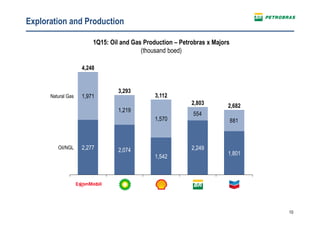
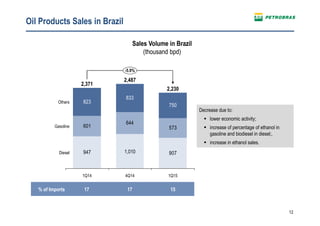
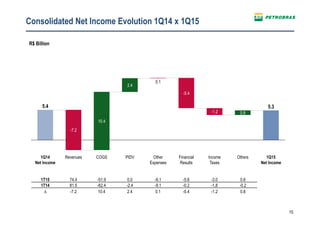
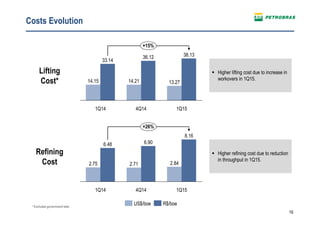
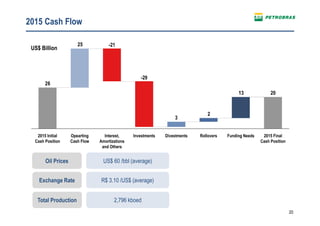
1
RESULTS ANNOUNCEMENT
1st Quarter 2015
__
Conference Call / Webcast
May, 18th 2015
2
DISCLAIMER
FORWARD-LOOKING STATEMENTS:
DISCLAIMER
The presentation may contain forward-looking statements about future
events within the meaning of Section 27A of the Securities Act of 1933, as
amended, and Section 21E of the Securities Exchange Act of 1934, as
amended, that are not based on historical facts and are not assurances of
future results. Such forward-looking statements merely reflect the
Company’s current views and estimates of future economic circumstances,
industry conditions, company performance and financial results. Such
terms as "anticipate", "believe", "expect", "forecast", "intend", "plan",
"project", "seek", "should", along with similar or analogous expressions, are
used to identify such forward-looking statements. Readers are cautioned
that these statements are only projections and may differ materially from
actual future results or events. Readers are referred to the documents filed
by the Company with the SEC, specifically the Company’s most recent
Annual Report on Form 20-F, which identify important risk factors that
could cause actual results to differ from those contained in the forward-
looking statements, including, among other things, risks relating to general
economic and business conditions, including crude oil and other
commodity prices, refining margins and prevailing exchange rates,
uncertainties inherent in making estimates of our oil and gas reserves
including recently discovered oil and gas reserves, international and
Brazilian political, economic and social developments, receipt of
governmental approvals and licenses and our ability to obtain financing.
We undertake no obligation to publicly update or revise any forward-
looking statements, whether as a result of new information or future
events or for any other reason. Figures for 2015 on are estimates or
targets.
All forward-looking statements are expressly qualified in their entirety
by this cautionary statement, and you should not place reliance on any
forward-looking statement contained in this presentation.
NON-SEC COMPLIANT OIL AND GAS RESERVES:
CAUTIONARY STATEMENT FOR US INVESTORS
We present certain data in this presentation, such as oil and gas
resources, that we are not permitted to present in documents filed with
the United States Securities and Exchange Commission (SEC) under
new Subpart 1200 to Regulation S-K because such terms do not
qualify as proved, probable or possible reserves under Rule 4-10(a) of
Regulation S-X.
3
1Q15 Net Result: R$ 5.3 billion
Lower unit import cost
Lower government take
Provision of Voluntary Separation Incentive
Program – PIDV (R$ 2.4 billion) in the 1Q14
Reversal of provision for losses in the
electricity sector (R$ 1.3 billion)
BRL devaluation
Higher debt
Lower capitalized interest
Lower oil products sales
Lower oil prices
R$ Billion 1Q15 1Q14 ∆%
Sales Revenues 74.4 81.5 -9
Cost of Sales -51.9 -62.4 -17
Gross Profit 22.4 19.2 17
Operational Expenses -9.1 -11.6 -22
Net income before financial results and others 13.3 7.6 76
Financial Results -5.6 -0.2 2,700
Share of earning in equity-accounted investments 0.2 0.5 -67
Profit-sharing -0.3 -0.3 0
Net income before income taxes 7.6 7.6 0
Income Taxes -3.0 -1.8 68
Non-controlling interest 0.8 -0.4 -304
Net Income 5.3 5.4 -1
Adjusted EBITDA 21.5 14.3 50
Investments 17.8 20.6 -13
4
Exchange Rate and Oil Prices
Average Exchange Rate
(R$/US$)
End of Period
FX
2.26 2.66 3.21
1Q14
2.37
+21%
1Q15
2.87
4Q14
2.54
Average Oil Prices – Brent
(US$/bbl)
Brent
R$/bbl
256 194 155
54
76
108
1Q15
-50%
4Q141Q14
5
1Q15 Highlights
Operational
Financial
R$ Billion 1Q14 1Q15 ∆%
Gross Profit 19.2 22.4 17
Gross Margin 23% 30% 7 p.p.
Adjusted EBITDA 14.3 21.5 50
EBITDA Margin 18% 29% 11 p.p.
Total oil and natural gas production of 2.8 million boed, 11% higher than
1Q14.
Monthly record of oil production in Pre-Salt of 672 thousand bpd in March. In
April, new monthly record of 715 thousand bpd.
Operation start-up:
Extended Well Test in Búzios;
P-61 (Papa-Terra);
Hadrian South Field (Gulf of Mexico).
6
Technological Acknowledgement of Petrobras at OTC
Since the 80’s, Petrobras has been innovating in ultra-deep water exploration
6
Mount Everest
8,8 km
1st oil field
found in
Campos Basin
OTC
Award
1992
1st FPSO
Production
System
OTC
Award
2001
1st commercial
discovery in
Pre-Salt
OTC
Award
2015
Deepest
flexible riser
water depth
6
8 km
0 km
K2 MOUNTAIN
(8.6 km)
Source: iStock/Petrobras images
7
Pre-Salt Highlights
* Petrobras and partners production
0
100
200
300
400
500
600
700
800
Average Monthly Production
(thousand bpd)*
Monthly Record in April/2015: 715
Thousand bpd
February 2013: 300
Thousand bpd
2.4 x
800 thousand bpd
Daily Production Record
04/11/2015
2008 2009 2010 2011 2012 2013 2014 April
2015
8
0%
20%
40%
60%
80%
100%
2010 2011 2012 2013 2014
Drilling Completion
Pre-Salt Highlights
Lula and Sapinhoá field
Source: Evaluate Energy
* Without government take
54% of time reduction
in well drilling and completion
Lifting Cost* in 2014
(US$/boe)
14.97
14.57
9.07
Others
Petrobras
Average
Pre-Salt
9
Exploration and Production
Operating
Efficiency in Brazil
90% 91% 92%
400
453 467
106
118
2,803
2,149
100
2015
Target
2,796
+10.7%
90
1Q14
2,531
1,922
91
87
4Q14
2,799
2,150
Oil and NGL Brazil
Natural Gas Brazil
Oil and NGL Abroad
Natural Gas Abroad
Oil and NGL
Brazil Target2,125
1Q15
Oil and Gas Production – Brazil and Abroad (thousand boed)
10
Exploration and Production
1Q15: Oil and Gas Production – Petrobras x Majors
(thousand boed)
554
881
2,682
1,801
2,803
2,249Oil/NGL
Natural Gas 3,112
1,542
1,570
3,293
2,074
1,219
4,248
2,277
1,971
11
Exploration and Production
30 34
61
14
12
17
26
8
47
1Q152014
22
87
2013 Apr-Dec/15
51
2012
42
Producers
Injectors
Connection of New Wells in Brazil
PLSVs 12 11 19 16
Productivity
(Km/PLSV)
94 90 97 91
69
12
Oil Products Sales in Brazil
% of Imports 17 17 15
Sales Volume in Brazil
(thousand bpd)
947 907
601
644
573
823
833
750
-5.9%
Diesel
Gasoline
Others
1Q15
2,230
4Q14
2,487
1,010
1Q14
2,371
Decrease due to:
lower economic activity;
increase of percentage of ethanol in
gasoline and biodiesel in diesel;.
increase in ethanol sales.
13
Oil Products Output
UTILIZATION FACTOR 96% 98% 86%
Yield
(Diesel, Gasoline and Jet Fuel)
66% 67% 67%
Oil Products Output in Brazil
(thousand bpd)
822 867 796
483 490
423
290 281
264
208 219
177
130
128125
105
-8%
Gasoline
Diesel
LPG
Naphtha
Jet Fuel
Fuel Oil
Others
1Q15
1.964
74
100
4Q14
2.171
82
104
1Q14
2.124
92 Lower production due to scheduled
stoppage in RLAM
RNEST start-up partially offset this
decrease.
14
Operating Income Evolution 1Q14 x 1Q15
R$ Billion
1Q14
Operating
Income
0.1
International
Activities
0.016.8
Gas and
Power
1.5
Biofuel
-0.4
Corporate
0.0
Distribution
13.3
Elimination
+76%
1Q15
Operating
Income
E&P
-11.4
Downstream
-0.8
7.6
1Q15 9.3 4.9 2.1 0.4 0.9 0.0 -4.2 0.0
1Q14 -7.4 16.2 0.6 0.5 0.8 -0.1 -3.4 0.4
∆ 16.8 -11.4 1.5 0.0 0.1 0.0 -0.8 -0.4
Contribution per Segment
15
Consolidated Net Income Evolution 1Q14 x 1Q15
R$ Billion
0.1
PIDV
2.4
COGS
10.4
Revenues
-7.2
1Q14
Net Income
5.4
Income
Taxes
-1.2
Financial
Results
-5.4
Other
Expenses
5.3
1Q15
Net Income
Others
0.8
1T15 74.4 -51.9 0.0 -9.1 -5.6 -3.0 0.6
1T14 81.5 -62.4 -2.4 -9.1 -0.2 -1,8 -0.2
∆ -7.2 10.4 2.4 0.1 -5.4 -1.2 0.8
16
Costs Evolution
Refining
Cost
Lifting
Cost*
* Excludes government take
+15%
1Q15
38.13
13.27
4Q14
36.12
14.21
1Q14
33.14
14.15
R$/boeUS$/boe
8.16
2.84
4Q14
6.90
2.71
+26%
1Q151Q14
6.48
2.75
Higher lifting cost due to increase in
workovers in 1Q15.
Higher refining cost due to reduction
in throughput in 1Q15.
17
General and Administrative Expenses
R$ Billion
General and Administrative Expenses
1Q15
+6%
3.4
4Q14
2.6
2.7
1Q14
Increase in line with inflation in the
period.
18
Financial Ratios - Indebtedness
LEVERAGE
ND/EBITDA
1)Net Debt / Annualized Adjusted EBITDA (Adjusted EBITDA = EBITDA excluding earnings of equity-accounted investments and impairments)
2)Net Debt / (Net Debt + Shareholders Equity)
4.00 3.94
5.02
4.77
3.86
39% 40%
43%
48%
52%
0%
10%
20%
30%
40%
50%
60%
1,0
2,0
3,0
4,0
5,0
6,0
7,0
8,0
1Q14 2Q14 3Q14 4Q14 1Q15
Net debt / EBITDA ¹ Net debt / Net capitalization ²
19
Indebtedness
1) Includes government securities and time deposits (maturity longer than 90 days)
Indebtedness
Indebtedness (R$ Billion) 03/31/15 12/31/14
Short-term debt 39.8 31.6
Long-term debt 360.9 319.5
Total Indebtedness 400.7 351.0
(-) Cash and cash equivalents ¹ 68.2 68.9
= Net debt 332.5 282.1
Indebtedness (US$ Billion)
Net debt 103.6 106.2
20
2015 Cash Flow
US$ Billion
US$ 60 /bbl (average)
R$ 3.10 /US$ (average)
Oil Prices
Exchange Rate
2013
2
3
25
26
-21
Interest,
Amortizations
and Others
-29
InvestmentsOpearting
Cash Flow
2015 Initial
Cash Position
2015 Final
Cash Position
Funding NeedsRolloversDivestments
2,796 kboedTotal Production
21
RESULTS ANNOUNCEMENT
1ST Quarter 2015
__
Information:
Investor Relations
+55 21 3224-1510
investors@petrobras.com

Webcast 1Q15

  • 1.
    1 RESULTS ANNOUNCEMENT 1st Quarter2015 __ Conference Call / Webcast May, 18th 2015
  • 2.
    2 DISCLAIMER FORWARD-LOOKING STATEMENTS: DISCLAIMER The presentationmay contain forward-looking statements about future events within the meaning of Section 27A of the Securities Act of 1933, as amended, and Section 21E of the Securities Exchange Act of 1934, as amended, that are not based on historical facts and are not assurances of future results. Such forward-looking statements merely reflect the Company’s current views and estimates of future economic circumstances, industry conditions, company performance and financial results. Such terms as "anticipate", "believe", "expect", "forecast", "intend", "plan", "project", "seek", "should", along with similar or analogous expressions, are used to identify such forward-looking statements. Readers are cautioned that these statements are only projections and may differ materially from actual future results or events. Readers are referred to the documents filed by the Company with the SEC, specifically the Company’s most recent Annual Report on Form 20-F, which identify important risk factors that could cause actual results to differ from those contained in the forward- looking statements, including, among other things, risks relating to general economic and business conditions, including crude oil and other commodity prices, refining margins and prevailing exchange rates, uncertainties inherent in making estimates of our oil and gas reserves including recently discovered oil and gas reserves, international and Brazilian political, economic and social developments, receipt of governmental approvals and licenses and our ability to obtain financing. We undertake no obligation to publicly update or revise any forward- looking statements, whether as a result of new information or future events or for any other reason. Figures for 2015 on are estimates or targets. All forward-looking statements are expressly qualified in their entirety by this cautionary statement, and you should not place reliance on any forward-looking statement contained in this presentation. NON-SEC COMPLIANT OIL AND GAS RESERVES: CAUTIONARY STATEMENT FOR US INVESTORS We present certain data in this presentation, such as oil and gas resources, that we are not permitted to present in documents filed with the United States Securities and Exchange Commission (SEC) under new Subpart 1200 to Regulation S-K because such terms do not qualify as proved, probable or possible reserves under Rule 4-10(a) of Regulation S-X.
  • 3.
    3 1Q15 Net Result:R$ 5.3 billion Lower unit import cost Lower government take Provision of Voluntary Separation Incentive Program – PIDV (R$ 2.4 billion) in the 1Q14 Reversal of provision for losses in the electricity sector (R$ 1.3 billion) BRL devaluation Higher debt Lower capitalized interest Lower oil products sales Lower oil prices R$ Billion 1Q15 1Q14 ∆% Sales Revenues 74.4 81.5 -9 Cost of Sales -51.9 -62.4 -17 Gross Profit 22.4 19.2 17 Operational Expenses -9.1 -11.6 -22 Net income before financial results and others 13.3 7.6 76 Financial Results -5.6 -0.2 2,700 Share of earning in equity-accounted investments 0.2 0.5 -67 Profit-sharing -0.3 -0.3 0 Net income before income taxes 7.6 7.6 0 Income Taxes -3.0 -1.8 68 Non-controlling interest 0.8 -0.4 -304 Net Income 5.3 5.4 -1 Adjusted EBITDA 21.5 14.3 50 Investments 17.8 20.6 -13
  • 4.
    4 Exchange Rate andOil Prices Average Exchange Rate (R$/US$) End of Period FX 2.26 2.66 3.21 1Q14 2.37 +21% 1Q15 2.87 4Q14 2.54 Average Oil Prices – Brent (US$/bbl) Brent R$/bbl 256 194 155 54 76 108 1Q15 -50% 4Q141Q14
  • 5.
    5 1Q15 Highlights Operational Financial R$ Billion1Q14 1Q15 ∆% Gross Profit 19.2 22.4 17 Gross Margin 23% 30% 7 p.p. Adjusted EBITDA 14.3 21.5 50 EBITDA Margin 18% 29% 11 p.p. Total oil and natural gas production of 2.8 million boed, 11% higher than 1Q14. Monthly record of oil production in Pre-Salt of 672 thousand bpd in March. In April, new monthly record of 715 thousand bpd. Operation start-up: Extended Well Test in Búzios; P-61 (Papa-Terra); Hadrian South Field (Gulf of Mexico).
  • 6.
    6 Technological Acknowledgement ofPetrobras at OTC Since the 80’s, Petrobras has been innovating in ultra-deep water exploration 6 Mount Everest 8,8 km 1st oil field found in Campos Basin OTC Award 1992 1st FPSO Production System OTC Award 2001 1st commercial discovery in Pre-Salt OTC Award 2015 Deepest flexible riser water depth 6 8 km 0 km K2 MOUNTAIN (8.6 km) Source: iStock/Petrobras images
  • 7.
    7 Pre-Salt Highlights * Petrobrasand partners production 0 100 200 300 400 500 600 700 800 Average Monthly Production (thousand bpd)* Monthly Record in April/2015: 715 Thousand bpd February 2013: 300 Thousand bpd 2.4 x 800 thousand bpd Daily Production Record 04/11/2015 2008 2009 2010 2011 2012 2013 2014 April 2015
  • 8.
    8 0% 20% 40% 60% 80% 100% 2010 2011 20122013 2014 Drilling Completion Pre-Salt Highlights Lula and Sapinhoá field Source: Evaluate Energy * Without government take 54% of time reduction in well drilling and completion Lifting Cost* in 2014 (US$/boe) 14.97 14.57 9.07 Others Petrobras Average Pre-Salt
  • 9.
    9 Exploration and Production Operating Efficiencyin Brazil 90% 91% 92% 400 453 467 106 118 2,803 2,149 100 2015 Target 2,796 +10.7% 90 1Q14 2,531 1,922 91 87 4Q14 2,799 2,150 Oil and NGL Brazil Natural Gas Brazil Oil and NGL Abroad Natural Gas Abroad Oil and NGL Brazil Target2,125 1Q15 Oil and Gas Production – Brazil and Abroad (thousand boed)
  • 10.
    10 Exploration and Production 1Q15:Oil and Gas Production – Petrobras x Majors (thousand boed) 554 881 2,682 1,801 2,803 2,249Oil/NGL Natural Gas 3,112 1,542 1,570 3,293 2,074 1,219 4,248 2,277 1,971
  • 11.
    11 Exploration and Production 3034 61 14 12 17 26 8 47 1Q152014 22 87 2013 Apr-Dec/15 51 2012 42 Producers Injectors Connection of New Wells in Brazil PLSVs 12 11 19 16 Productivity (Km/PLSV) 94 90 97 91 69
  • 12.
    12 Oil Products Salesin Brazil % of Imports 17 17 15 Sales Volume in Brazil (thousand bpd) 947 907 601 644 573 823 833 750 -5.9% Diesel Gasoline Others 1Q15 2,230 4Q14 2,487 1,010 1Q14 2,371 Decrease due to: lower economic activity; increase of percentage of ethanol in gasoline and biodiesel in diesel;. increase in ethanol sales.
  • 13.
    13 Oil Products Output UTILIZATIONFACTOR 96% 98% 86% Yield (Diesel, Gasoline and Jet Fuel) 66% 67% 67% Oil Products Output in Brazil (thousand bpd) 822 867 796 483 490 423 290 281 264 208 219 177 130 128125 105 -8% Gasoline Diesel LPG Naphtha Jet Fuel Fuel Oil Others 1Q15 1.964 74 100 4Q14 2.171 82 104 1Q14 2.124 92 Lower production due to scheduled stoppage in RLAM RNEST start-up partially offset this decrease.
  • 14.
    14 Operating Income Evolution1Q14 x 1Q15 R$ Billion 1Q14 Operating Income 0.1 International Activities 0.016.8 Gas and Power 1.5 Biofuel -0.4 Corporate 0.0 Distribution 13.3 Elimination +76% 1Q15 Operating Income E&P -11.4 Downstream -0.8 7.6 1Q15 9.3 4.9 2.1 0.4 0.9 0.0 -4.2 0.0 1Q14 -7.4 16.2 0.6 0.5 0.8 -0.1 -3.4 0.4 ∆ 16.8 -11.4 1.5 0.0 0.1 0.0 -0.8 -0.4 Contribution per Segment
  • 15.
    15 Consolidated Net IncomeEvolution 1Q14 x 1Q15 R$ Billion 0.1 PIDV 2.4 COGS 10.4 Revenues -7.2 1Q14 Net Income 5.4 Income Taxes -1.2 Financial Results -5.4 Other Expenses 5.3 1Q15 Net Income Others 0.8 1T15 74.4 -51.9 0.0 -9.1 -5.6 -3.0 0.6 1T14 81.5 -62.4 -2.4 -9.1 -0.2 -1,8 -0.2 ∆ -7.2 10.4 2.4 0.1 -5.4 -1.2 0.8
  • 16.
    16 Costs Evolution Refining Cost Lifting Cost* * Excludesgovernment take +15% 1Q15 38.13 13.27 4Q14 36.12 14.21 1Q14 33.14 14.15 R$/boeUS$/boe 8.16 2.84 4Q14 6.90 2.71 +26% 1Q151Q14 6.48 2.75 Higher lifting cost due to increase in workovers in 1Q15. Higher refining cost due to reduction in throughput in 1Q15.
  • 17.
    17 General and AdministrativeExpenses R$ Billion General and Administrative Expenses 1Q15 +6% 3.4 4Q14 2.6 2.7 1Q14 Increase in line with inflation in the period.
  • 18.
    18 Financial Ratios -Indebtedness LEVERAGE ND/EBITDA 1)Net Debt / Annualized Adjusted EBITDA (Adjusted EBITDA = EBITDA excluding earnings of equity-accounted investments and impairments) 2)Net Debt / (Net Debt + Shareholders Equity) 4.00 3.94 5.02 4.77 3.86 39% 40% 43% 48% 52% 0% 10% 20% 30% 40% 50% 60% 1,0 2,0 3,0 4,0 5,0 6,0 7,0 8,0 1Q14 2Q14 3Q14 4Q14 1Q15 Net debt / EBITDA ¹ Net debt / Net capitalization ²
  • 19.
    19 Indebtedness 1) Includes governmentsecurities and time deposits (maturity longer than 90 days) Indebtedness Indebtedness (R$ Billion) 03/31/15 12/31/14 Short-term debt 39.8 31.6 Long-term debt 360.9 319.5 Total Indebtedness 400.7 351.0 (-) Cash and cash equivalents ¹ 68.2 68.9 = Net debt 332.5 282.1 Indebtedness (US$ Billion) Net debt 103.6 106.2
  • 20.
    20 2015 Cash Flow US$Billion US$ 60 /bbl (average) R$ 3.10 /US$ (average) Oil Prices Exchange Rate 2013 2 3 25 26 -21 Interest, Amortizations and Others -29 InvestmentsOpearting Cash Flow 2015 Initial Cash Position 2015 Final Cash Position Funding NeedsRolloversDivestments 2,796 kboedTotal Production
  • 21.
    21 RESULTS ANNOUNCEMENT 1ST Quarter2015 __ Information: Investor Relations +55 21 3224-1510 investors@petrobras.com