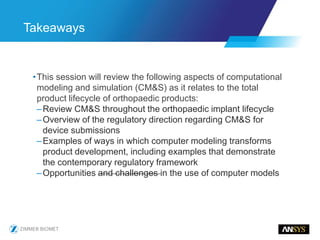
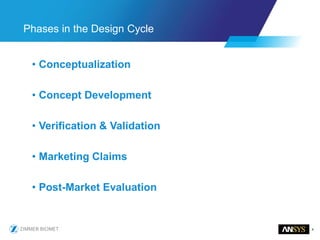
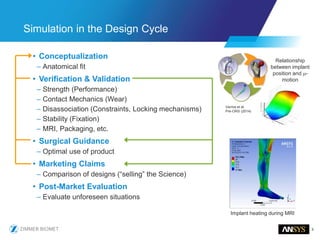
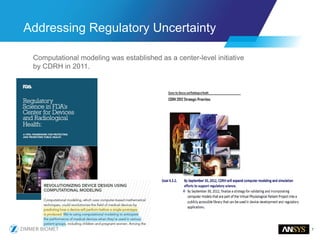
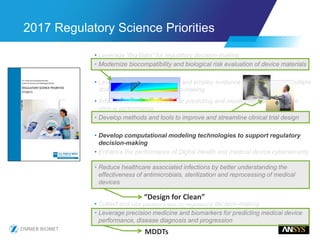
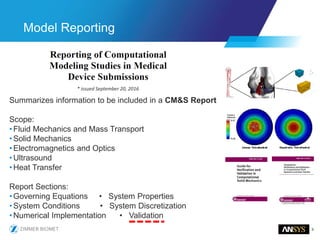
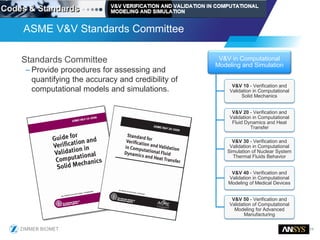
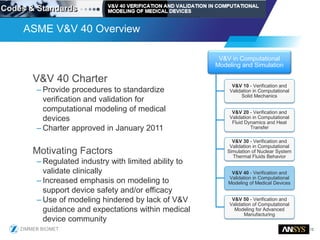
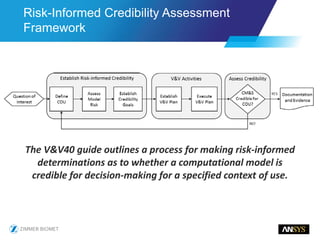
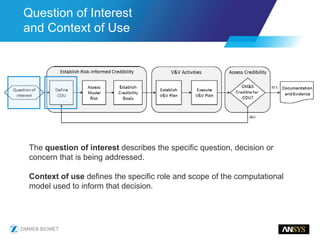
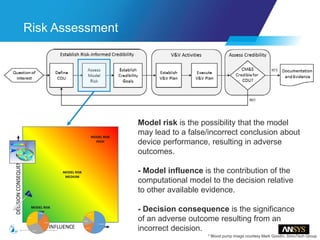
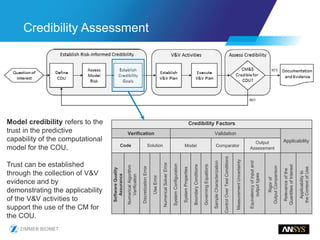
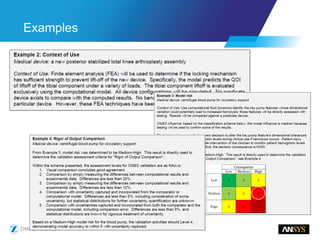
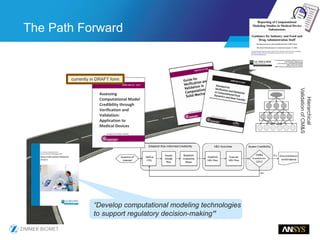
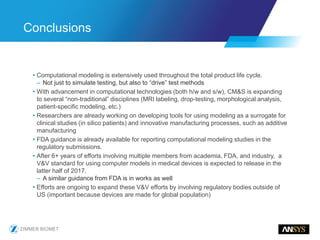
14 June, 2017
Leveraging Computational
Modeling and Simulation for
Device Design
Marc Horner, Ph.D.
Technical Lead, Healthcare
ANSYS, Inc.
Mehul Dharia
Principal Research Engineer
Zimmer Biomet
•This session will review the following aspects of computational
modeling and simulation (CM&S) as it relates to the total
product lifecycle of orthopaedic products:
–Review CM&S throughout the orthopaedic implant lifecycle
–Overview of the regulatory direction regarding CM&S for
device submissions
–Examples of ways in which computer modeling transforms
product development, including examples that demonstrate
the contemporary regulatory framework
–Opportunities and challenges in the use of computer models
Takeaways
4
Phases in the Design Cycle
• Conceptualization
• Concept Development
• Verification & Validation
• Marketing Claims
• Post-Market Evaluation
5
Simulation in the Design Cycle
• Conceptualization
– Anatomical fit
• Verification & Validation
– Strength (Performance)
– Contact Mechanics (Wear)
– Disassociation (Constraints, Locking mechanisms)
– Stability (Fixation)
– MRI, Packaging, etc.
• Surgical Guidance
– Optimal use of product
• Marketing Claims
– Comparison of designs (“selling” the Science)
• Post-Market Evaluation
– Evaluate unforeseen situations
Implant heating during MRI
Relationship
between implant
position and µ-
motion
Verma et al.
Pre-ORS (2014)
Regulatory Pathway
for CM&S
7
Addressing Regulatory Uncertainty
Computational modeling was established as a center-level initiative
by CDRH in 2011.
• Leverage “Big Data” for regulatory decision-making
• Modernize biocompatibility and biological risk evaluation of device materials
• Leverage real-world evidence and employ evidence synthesis across multiple
domains in regulatory decision-making3
• Advance tests and methods for predicting and monitoring medical device
clinical performance
• Develop methods and tools to improve and streamline clinical trial design
• Develop computational modeling technologies to support regulatory
decision-making
• Enhance the performance of Digital Health and medical device cybersecurity
• Reduce healthcare associated infections by better understanding the
effectiveness of antimicrobials, sterilization and reprocessing of medical
devices
• Collect and use patient input in regulatory decision-making
• Leverage precision medicine and biomarkers for predicting medical device
performance, disease diagnosis and progression
2017 Regulatory Science Priorities
“Design for Clean”
MDDTs
9
Model Reporting
* issued September 20, 2016
Summarizes information to be included in a CM&S Report
Scope:
•Fluid Mechanics and Mass Transport
•Solid Mechanics
•Electromagnetics and Optics
•Ultrasound
•Heat Transfer
Report Sections:
•Governing Equations • System Properties
•System Conditions • System Discretization
•Numerical Implementation • Validation
11
Standards Committee
– Provide procedures for assessing and
quantifying the accuracy and credibility of
computational models and simulations.
ASME V&V Standards Committee
V&V in Computational
Modeling and Simulation
V&V 10 - Verification and
Validation in Computational
Solid Mechanics
V&V 20 - Verification and
Validation in Computational
Fluid Dynamics and Heat
Transfer
V&V 30 - Verification and
Validation in Computational
Simulation of Nuclear System
Thermal Fluids Behavior
V&V 40 - Verification and
Validation in Computational
Modeling of Medical Devices
V&V 50 - Verification and
Validation of Computational
Modeling for Advanced
Manufacturing
12
V&V 40 Charter
– Provide procedures to standardize
verification and validation for
computational modeling of medical
devices
– Charter approved in January 2011
Motivating Factors
– Regulated industry with limited ability to
validate clinically
– Increased emphasis on modeling to
support device safety and/or efficacy
– Use of modeling hindered by lack of V&V
guidance and expectations within medical
device community
ASME V&V 40 Overview
V&V in Computational
Modeling and Simulation
V&V 10 - Verification and
Validation in Computational
Solid Mechanics
V&V 20 - Verification and
Validation in Computational
Fluid Dynamics and Heat
Transfer
V&V 30 - Verification and
Validation in Computational
Simulation of Nuclear System
Thermal Fluids Behavior
V&V 40 - Verification and
Validation in Computational
Modeling of Medical Devices
V&V 50 - Verification and
Validation of Computational
Modeling for Advanced
Manufacturing
The V&V40 guide outlines a process for making risk-informed
determinations as to whether a computational model is
credible for decision-making for a specified context of use.
Risk-Informed Credibility Assessment
Framework
The question of interest describes the specific question, decision or
concern that is being addressed.
Context of use defines the specific role and scope of the computational
model used to inform that decision.
Question of Interest
and Context of Use
Model risk is the possibility that the model
may lead to a false/incorrect conclusion about
device performance, resulting in adverse
outcomes.
- Model influence is the contribution of the
computational model to the decision relative
to other available evidence.
- Decision consequence is the significance
of an adverse outcome resulting from an
incorrect decision.
* Blood pump image courtesy Mark Goodin, SimuTech Group
Risk Assessment
Model credibility refers to the
trust in the predictive
capability of the computational
model for the COU.
Trust can be established
through the collection of V&V
evidence and by
demonstrating the applicability
of the V&V activities to
support the use of the CM for
the COU.
Credibility Factors
Verification Validation
Applicability
Code Solution Model Comparator
Output
Assessment
SoftwareQuality
Assurance
NumericalAlgorithm
Verification
DiscretizationError
UseError
NumericalSolverError
SystemConfiguration
SystemProperties
BoundaryConditions
GoverningEquations
SampleCharacterization
ControlOverTestConditions
MeasurementUncertainty
Equivalencyofinputand
outputtypes
Rigorof
OutputComparison
Relevanceofthe
QuantitiesofInterest
Applicabilityto
theContextofUse
Credibility Assessment
Examples
The Path Forward
Assessing
Computational Model
Credibility through
Verification and
Validation:
Application to
Medical Devices
currently in DRAFT form
“Develop computational modeling technologies
to support regulatory decision-making”
Hierarchical
ValidationofCM&S
Examples
20
Conceptualization
Anatomical Fit
• “Better conform to anatomy” → “Better clinical outcomes”
• ZiBRA*:
– Morphological Analysis
– Statistical Shape Analyses
– Automated Landmark Detection & Virtual Surgery
– Component Placement Optimization
– Implant Fit Assessment
• Extensive digital anatomic library
– Captures ethnic and gender variation across the global population
– Caucasian / African American / European / Indian / Chinese / Japanese / Korean
Zimmer Biomet Internal Software
21
Anatomical Fit
Tibial Baseplate
• Compromise Between
– Proper Rotation (kinematics)
– Minimum Overhang (impingement)
– Optimal Coverage (stability)
• Subtle shape differences between ethnicities and genders
Dai et al, J Ortho Res 31; 2013
22
Anatomical Fit
Tibial Baseplate
optimizes the “compromise” between kinematics,
impingement and fixation aspects
Zimmer Biomet Persona
Tibial Baseplate
• One design for the global population
Strength Testing
Total Ankle Replacement (TAR)
24
Strength Testing
Based on Standard
TKA Tibial Baseplate THA Stem
• What if a Standard is not specific enough?
ASTM F1800-12 ISO 7206-4
25
Total Ankle Replacement
Strength Testing
•Standard provides guidance
– Does not provide specifics for strength testing
•Method
– Develop biomechanical loading rationale
– Input to Simulation
– Determine worst case condition from simulation
– Develop test
Trabecular Metal
(TM)
Trabecular Metal
(TM)
Talar
Component
Tibial Tray
HXPE
Zimmer Biomet
Trabecular Metal Total Ankle
Dharia et al, World Congress of Biomechanics, 2014
Talus
Tibia
26
Biomechanical Input
Forces & Kinematics
• Joint Forces Axial Compressive Load
•Flexion/Extension Internal/External Rotation
•Anterior/Posterior Translation
– obtained from Bell et al., 1997
Seireg & Arvikar, J Biomech, 1975
Procter, J Biomech, 1982
Anderson et al, J Biomech, 2001
Stauffer et al, Clin Orthop Rel Res, 1977
Lamoreux , Bull Prosthet Res, 1971
Bahr et al, Knee Surg, 1998
Singer et al, JBJS, 2013
Stauffer et al, Clin Orthop Rel Res, 1977
27
Biomechanical Input
Load and Motion Curves
• Combined Loading
Dharia et al, Ortho. Research Society, 2013
28
Physiological Model
Tibia & Talus
Dharia et al, Ortho. Research Society, 2013
Model
Tibia
Model
Talus
Model
29
Tibial Insert
Stress Results
Individual Components
Dharia et al, World Congress of Biomechanics, 2014
Tibial Baseplate
41% 45%
Talus Component
30
Fatigue Test
Physiologically Motivated Inputs
• Test Orientations
– 41% & 45% Gait Positions for Tibia & Talus assemblies
– Apply axial load
– 10 Mc test
Dharia et al, World Congress of Biomechanics, 2014
Tibia Talus
31
Foot
Physiologically Motivated Inputs ??
• Hallux Valgus
– Open Wedge Osteotomies
• Osteotomy Cut, Open Wedge
• Place Spacer/Implant(s)
• Loading??
www.arthrex.com
Defect Correction
32
Musculoskeletal Model
Loading through 1st Metatarsal
• Kinematic Foot Model
– 26 segments (bones)
– Contains bones, muscles, ligaments, joints
– 75 Forces through 1st Metatarsal
Al-Munnajed et al, J Biomech Eng., March 2016, Vol. 138
Y
Z
X
Ligaments Muscles
Dharia et al, BMES/FDA Frontiers in Medical Device, 2016
33
Patient & Surgical Variability
Surgical Guidance
• 5 Osteotomy Planes
– Defined using the ZiBRATM Anatomical Modeling System*
•Neutral (N): perpendicular to long axis
•5° in abduction (AB)
•5° in adduction (AD)
•5° in dorsiflexion (DF)
•5° in plantar-flexion (PF)
Dharia et al, BMES/FDA Frontiers in Medical Device, 2016
*Bischoff et al., ASME/FDA Frontiers in Medical Devices, 2013
Compressive
Force
Flexion/Extension
Moment
34
Proximal Tibial Locking Plate
Optimal Screw Configurations
• Potential Screw Configurations
– Models A & D has hole 6 unsecured
Dharia et al., Orthopaedic Research Society, 2006
35
Optimal Screw Configurations
Surgical Guidance
• Maximum Principal Stress
– Peak stress at unsecured hole 6 in Models A & D.
Dharia et al., Orthopaedic Research Society, 2006
Contact Mechanics
Total Ankle Replacement (TAR)
37
Contact Mechanics
Contact Area & Pressure (CAREA/CPRESS)
• Edge Loading
– Cause
•Deformity, V/V Malalignment, Congruency
– Effect
– Point or edge loading on polyethylene
– Increased wear
– Catastrophic failure
Easley, JBJS Am 2011;93:1455-1468
Espinosa, JBJS Am 2010 Laflamme, AOFAS 2012Assal, F&A Intl 2003
38
Test Setup
ASTM F 2665-09
– Contact Area and Contact Pressure should be
determined at various flexion angles
• 0°, ±10°, ±15° tibiotalar flexion angles
•800 N load
AP View ML View
Dharia et al, World Congress of Biomechanics, 2014
39
Results
CAREA/CPRESS
• Mean Contact Area
• Contact Pressure - Comparison to Predicate
Contact
Area
Contact
Pressure
New Design
Predicate Design
Dharia et al, World Congress of Biomechanics, 2014
40
How are these Results Relevant?
CAREA/CPRESS
– Does not represent physiological condition - tested at constant 800N load.
– All the load and motion profiles (IE, AP, Axial loads etc.) are not captured at
the tested flexion angles.
– The known worst case gait position (41%) is not tested.
– Simulation can provide better insights.
Contact Area Contact Pressure
Dharia et al, World Congress of Biomechanics, 2014
41
CAREA/CPRESS Comparison
Neutral Implantation
• Comparison to Predicates
– Fixed Bearing and Mobile Bearing
Fixed Bearing
Predicate
Mobile Bearing
Predicate
Dharia et al, American Orthopaedic Foot & Ankle Soc., 2011 Dharia et al, American Orthopaedic Foot & Ankle Soc., 2013
Fixation
43
Micromotion
Reverse Shoulder Arthroplasty
• Stability predictions in RSA
Zimmer Biomet Comprehensive Reverse Shoulder System
Subsidence
Lift-off
Normalized
Micromotion
Dharia et al, Intl Society of Technology & Arthroplasty, 2016
44
Total Ankle Replacement
Clinical Outcomes
• Low Survivability
– 78% to 95% @ 5 years
– Revision rate >double of THA, TKA
•High Revision Rates (loosening)
– 26% (Australian Registry, 2013)
– 48% (New Zealand Registry, 2013)
– 50% (Swedish Registry, 2013)
– 68% (Daniels et al., 2014)
• Design Features Affecting Loosening
– Fixation features (Keel etc.)
– Fixation Approach (cemented, cementless)
– Bony Support
Bonnin et al., 2004; Henricson et al, 2007; Hosman et al., 2007
Labek et al., 2011
Bischoff et al., Orthopaedic Research Society, 2016
45
Bony Support
Flat vs Anatomical Cut
• Assumption: ↑Bony Support, ↑Stability, ↑Load Transfer
• Hypothesis: Anatomical Cut → ↑Bony Support
– ↑Bony Density (HU); ↑Surface Area (SA)
•CT Data: ~0.5mm slice thickness
Brigido and DiDomenica, 2016
Source Ethnicity Talus count Tibia count Matched pairs
Total cohort Caucasian, Korean,
Japanese, Indian
N=52
34M / 18F
N=81
56M / 25F
N=30
23M / 7F
Bischoff et al., Orthopaedic Research Society, 2016
46
Bony Support
Method
• Tibia
• Talus
•Output
– Normalized HU (Density)
– Normalized SA (surface area)
– Normalized Bony Support (HU*SA)
Articulation
axis
2mm depth
4mm depth
6mm depth
Resection depth
defined based on high
point of talar dome
Resection depth defined
based on distal
center of tibia
6mm depth
4mm depth
2mm depth
Anatomic
HU↑
HU ↓FlatFlat
Bischoff et al., Orthopaedic Research Society, 2016
47
Bony Support
Results
Observations:
1.Boney support is statistically significantly increased for anatomic cuts relative to
flat cuts at all cut depths, for tibia and talus
2.Depth of cut most significantly influences boney support for flat cuts of talus
(~90% increase from 2-6mm), attributed to increased SA with depth
Tibia Talus
Bischoff et al., Orthopaedic Research Society, 2016
Disassociation
Locking Mechanism (Knee)
49
Background
Tibial Tray Anterior Liftoff
•Locking Mechanism strength
– Disassociation of Tibial Component
from Tibial Tray
– Measure Tibial Component Lift-off
distance
•Question of Interest
– Does the locking mechanism of a
posterior-stabilized TKA design have
sufficient strength to withstand
posteriorly directed loads?
Zimmer Biomet TKA
50
Tibial Tray Anterior Liftoff
Scope
• 2 Tray Sizes
– Small & Medium
• Model & Experiment
• Output Comparison
– Rank Order & Absolute Values
Rail
Height
Anterior
Rail
Rail Height
Tibial Tray
Tibial
Spine
3°
Posterior
Slope
Articular
Surface
Dharia et al, ASME Verification & Validation Symposium, 2014
51
Tibial Tray Anterior Liftoff
Model & Experiment
• Model Experiment
Load on anterior
tibial spine
Dharia et al, ASME Verification & Validation Symposium, 2014
52
Tibial Tray Anterior Liftoff
Results
• The ratio (Medium/small) of predicted
versus measured load compared within
2.2%.
– Model is validated for Rank Ordering sizes
• Model vs Exp Absolute Values
– 1.5% for medium
– 3.5% for small
– Model is validated to use in lieu of testing
• Submit 510(k) of new (similar) design
– Outcome?
Size Measured Force (N) Predicted Force (N) % difference
Medium Average 744.1 733 1.5%
Small Average 426.6 412 3.5%
Ratio, medium/small 1.74 1.78 2.2%
Dharia et al, ASME Verification & Validation Symposium, 2014
ModelExperiment
53
Tibial Tray Anterior Liftoff
V&V 40 Approach
• How Good is Good Enough?
– Depends on COU
– Risk informed credibility requirement
• What is the Decision Consequence?
• What is the Model Influence?
– What additional information is available?
• Predicate device
• Testing on predicate device and/or new device
– Plan V&V activities accordingly
• Computer Model & Comparator (e.g. Experiment)
54
Context Of Use (COU)
Tibial Tray Anterior Liftoff
•Differentiation
– Based on additional information available (outside of model)
•Predicate device, Benchtop Testing
• COU1, Performance evaluation without testing: The tibial component anterior
liftoff is evaluated exclusively using the computational model.
• COU2, Performance evaluation with testing: The model is used to predict the
worst-case size across the proposed product portfolio in terms of tibial component
anterior liftoff, and this worst case is then physically tested.
• COU3, Superiority evaluation without testing: The model is used to predict the
tibial component anterior liftoff across all sizes in the proposed product portfolio,
with no associated benchtop testing. Results are benchmarked against similar
modeling results from a successful predicate device.
No Predicate Device Predicate Device
None COU1 COU3
Worst Case COU2 COU4 (a,b)
Matrix of Proposed COUs
Existence of Predicate Device
Benchtop Testing
55
Context Of Use (COU)
Tibial Tray Anterior Liftoff
• COU4, Superiority evaluation with testing: Model predictions of tibial
component anterior liftoff are supported by benchtop testing, and evaluation of the
proposed product portfolio is benchmarked against that of a predicate device.
– This may occur in multiple ways.
No Predicate Device Predicate Device
None COU1 COU3
Worst Case COU2 COU4 (a,b)
Matrix of Proposed COUs
Existence of Predicate Device
Benchtop Testing
56
Context Of Use (COU)
Examples
• COU1: Tibial component liftoff is evaluated exclusively using the computational
model. No predicate device exists to compare with the computed results. No
bench testing will be performed for this device.
• COU2: A worst case size of a new design family will be determined for tibial
component liftoff using computational model, which will then be tested in
laboratory to ensure that it meets functional requirements. No predicate device
exists.
• COU3: Tibial component liftoff of new device and a predicate device is evaluated
using the computational model. No bench testing will be performed.
• COU4a: A worst case size of a new design family will be determined for tibial
component liftoff using computational model, which will then be tested in
laboratory to compare with test results of a predicate device.
• COU4b: A worst case size for a new and a predicate design will be determined for
tibial component liftoff using computational model. The worst design will then be
tested in laboratory to ensure that it meets functional requirements.
No Predicate Device Predicate Device
None COU1 COU3
Worst Case COU2 COU4 (a,b)
Matrix of Proposed COUs
Existence of Predicate Device
Benchtop Testing
57
Model Risk
•Decision Consequence
– Revision Surgery
• Independent of model
•Model Influence
– LOW: Results from the model are a negligible factor in the decision associated
with the question being answered. (COU4)
– HIGH: Results from the model are the primary factor in the decision associated
with the question being answered (COU1)
Lower
Higher
COU1
COU1
COU1-4
COU4
COU4
58
V&V Activities
Credibility Factors
•Two modeling assumptions
– Polyethylene Material
– Component Size & Locking Region
Geometry
Credibility Factors
Software Quality Assurance
Numerical Code Verification
Discretization Error*
Numerical Solver Error
Use Error
Model Form
Model Input
Test Samples
Test Conditions
Equivalency of Input
Parameters
Output Comparison*
Relevance of the Quantities of
Interest *
Relevance of the Validation
Activities to the COU*
Applicability
Activities
Verification
Code
Calculation
Validation
Computational
Model
Comparator
Assessment
59
V&V Activities
Model Validation – Model Form
•Constitutive polyethylene material
model
– Several material models available in literature
– How does selected material model impacts
model predictions
• May not justify further quantification
• May have to try one or more material models
to:
– Quantify impact on predictions
– Increase confidence that decision related to COU
is not impacted by material model selection
Lower
Risk
Higher
Risk
Credibility Factors
Software Quality Assurance
Numerical Code Verification
Discretization Error
Numerical Solver Error
Use Error
Model Form
Model Input
Test Samples
Test Conditions
Equivalency of Input
Parameters
Output Comparison
Relevance of the Quantities of
Interest
Relevance of the Validation
Activities to the COU
Applicability
Activities
Verification
Code
Calculation
Validation
Computational
Model
Comparator
Assessment
60
V&V Activities
Model Validation – Model Input
System Configuration
•Component Size
•Variation in Locking Region Geometry
– Sensitivity Analyses on Tolerance in
individual component size
• Nominal dimensions
• LMC, MMC
• LMC, MMC
– Both Tibial Component and Tbial Tray
– All component sizes
Lower
Risk
Higher
Risk
Credibility Factors
Software Quality Assurance
Numerical Code Verification
Discretization Error
Numerical Solver Error
Use Error
Model Form
Model Input
Test Samples
Test Conditions
Equivalency of Input
Parameters
Output Comparison
Relevance of the Quantities of
Interest
Relevance of the Validation
Activities to the COU
Applicability
Activities
Verification
Code
Calculation
Validation
Computational
Model
Comparator
Assessment
61
V&V Activities
Model Validation – Model Input
System Conditions
•Insertion of Poly Tibial into Metal Tray
• No Interference Fit
• Interference Fit to capture residual stress
• May have to model the insertion process
Quantify the sensitivity of the modeling assumptions
on modeling predictions
Lower
Risk
Higher
Risk
Credibility Factors
Software Quality Assurance
Numerical Code Verification
Discretization Error
Numerical Solver Error
Use Error
Model Form
Model Input
Test Samples
Test Conditions
Equivalency of Input
Parameters
Output Comparison
Relevance of the Quantities of
Interest
Relevance of the Validation
Activities to the COU
Applicability
Activities
Verification
Code
Calculation
Validation
Computational
Model
Comparator
Assessment
62
V&V Activities
Comparator Validation – Test Samples
•Quantification of locking region
geometry
• Use production parts
• Inspect key parameters
– Understand which tolerance band is tested
• Specifically produce parts
– At targeted dimension within tolerance
band
Lower
Risk
Higher
Risk
Credibility Factors
Software Quality Assurance
Numerical Code Verification
Discretization Error
Numerical Solver Error
Use Error
Model Form
Model Input
Test Samples
Test Conditions
Equivalency of Input
Parameters
Output Comparison
Relevance of the Quantities of
Interest
Relevance of the Validation
Activities to the COU
Applicability
Activities
Verification
Code
Calculation
Validation
Computational
Model
Comparator
Assessment
63
V&V Activities
Validation Assessment – Equivalency of Input Parameters
•Tibiofemoral Contact
•Tibial Tray – Poly Contact
• Apply load through contact patch
– Use Constraints to mimic Tray
• Model Femoral & Tibial Tray as a rigid body
• Model the femoral and Tibial Tray component
Lower
Risk
Higher
Risk
Credibility Factors
Software Quality Assurance
Numerical Code Verification
Discretization Error
Numerical Solver Error
Use Error
Model Form
Model Input
Test Samples
Test Conditions
Equivalency of Input
Parameters
Output Comparison
Relevance of the Quantities of
Interest
Relevance of the Validation
Activities to the COU
Applicability
Activities
Verification
Code
Calculation
Validation
Computational
Model
Comparator
Assessment
• Computational modeling is extensively used throughout the total product life cycle.
– Not just to simulate testing, but also to “drive” test methods
• With advancement in computational technologies (both h/w and s/w), CM&S is expanding
to several “non-traditional” disciplines (MRI labeling, drop-testing, morphological analysis,
patient-specific modeling, etc.)
• Researchers are already working on developing tools for using modeling as a surrogate for
clinical studies (in silico patients) and innovative manufacturing processes, such as additive
manufacturing
• FDA guidance is already available for reporting computational modeling studies in the
regulatory submissions.
• After 6+ years of efforts involving multiple members from academia, FDA, and industry, a
V&V standard for using computer models in medical devices is expected to release in the
latter half of 2017.
– A similar guidance from FDA is in works as well
• Efforts are ongoing to expand these V&V efforts by involving regulatory bodies outside of
US (important because devices are made for global population)
Conclusions
THANK YOU!
marc.horner@ansys.com
mehul.dharia@zimmerbiomet.com
Leverage Computational Modeling and Simulation for Device Design - OMTEC 2017

Leverage Computational Modeling and Simulation for Device Design - OMTEC 2017

  • 2.
    14 June, 2017 LeveragingComputational Modeling and Simulation for Device Design Marc Horner, Ph.D. Technical Lead, Healthcare ANSYS, Inc. Mehul Dharia Principal Research Engineer Zimmer Biomet
  • 3.
    •This session willreview the following aspects of computational modeling and simulation (CM&S) as it relates to the total product lifecycle of orthopaedic products: –Review CM&S throughout the orthopaedic implant lifecycle –Overview of the regulatory direction regarding CM&S for device submissions –Examples of ways in which computer modeling transforms product development, including examples that demonstrate the contemporary regulatory framework –Opportunities and challenges in the use of computer models Takeaways
  • 4.
    4 Phases in theDesign Cycle • Conceptualization • Concept Development • Verification & Validation • Marketing Claims • Post-Market Evaluation
  • 5.
    5 Simulation in theDesign Cycle • Conceptualization – Anatomical fit • Verification & Validation – Strength (Performance) – Contact Mechanics (Wear) – Disassociation (Constraints, Locking mechanisms) – Stability (Fixation) – MRI, Packaging, etc. • Surgical Guidance – Optimal use of product • Marketing Claims – Comparison of designs (“selling” the Science) • Post-Market Evaluation – Evaluate unforeseen situations Implant heating during MRI Relationship between implant position and µ- motion Verma et al. Pre-ORS (2014)
  • 6.
  • 7.
    7 Addressing Regulatory Uncertainty Computationalmodeling was established as a center-level initiative by CDRH in 2011.
  • 8.
    • Leverage “BigData” for regulatory decision-making • Modernize biocompatibility and biological risk evaluation of device materials • Leverage real-world evidence and employ evidence synthesis across multiple domains in regulatory decision-making3 • Advance tests and methods for predicting and monitoring medical device clinical performance • Develop methods and tools to improve and streamline clinical trial design • Develop computational modeling technologies to support regulatory decision-making • Enhance the performance of Digital Health and medical device cybersecurity • Reduce healthcare associated infections by better understanding the effectiveness of antimicrobials, sterilization and reprocessing of medical devices • Collect and use patient input in regulatory decision-making • Leverage precision medicine and biomarkers for predicting medical device performance, disease diagnosis and progression 2017 Regulatory Science Priorities “Design for Clean” MDDTs
  • 9.
    9 Model Reporting * issuedSeptember 20, 2016 Summarizes information to be included in a CM&S Report Scope: •Fluid Mechanics and Mass Transport •Solid Mechanics •Electromagnetics and Optics •Ultrasound •Heat Transfer Report Sections: •Governing Equations • System Properties •System Conditions • System Discretization •Numerical Implementation • Validation
  • 11.
    11 Standards Committee – Provideprocedures for assessing and quantifying the accuracy and credibility of computational models and simulations. ASME V&V Standards Committee V&V in Computational Modeling and Simulation V&V 10 - Verification and Validation in Computational Solid Mechanics V&V 20 - Verification and Validation in Computational Fluid Dynamics and Heat Transfer V&V 30 - Verification and Validation in Computational Simulation of Nuclear System Thermal Fluids Behavior V&V 40 - Verification and Validation in Computational Modeling of Medical Devices V&V 50 - Verification and Validation of Computational Modeling for Advanced Manufacturing
  • 12.
    12 V&V 40 Charter –Provide procedures to standardize verification and validation for computational modeling of medical devices – Charter approved in January 2011 Motivating Factors – Regulated industry with limited ability to validate clinically – Increased emphasis on modeling to support device safety and/or efficacy – Use of modeling hindered by lack of V&V guidance and expectations within medical device community ASME V&V 40 Overview V&V in Computational Modeling and Simulation V&V 10 - Verification and Validation in Computational Solid Mechanics V&V 20 - Verification and Validation in Computational Fluid Dynamics and Heat Transfer V&V 30 - Verification and Validation in Computational Simulation of Nuclear System Thermal Fluids Behavior V&V 40 - Verification and Validation in Computational Modeling of Medical Devices V&V 50 - Verification and Validation of Computational Modeling for Advanced Manufacturing
  • 13.
    The V&V40 guideoutlines a process for making risk-informed determinations as to whether a computational model is credible for decision-making for a specified context of use. Risk-Informed Credibility Assessment Framework
  • 14.
    The question ofinterest describes the specific question, decision or concern that is being addressed. Context of use defines the specific role and scope of the computational model used to inform that decision. Question of Interest and Context of Use
  • 15.
    Model risk isthe possibility that the model may lead to a false/incorrect conclusion about device performance, resulting in adverse outcomes. - Model influence is the contribution of the computational model to the decision relative to other available evidence. - Decision consequence is the significance of an adverse outcome resulting from an incorrect decision. * Blood pump image courtesy Mark Goodin, SimuTech Group Risk Assessment
  • 16.
    Model credibility refersto the trust in the predictive capability of the computational model for the COU. Trust can be established through the collection of V&V evidence and by demonstrating the applicability of the V&V activities to support the use of the CM for the COU. Credibility Factors Verification Validation Applicability Code Solution Model Comparator Output Assessment SoftwareQuality Assurance NumericalAlgorithm Verification DiscretizationError UseError NumericalSolverError SystemConfiguration SystemProperties BoundaryConditions GoverningEquations SampleCharacterization ControlOverTestConditions MeasurementUncertainty Equivalencyofinputand outputtypes Rigorof OutputComparison Relevanceofthe QuantitiesofInterest Applicabilityto theContextofUse Credibility Assessment
  • 17.
  • 18.
    The Path Forward Assessing ComputationalModel Credibility through Verification and Validation: Application to Medical Devices currently in DRAFT form “Develop computational modeling technologies to support regulatory decision-making” Hierarchical ValidationofCM&S
  • 19.
  • 20.
    20 Conceptualization Anatomical Fit • “Betterconform to anatomy” → “Better clinical outcomes” • ZiBRA*: – Morphological Analysis – Statistical Shape Analyses – Automated Landmark Detection & Virtual Surgery – Component Placement Optimization – Implant Fit Assessment • Extensive digital anatomic library – Captures ethnic and gender variation across the global population – Caucasian / African American / European / Indian / Chinese / Japanese / Korean Zimmer Biomet Internal Software
  • 21.
    21 Anatomical Fit Tibial Baseplate •Compromise Between – Proper Rotation (kinematics) – Minimum Overhang (impingement) – Optimal Coverage (stability) • Subtle shape differences between ethnicities and genders Dai et al, J Ortho Res 31; 2013
  • 22.
    22 Anatomical Fit Tibial Baseplate optimizesthe “compromise” between kinematics, impingement and fixation aspects Zimmer Biomet Persona Tibial Baseplate • One design for the global population
  • 23.
  • 24.
    24 Strength Testing Based onStandard TKA Tibial Baseplate THA Stem • What if a Standard is not specific enough? ASTM F1800-12 ISO 7206-4
  • 25.
    25 Total Ankle Replacement StrengthTesting •Standard provides guidance – Does not provide specifics for strength testing •Method – Develop biomechanical loading rationale – Input to Simulation – Determine worst case condition from simulation – Develop test Trabecular Metal (TM) Trabecular Metal (TM) Talar Component Tibial Tray HXPE Zimmer Biomet Trabecular Metal Total Ankle Dharia et al, World Congress of Biomechanics, 2014 Talus Tibia
  • 26.
    26 Biomechanical Input Forces &Kinematics • Joint Forces Axial Compressive Load •Flexion/Extension Internal/External Rotation •Anterior/Posterior Translation – obtained from Bell et al., 1997 Seireg & Arvikar, J Biomech, 1975 Procter, J Biomech, 1982 Anderson et al, J Biomech, 2001 Stauffer et al, Clin Orthop Rel Res, 1977 Lamoreux , Bull Prosthet Res, 1971 Bahr et al, Knee Surg, 1998 Singer et al, JBJS, 2013 Stauffer et al, Clin Orthop Rel Res, 1977
  • 27.
    27 Biomechanical Input Load andMotion Curves • Combined Loading Dharia et al, Ortho. Research Society, 2013
  • 28.
    28 Physiological Model Tibia &Talus Dharia et al, Ortho. Research Society, 2013 Model Tibia Model Talus Model
  • 29.
    29 Tibial Insert Stress Results IndividualComponents Dharia et al, World Congress of Biomechanics, 2014 Tibial Baseplate 41% 45% Talus Component
  • 30.
    30 Fatigue Test Physiologically MotivatedInputs • Test Orientations – 41% & 45% Gait Positions for Tibia & Talus assemblies – Apply axial load – 10 Mc test Dharia et al, World Congress of Biomechanics, 2014 Tibia Talus
  • 31.
    31 Foot Physiologically Motivated Inputs?? • Hallux Valgus – Open Wedge Osteotomies • Osteotomy Cut, Open Wedge • Place Spacer/Implant(s) • Loading?? www.arthrex.com Defect Correction
  • 32.
    32 Musculoskeletal Model Loading through1st Metatarsal • Kinematic Foot Model – 26 segments (bones) – Contains bones, muscles, ligaments, joints – 75 Forces through 1st Metatarsal Al-Munnajed et al, J Biomech Eng., March 2016, Vol. 138 Y Z X Ligaments Muscles Dharia et al, BMES/FDA Frontiers in Medical Device, 2016
  • 33.
    33 Patient & SurgicalVariability Surgical Guidance • 5 Osteotomy Planes – Defined using the ZiBRATM Anatomical Modeling System* •Neutral (N): perpendicular to long axis •5° in abduction (AB) •5° in adduction (AD) •5° in dorsiflexion (DF) •5° in plantar-flexion (PF) Dharia et al, BMES/FDA Frontiers in Medical Device, 2016 *Bischoff et al., ASME/FDA Frontiers in Medical Devices, 2013 Compressive Force Flexion/Extension Moment
  • 34.
    34 Proximal Tibial LockingPlate Optimal Screw Configurations • Potential Screw Configurations – Models A & D has hole 6 unsecured Dharia et al., Orthopaedic Research Society, 2006
  • 35.
    35 Optimal Screw Configurations SurgicalGuidance • Maximum Principal Stress – Peak stress at unsecured hole 6 in Models A & D. Dharia et al., Orthopaedic Research Society, 2006
  • 36.
  • 37.
    37 Contact Mechanics Contact Area& Pressure (CAREA/CPRESS) • Edge Loading – Cause •Deformity, V/V Malalignment, Congruency – Effect – Point or edge loading on polyethylene – Increased wear – Catastrophic failure Easley, JBJS Am 2011;93:1455-1468 Espinosa, JBJS Am 2010 Laflamme, AOFAS 2012Assal, F&A Intl 2003
  • 38.
    38 Test Setup ASTM F2665-09 – Contact Area and Contact Pressure should be determined at various flexion angles • 0°, ±10°, ±15° tibiotalar flexion angles •800 N load AP View ML View Dharia et al, World Congress of Biomechanics, 2014
  • 39.
    39 Results CAREA/CPRESS • Mean ContactArea • Contact Pressure - Comparison to Predicate Contact Area Contact Pressure New Design Predicate Design Dharia et al, World Congress of Biomechanics, 2014
  • 40.
    40 How are theseResults Relevant? CAREA/CPRESS – Does not represent physiological condition - tested at constant 800N load. – All the load and motion profiles (IE, AP, Axial loads etc.) are not captured at the tested flexion angles. – The known worst case gait position (41%) is not tested. – Simulation can provide better insights. Contact Area Contact Pressure Dharia et al, World Congress of Biomechanics, 2014
  • 41.
    41 CAREA/CPRESS Comparison Neutral Implantation •Comparison to Predicates – Fixed Bearing and Mobile Bearing Fixed Bearing Predicate Mobile Bearing Predicate Dharia et al, American Orthopaedic Foot & Ankle Soc., 2011 Dharia et al, American Orthopaedic Foot & Ankle Soc., 2013
  • 42.
  • 43.
    43 Micromotion Reverse Shoulder Arthroplasty •Stability predictions in RSA Zimmer Biomet Comprehensive Reverse Shoulder System Subsidence Lift-off Normalized Micromotion Dharia et al, Intl Society of Technology & Arthroplasty, 2016
  • 44.
    44 Total Ankle Replacement ClinicalOutcomes • Low Survivability – 78% to 95% @ 5 years – Revision rate >double of THA, TKA •High Revision Rates (loosening) – 26% (Australian Registry, 2013) – 48% (New Zealand Registry, 2013) – 50% (Swedish Registry, 2013) – 68% (Daniels et al., 2014) • Design Features Affecting Loosening – Fixation features (Keel etc.) – Fixation Approach (cemented, cementless) – Bony Support Bonnin et al., 2004; Henricson et al, 2007; Hosman et al., 2007 Labek et al., 2011 Bischoff et al., Orthopaedic Research Society, 2016
  • 45.
    45 Bony Support Flat vsAnatomical Cut • Assumption: ↑Bony Support, ↑Stability, ↑Load Transfer • Hypothesis: Anatomical Cut → ↑Bony Support – ↑Bony Density (HU); ↑Surface Area (SA) •CT Data: ~0.5mm slice thickness Brigido and DiDomenica, 2016 Source Ethnicity Talus count Tibia count Matched pairs Total cohort Caucasian, Korean, Japanese, Indian N=52 34M / 18F N=81 56M / 25F N=30 23M / 7F Bischoff et al., Orthopaedic Research Society, 2016
  • 46.
    46 Bony Support Method • Tibia •Talus •Output – Normalized HU (Density) – Normalized SA (surface area) – Normalized Bony Support (HU*SA) Articulation axis 2mm depth 4mm depth 6mm depth Resection depth defined based on high point of talar dome Resection depth defined based on distal center of tibia 6mm depth 4mm depth 2mm depth Anatomic HU↑ HU ↓FlatFlat Bischoff et al., Orthopaedic Research Society, 2016
  • 47.
    47 Bony Support Results Observations: 1.Boney supportis statistically significantly increased for anatomic cuts relative to flat cuts at all cut depths, for tibia and talus 2.Depth of cut most significantly influences boney support for flat cuts of talus (~90% increase from 2-6mm), attributed to increased SA with depth Tibia Talus Bischoff et al., Orthopaedic Research Society, 2016
  • 48.
  • 49.
    49 Background Tibial Tray AnteriorLiftoff •Locking Mechanism strength – Disassociation of Tibial Component from Tibial Tray – Measure Tibial Component Lift-off distance •Question of Interest – Does the locking mechanism of a posterior-stabilized TKA design have sufficient strength to withstand posteriorly directed loads? Zimmer Biomet TKA
  • 50.
    50 Tibial Tray AnteriorLiftoff Scope • 2 Tray Sizes – Small & Medium • Model & Experiment • Output Comparison – Rank Order & Absolute Values Rail Height Anterior Rail Rail Height Tibial Tray Tibial Spine 3° Posterior Slope Articular Surface Dharia et al, ASME Verification & Validation Symposium, 2014
  • 51.
    51 Tibial Tray AnteriorLiftoff Model & Experiment • Model Experiment Load on anterior tibial spine Dharia et al, ASME Verification & Validation Symposium, 2014
  • 52.
    52 Tibial Tray AnteriorLiftoff Results • The ratio (Medium/small) of predicted versus measured load compared within 2.2%. – Model is validated for Rank Ordering sizes • Model vs Exp Absolute Values – 1.5% for medium – 3.5% for small – Model is validated to use in lieu of testing • Submit 510(k) of new (similar) design – Outcome? Size Measured Force (N) Predicted Force (N) % difference Medium Average 744.1 733 1.5% Small Average 426.6 412 3.5% Ratio, medium/small 1.74 1.78 2.2% Dharia et al, ASME Verification & Validation Symposium, 2014 ModelExperiment
  • 53.
    53 Tibial Tray AnteriorLiftoff V&V 40 Approach • How Good is Good Enough? – Depends on COU – Risk informed credibility requirement • What is the Decision Consequence? • What is the Model Influence? – What additional information is available? • Predicate device • Testing on predicate device and/or new device – Plan V&V activities accordingly • Computer Model & Comparator (e.g. Experiment)
  • 54.
    54 Context Of Use(COU) Tibial Tray Anterior Liftoff •Differentiation – Based on additional information available (outside of model) •Predicate device, Benchtop Testing • COU1, Performance evaluation without testing: The tibial component anterior liftoff is evaluated exclusively using the computational model. • COU2, Performance evaluation with testing: The model is used to predict the worst-case size across the proposed product portfolio in terms of tibial component anterior liftoff, and this worst case is then physically tested. • COU3, Superiority evaluation without testing: The model is used to predict the tibial component anterior liftoff across all sizes in the proposed product portfolio, with no associated benchtop testing. Results are benchmarked against similar modeling results from a successful predicate device. No Predicate Device Predicate Device None COU1 COU3 Worst Case COU2 COU4 (a,b) Matrix of Proposed COUs Existence of Predicate Device Benchtop Testing
  • 55.
    55 Context Of Use(COU) Tibial Tray Anterior Liftoff • COU4, Superiority evaluation with testing: Model predictions of tibial component anterior liftoff are supported by benchtop testing, and evaluation of the proposed product portfolio is benchmarked against that of a predicate device. – This may occur in multiple ways. No Predicate Device Predicate Device None COU1 COU3 Worst Case COU2 COU4 (a,b) Matrix of Proposed COUs Existence of Predicate Device Benchtop Testing
  • 56.
    56 Context Of Use(COU) Examples • COU1: Tibial component liftoff is evaluated exclusively using the computational model. No predicate device exists to compare with the computed results. No bench testing will be performed for this device. • COU2: A worst case size of a new design family will be determined for tibial component liftoff using computational model, which will then be tested in laboratory to ensure that it meets functional requirements. No predicate device exists. • COU3: Tibial component liftoff of new device and a predicate device is evaluated using the computational model. No bench testing will be performed. • COU4a: A worst case size of a new design family will be determined for tibial component liftoff using computational model, which will then be tested in laboratory to compare with test results of a predicate device. • COU4b: A worst case size for a new and a predicate design will be determined for tibial component liftoff using computational model. The worst design will then be tested in laboratory to ensure that it meets functional requirements. No Predicate Device Predicate Device None COU1 COU3 Worst Case COU2 COU4 (a,b) Matrix of Proposed COUs Existence of Predicate Device Benchtop Testing
  • 57.
    57 Model Risk •Decision Consequence –Revision Surgery • Independent of model •Model Influence – LOW: Results from the model are a negligible factor in the decision associated with the question being answered. (COU4) – HIGH: Results from the model are the primary factor in the decision associated with the question being answered (COU1) Lower Higher COU1 COU1 COU1-4 COU4 COU4
  • 58.
    58 V&V Activities Credibility Factors •Twomodeling assumptions – Polyethylene Material – Component Size & Locking Region Geometry Credibility Factors Software Quality Assurance Numerical Code Verification Discretization Error* Numerical Solver Error Use Error Model Form Model Input Test Samples Test Conditions Equivalency of Input Parameters Output Comparison* Relevance of the Quantities of Interest * Relevance of the Validation Activities to the COU* Applicability Activities Verification Code Calculation Validation Computational Model Comparator Assessment
  • 59.
    59 V&V Activities Model Validation– Model Form •Constitutive polyethylene material model – Several material models available in literature – How does selected material model impacts model predictions • May not justify further quantification • May have to try one or more material models to: – Quantify impact on predictions – Increase confidence that decision related to COU is not impacted by material model selection Lower Risk Higher Risk Credibility Factors Software Quality Assurance Numerical Code Verification Discretization Error Numerical Solver Error Use Error Model Form Model Input Test Samples Test Conditions Equivalency of Input Parameters Output Comparison Relevance of the Quantities of Interest Relevance of the Validation Activities to the COU Applicability Activities Verification Code Calculation Validation Computational Model Comparator Assessment
  • 60.
    60 V&V Activities Model Validation– Model Input System Configuration •Component Size •Variation in Locking Region Geometry – Sensitivity Analyses on Tolerance in individual component size • Nominal dimensions • LMC, MMC • LMC, MMC – Both Tibial Component and Tbial Tray – All component sizes Lower Risk Higher Risk Credibility Factors Software Quality Assurance Numerical Code Verification Discretization Error Numerical Solver Error Use Error Model Form Model Input Test Samples Test Conditions Equivalency of Input Parameters Output Comparison Relevance of the Quantities of Interest Relevance of the Validation Activities to the COU Applicability Activities Verification Code Calculation Validation Computational Model Comparator Assessment
  • 61.
    61 V&V Activities Model Validation– Model Input System Conditions •Insertion of Poly Tibial into Metal Tray • No Interference Fit • Interference Fit to capture residual stress • May have to model the insertion process Quantify the sensitivity of the modeling assumptions on modeling predictions Lower Risk Higher Risk Credibility Factors Software Quality Assurance Numerical Code Verification Discretization Error Numerical Solver Error Use Error Model Form Model Input Test Samples Test Conditions Equivalency of Input Parameters Output Comparison Relevance of the Quantities of Interest Relevance of the Validation Activities to the COU Applicability Activities Verification Code Calculation Validation Computational Model Comparator Assessment
  • 62.
    62 V&V Activities Comparator Validation– Test Samples •Quantification of locking region geometry • Use production parts • Inspect key parameters – Understand which tolerance band is tested • Specifically produce parts – At targeted dimension within tolerance band Lower Risk Higher Risk Credibility Factors Software Quality Assurance Numerical Code Verification Discretization Error Numerical Solver Error Use Error Model Form Model Input Test Samples Test Conditions Equivalency of Input Parameters Output Comparison Relevance of the Quantities of Interest Relevance of the Validation Activities to the COU Applicability Activities Verification Code Calculation Validation Computational Model Comparator Assessment
  • 63.
    63 V&V Activities Validation Assessment– Equivalency of Input Parameters •Tibiofemoral Contact •Tibial Tray – Poly Contact • Apply load through contact patch – Use Constraints to mimic Tray • Model Femoral & Tibial Tray as a rigid body • Model the femoral and Tibial Tray component Lower Risk Higher Risk Credibility Factors Software Quality Assurance Numerical Code Verification Discretization Error Numerical Solver Error Use Error Model Form Model Input Test Samples Test Conditions Equivalency of Input Parameters Output Comparison Relevance of the Quantities of Interest Relevance of the Validation Activities to the COU Applicability Activities Verification Code Calculation Validation Computational Model Comparator Assessment
  • 64.
    • Computational modelingis extensively used throughout the total product life cycle. – Not just to simulate testing, but also to “drive” test methods • With advancement in computational technologies (both h/w and s/w), CM&S is expanding to several “non-traditional” disciplines (MRI labeling, drop-testing, morphological analysis, patient-specific modeling, etc.) • Researchers are already working on developing tools for using modeling as a surrogate for clinical studies (in silico patients) and innovative manufacturing processes, such as additive manufacturing • FDA guidance is already available for reporting computational modeling studies in the regulatory submissions. • After 6+ years of efforts involving multiple members from academia, FDA, and industry, a V&V standard for using computer models in medical devices is expected to release in the latter half of 2017. – A similar guidance from FDA is in works as well • Efforts are ongoing to expand these V&V efforts by involving regulatory bodies outside of US (important because devices are made for global population) Conclusions
  • 65.