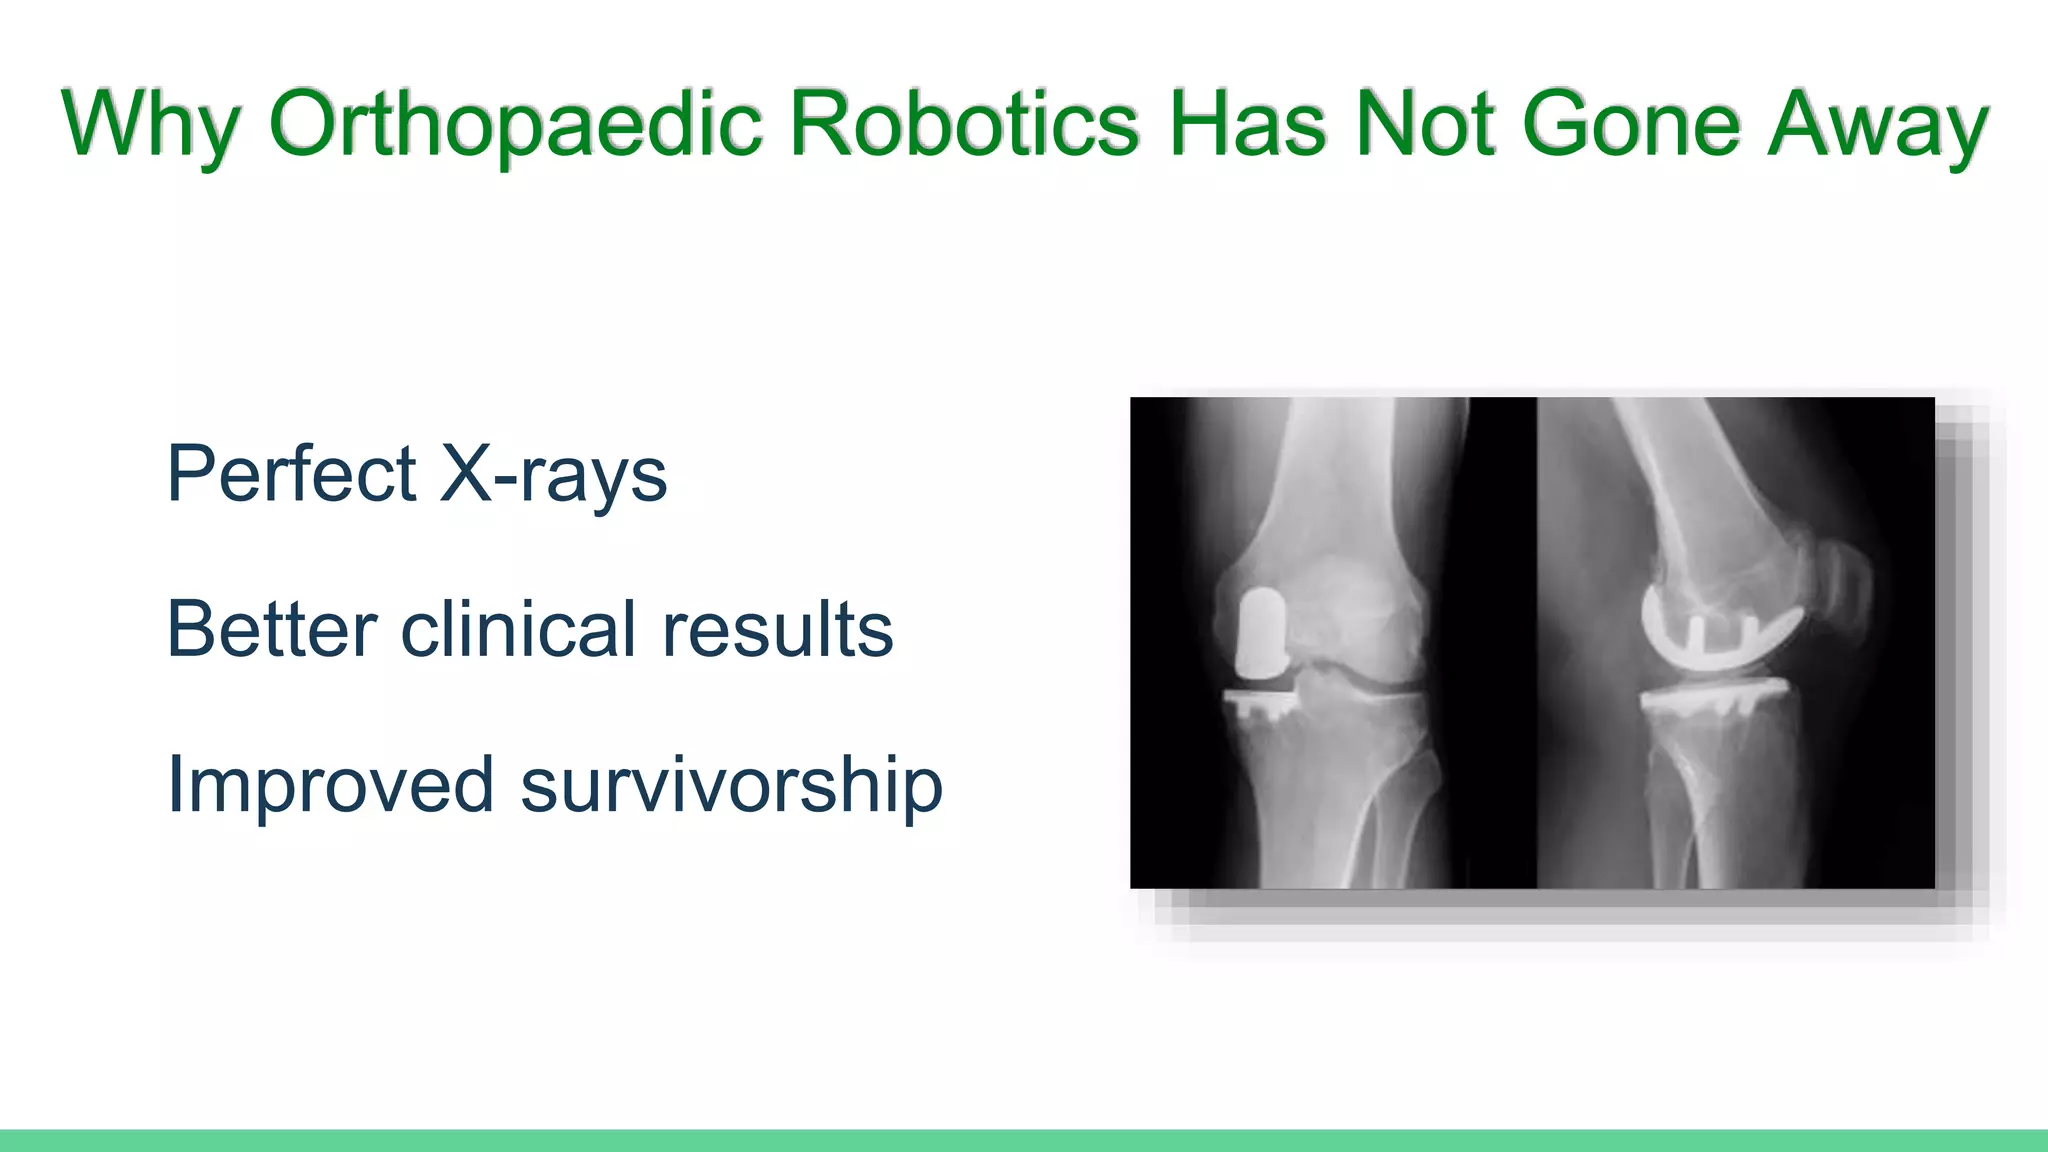
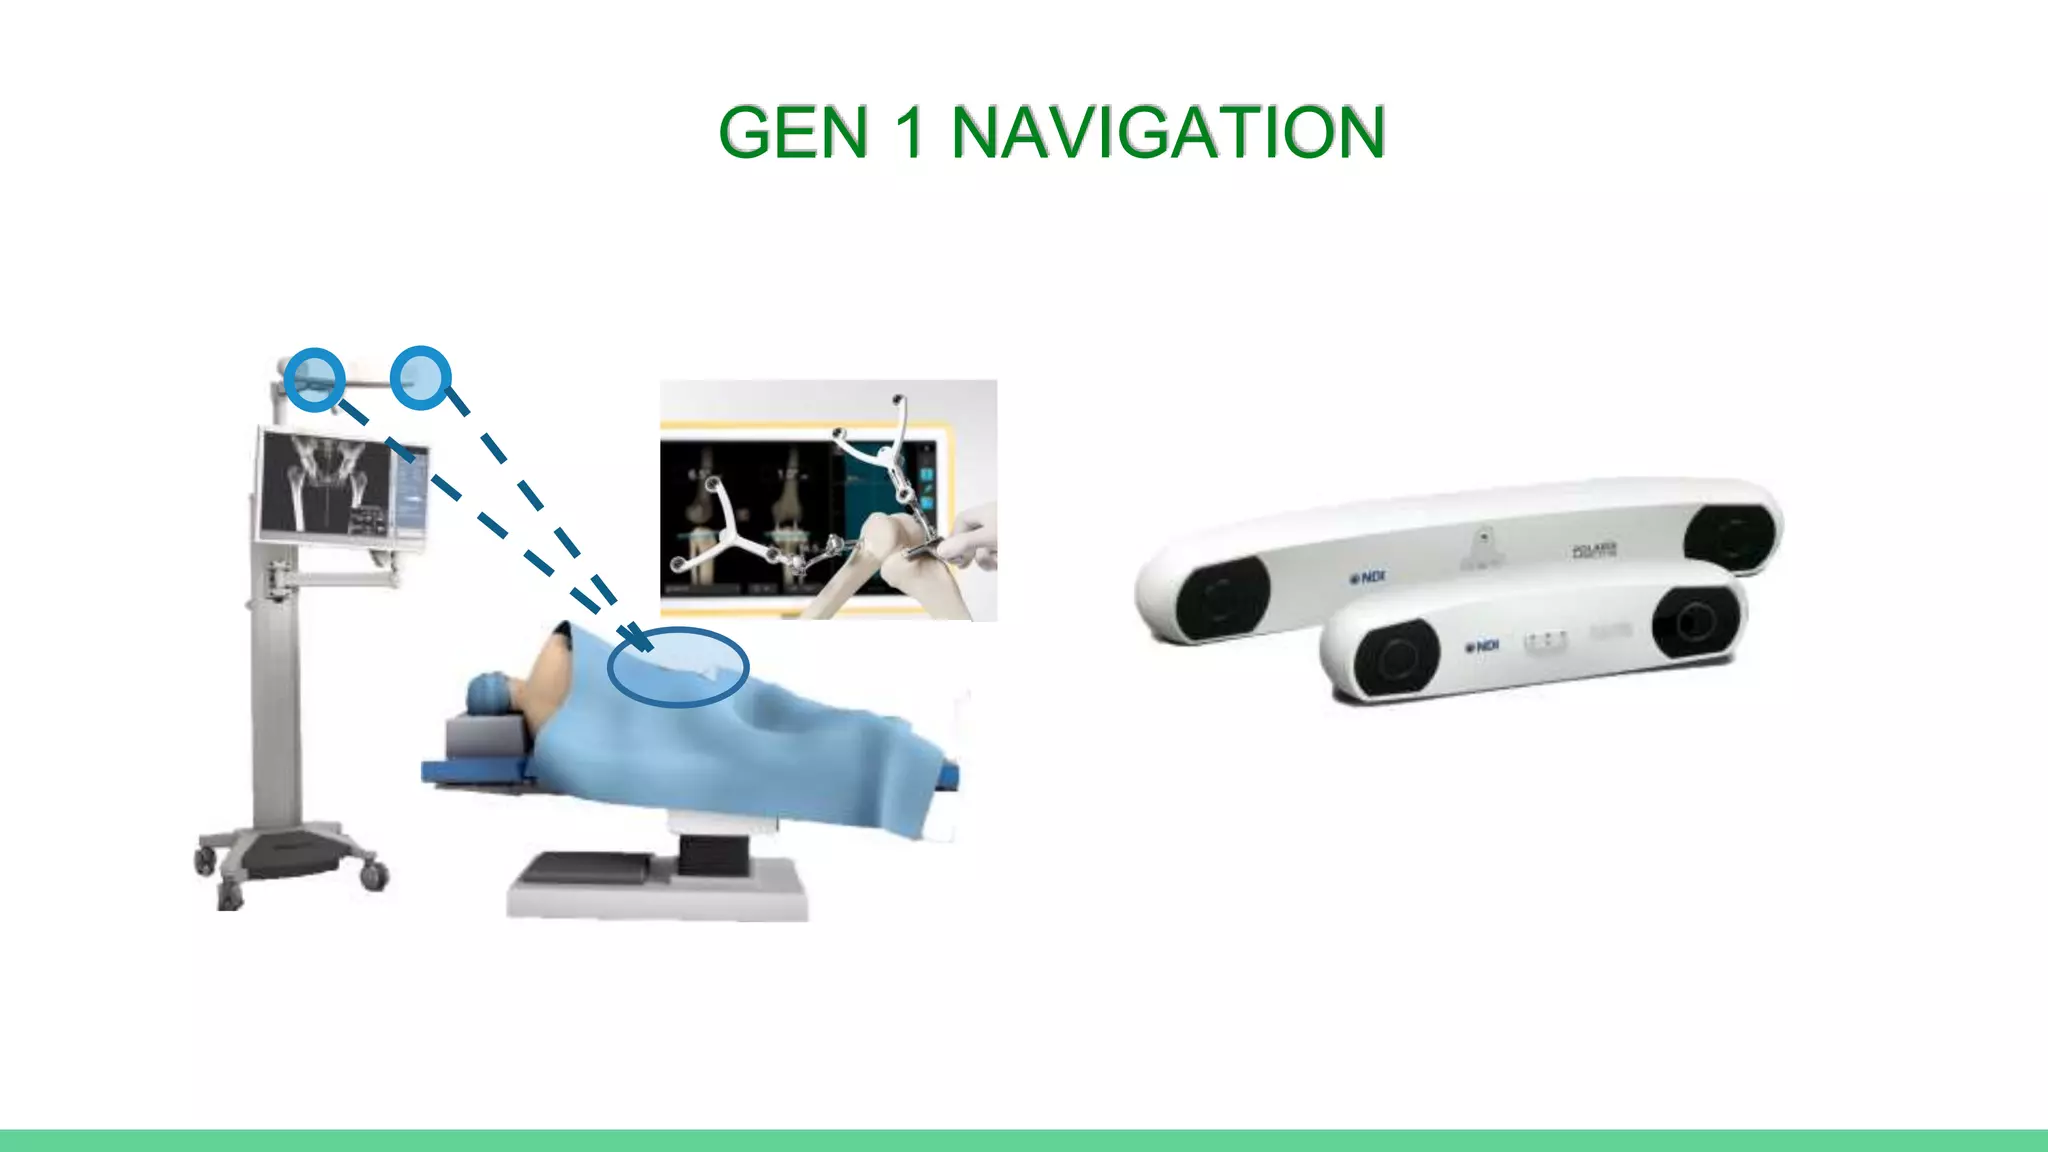
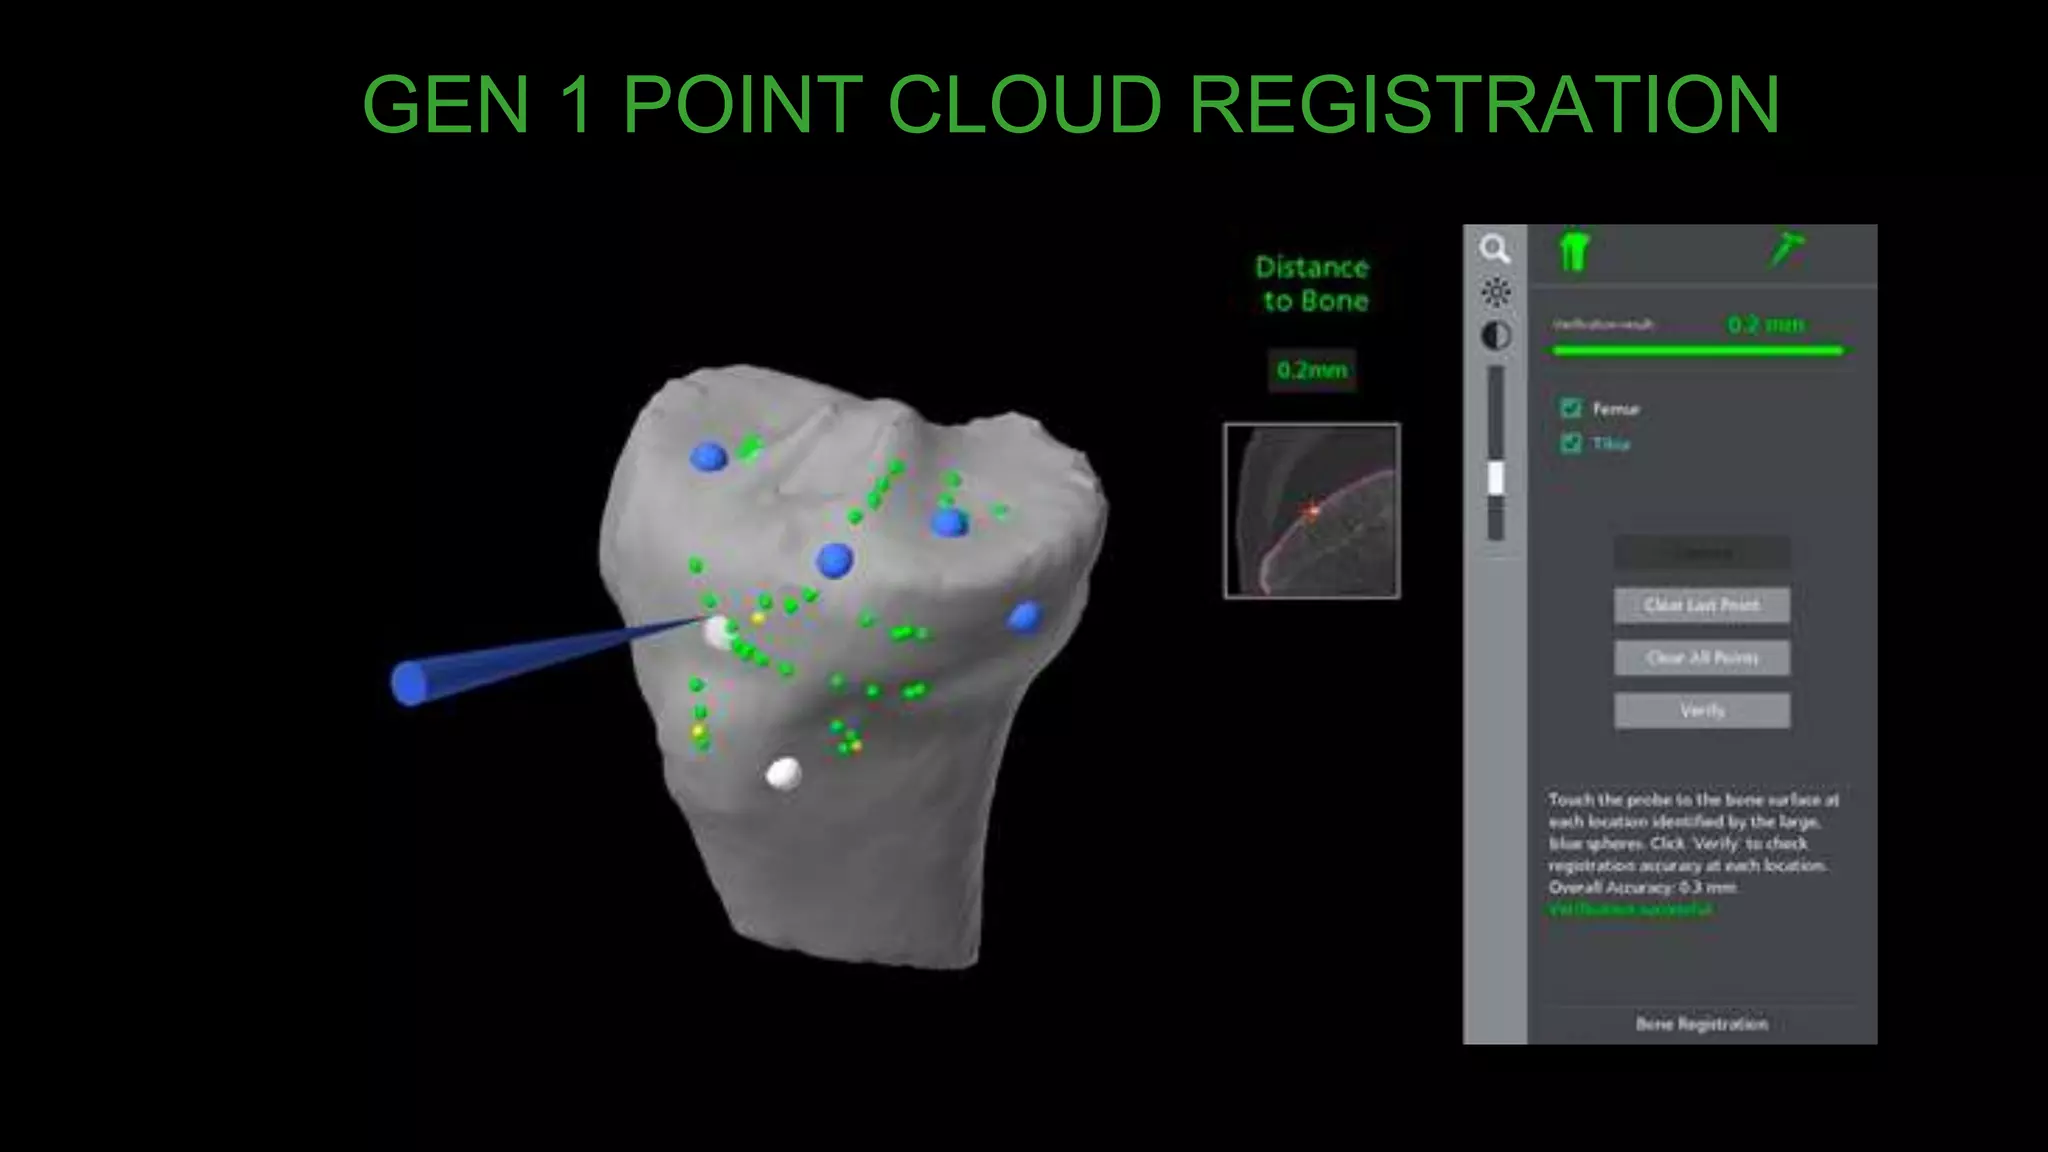
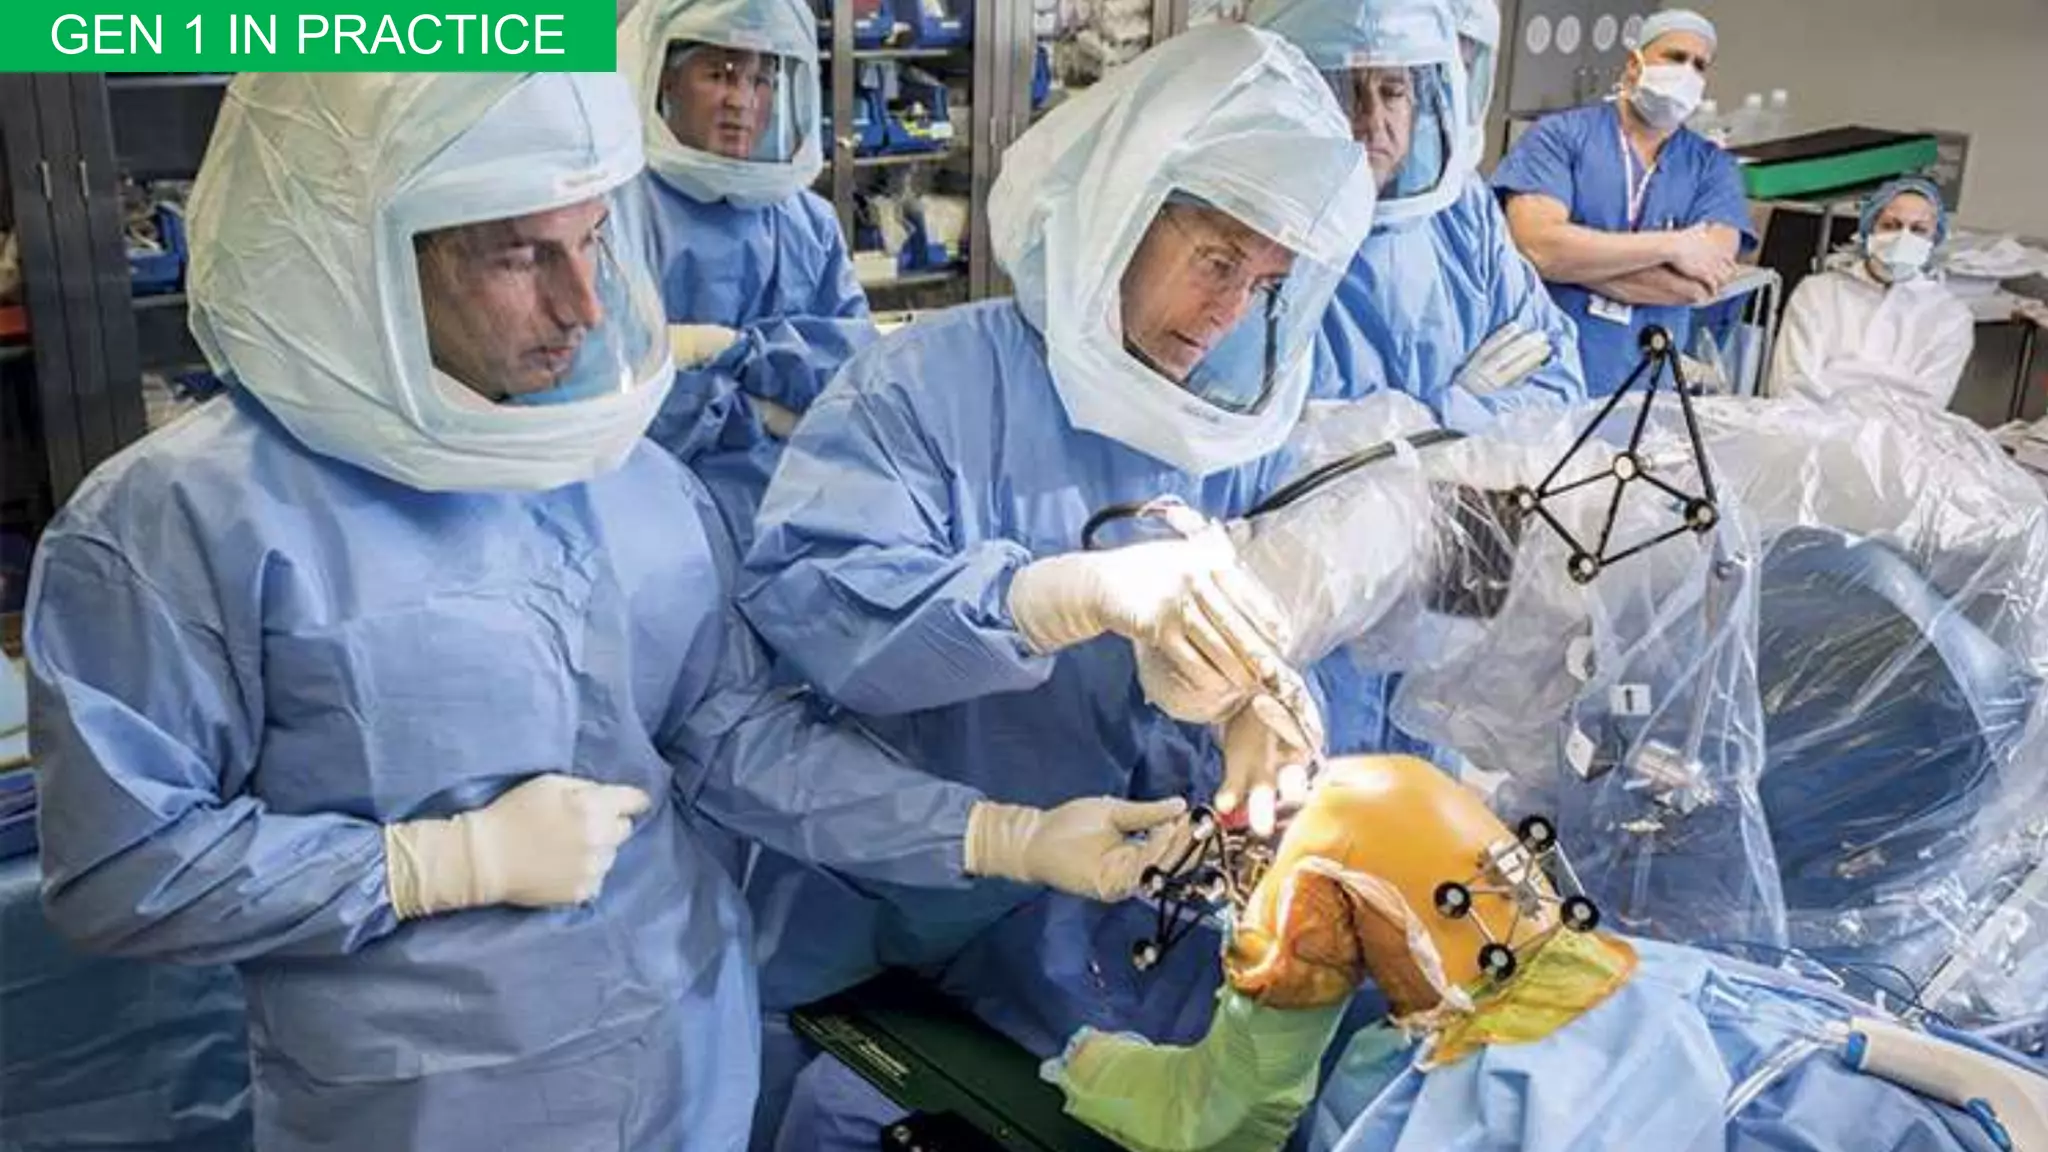
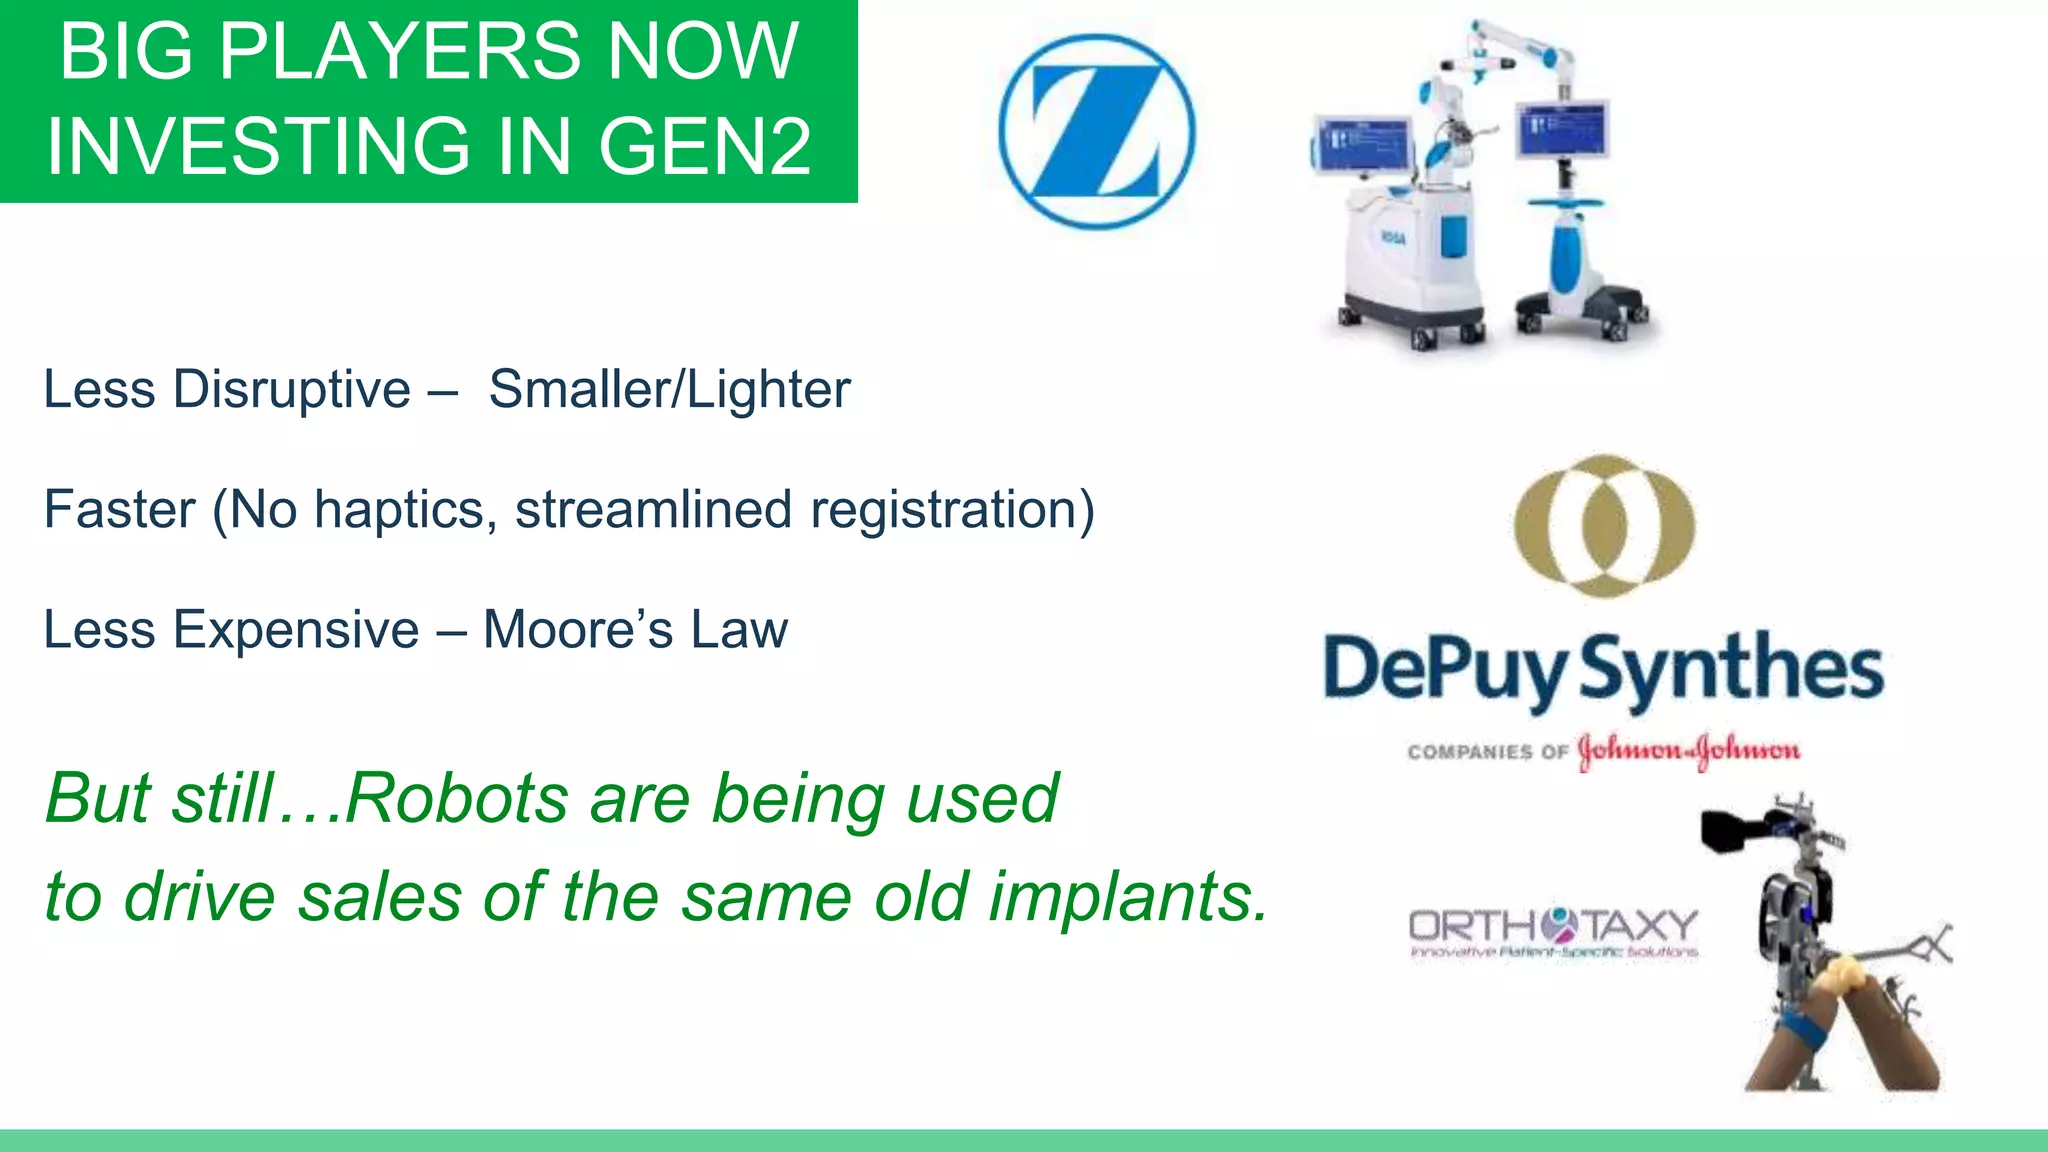
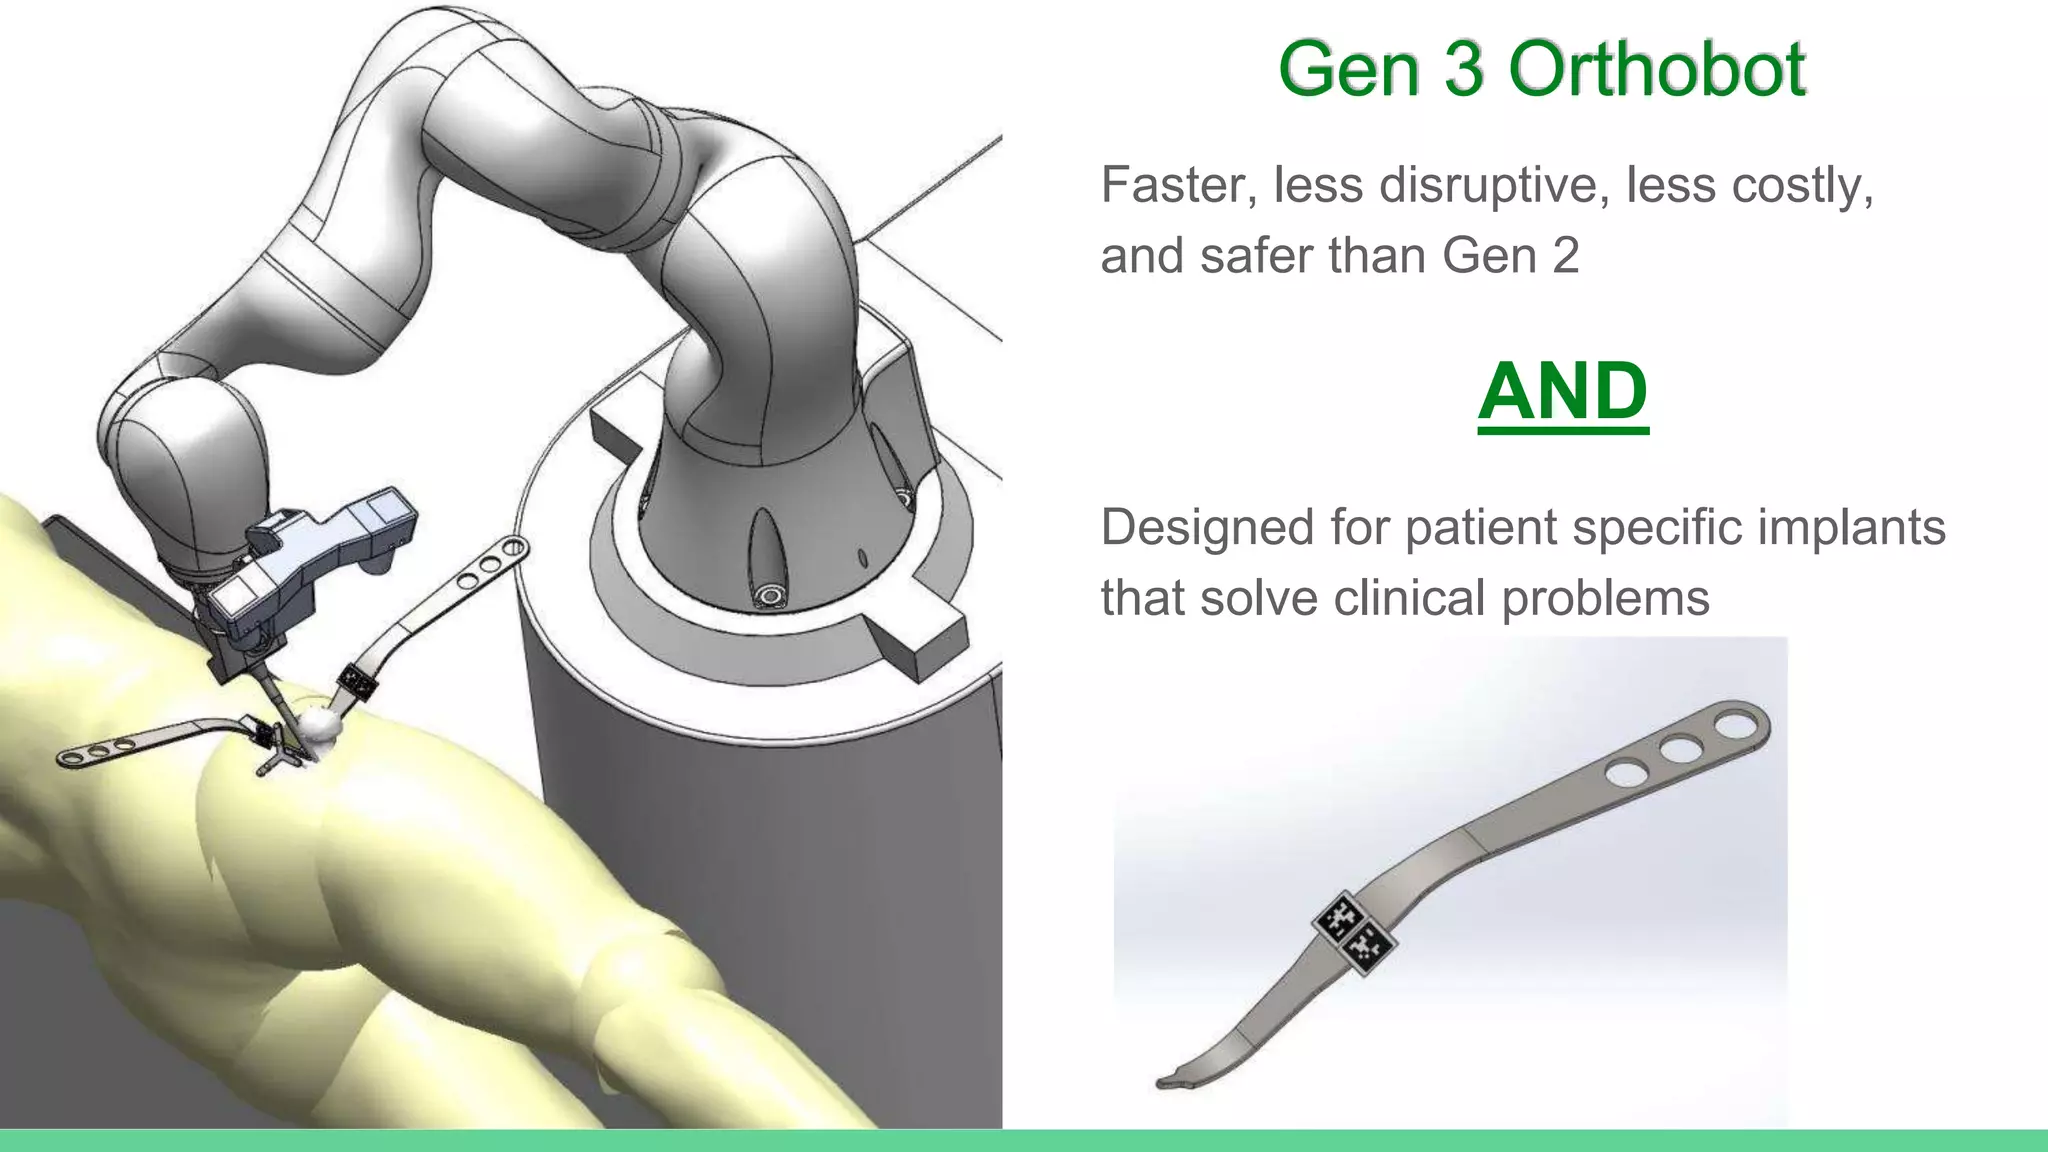
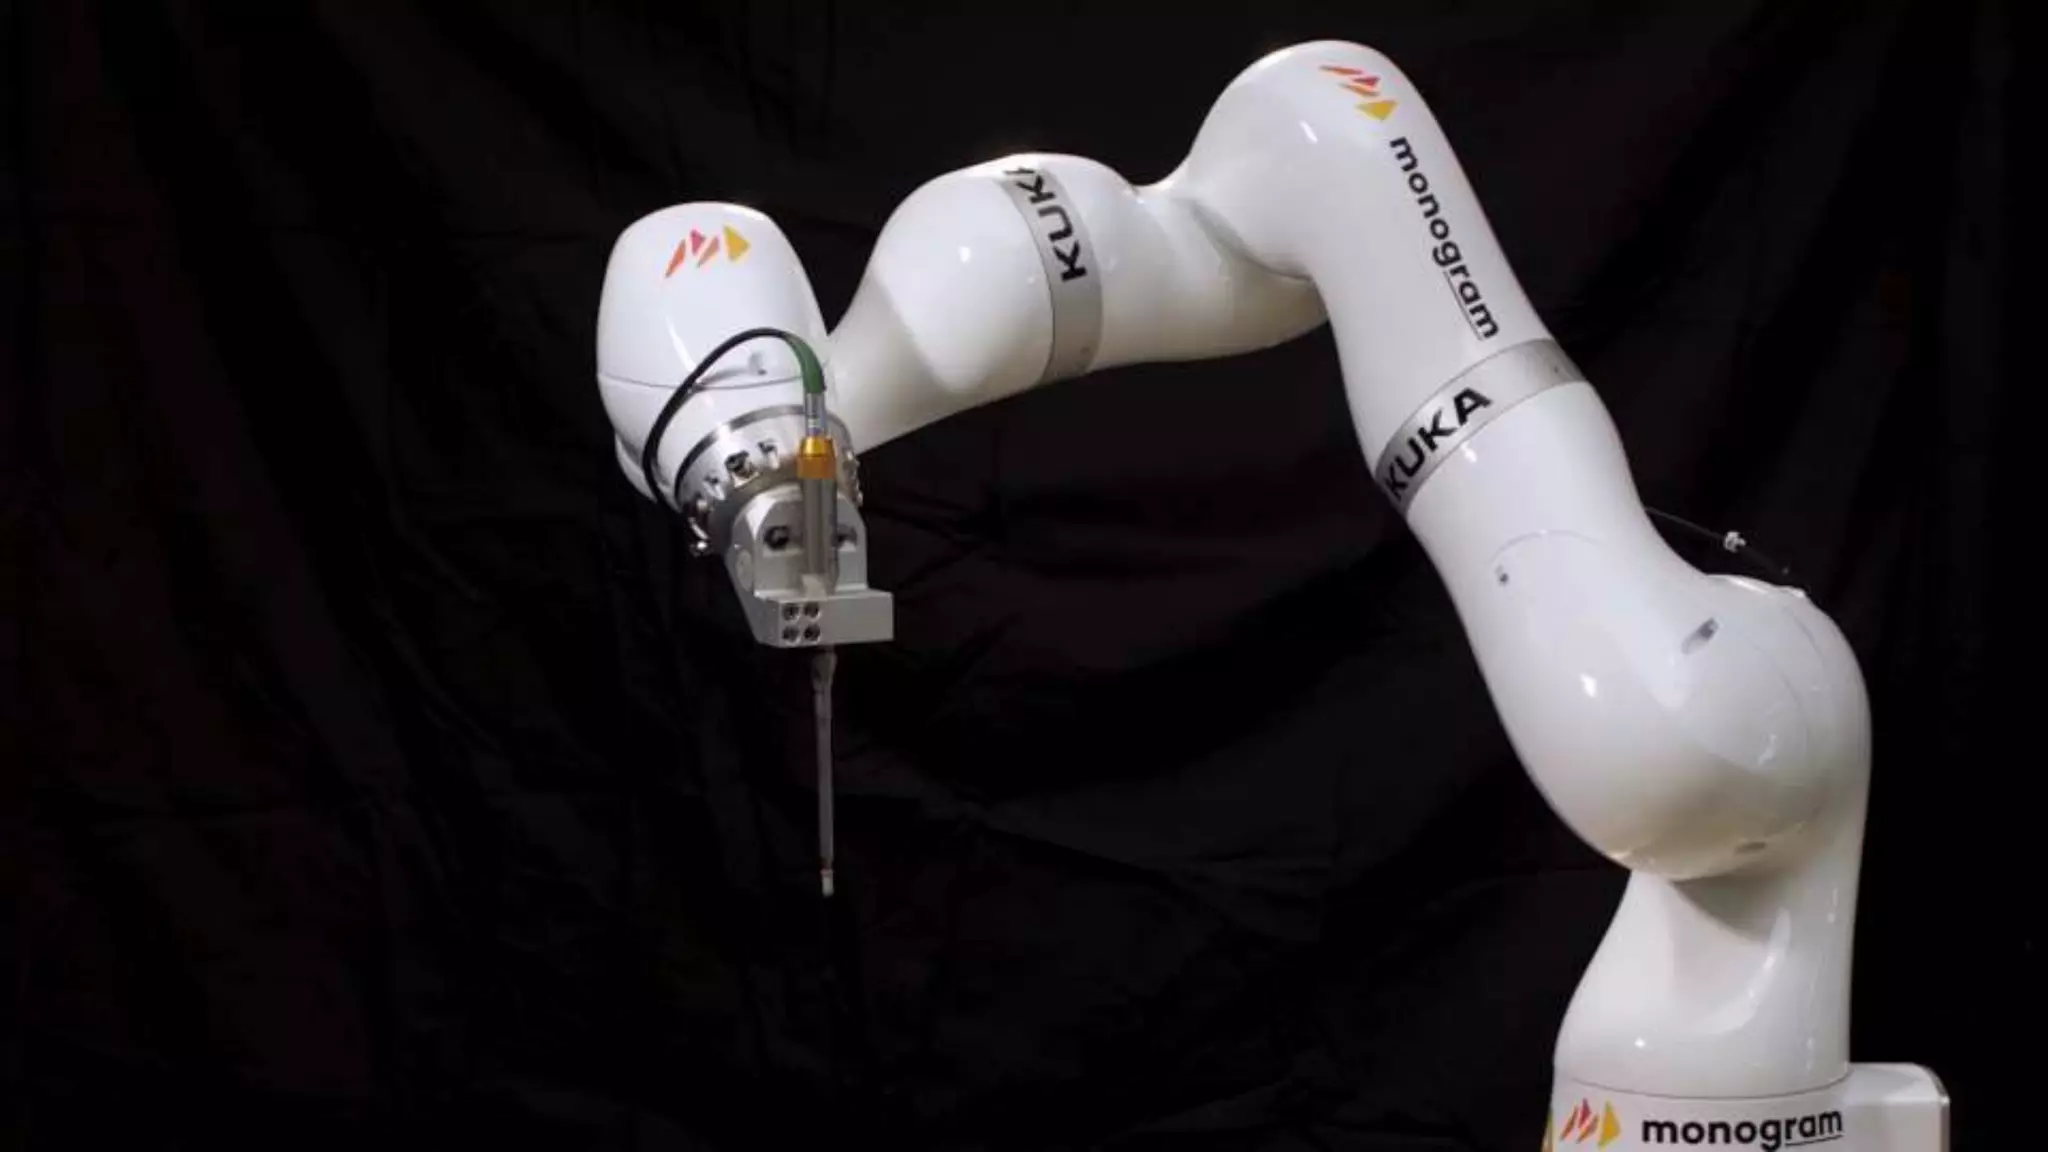
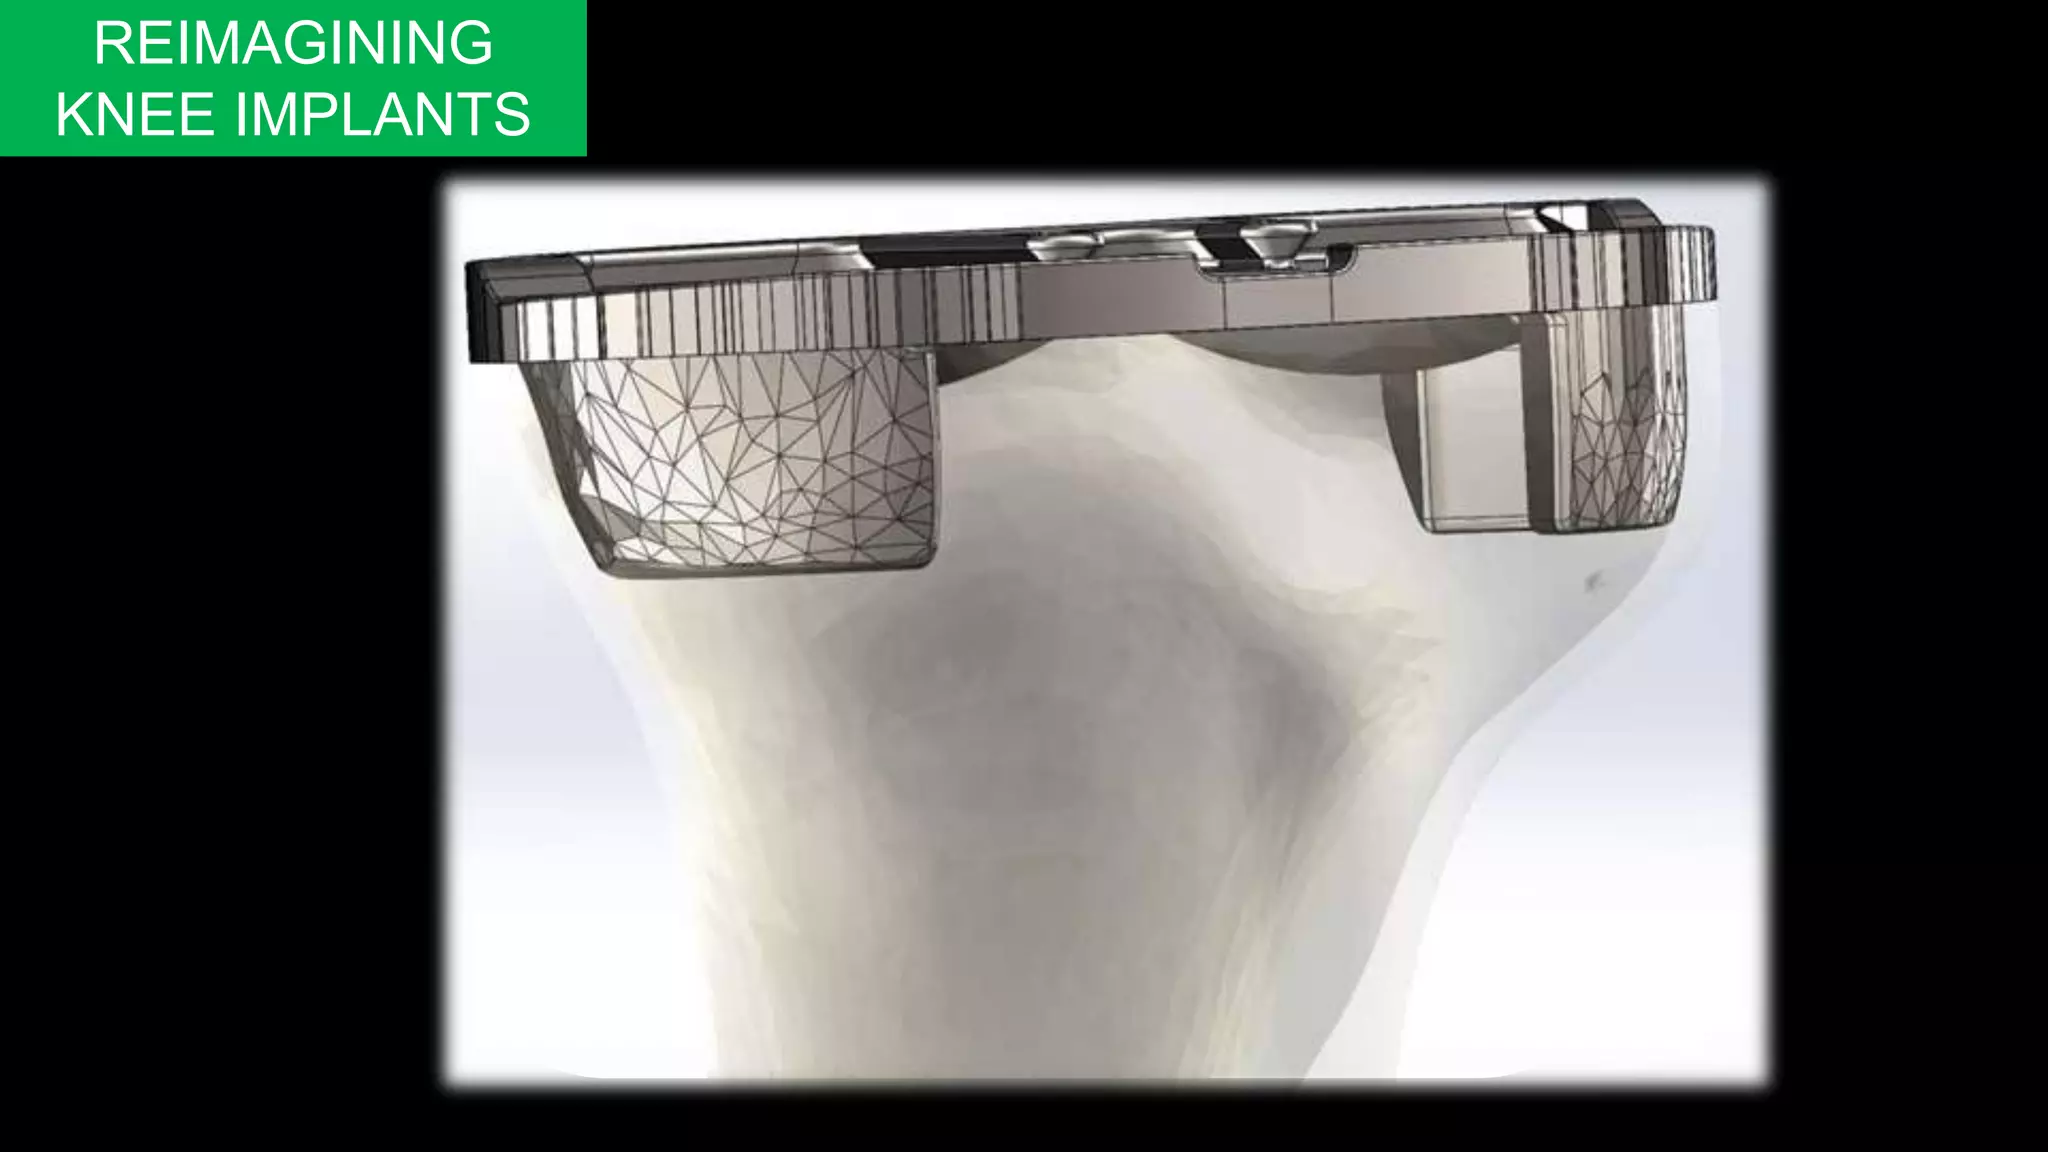
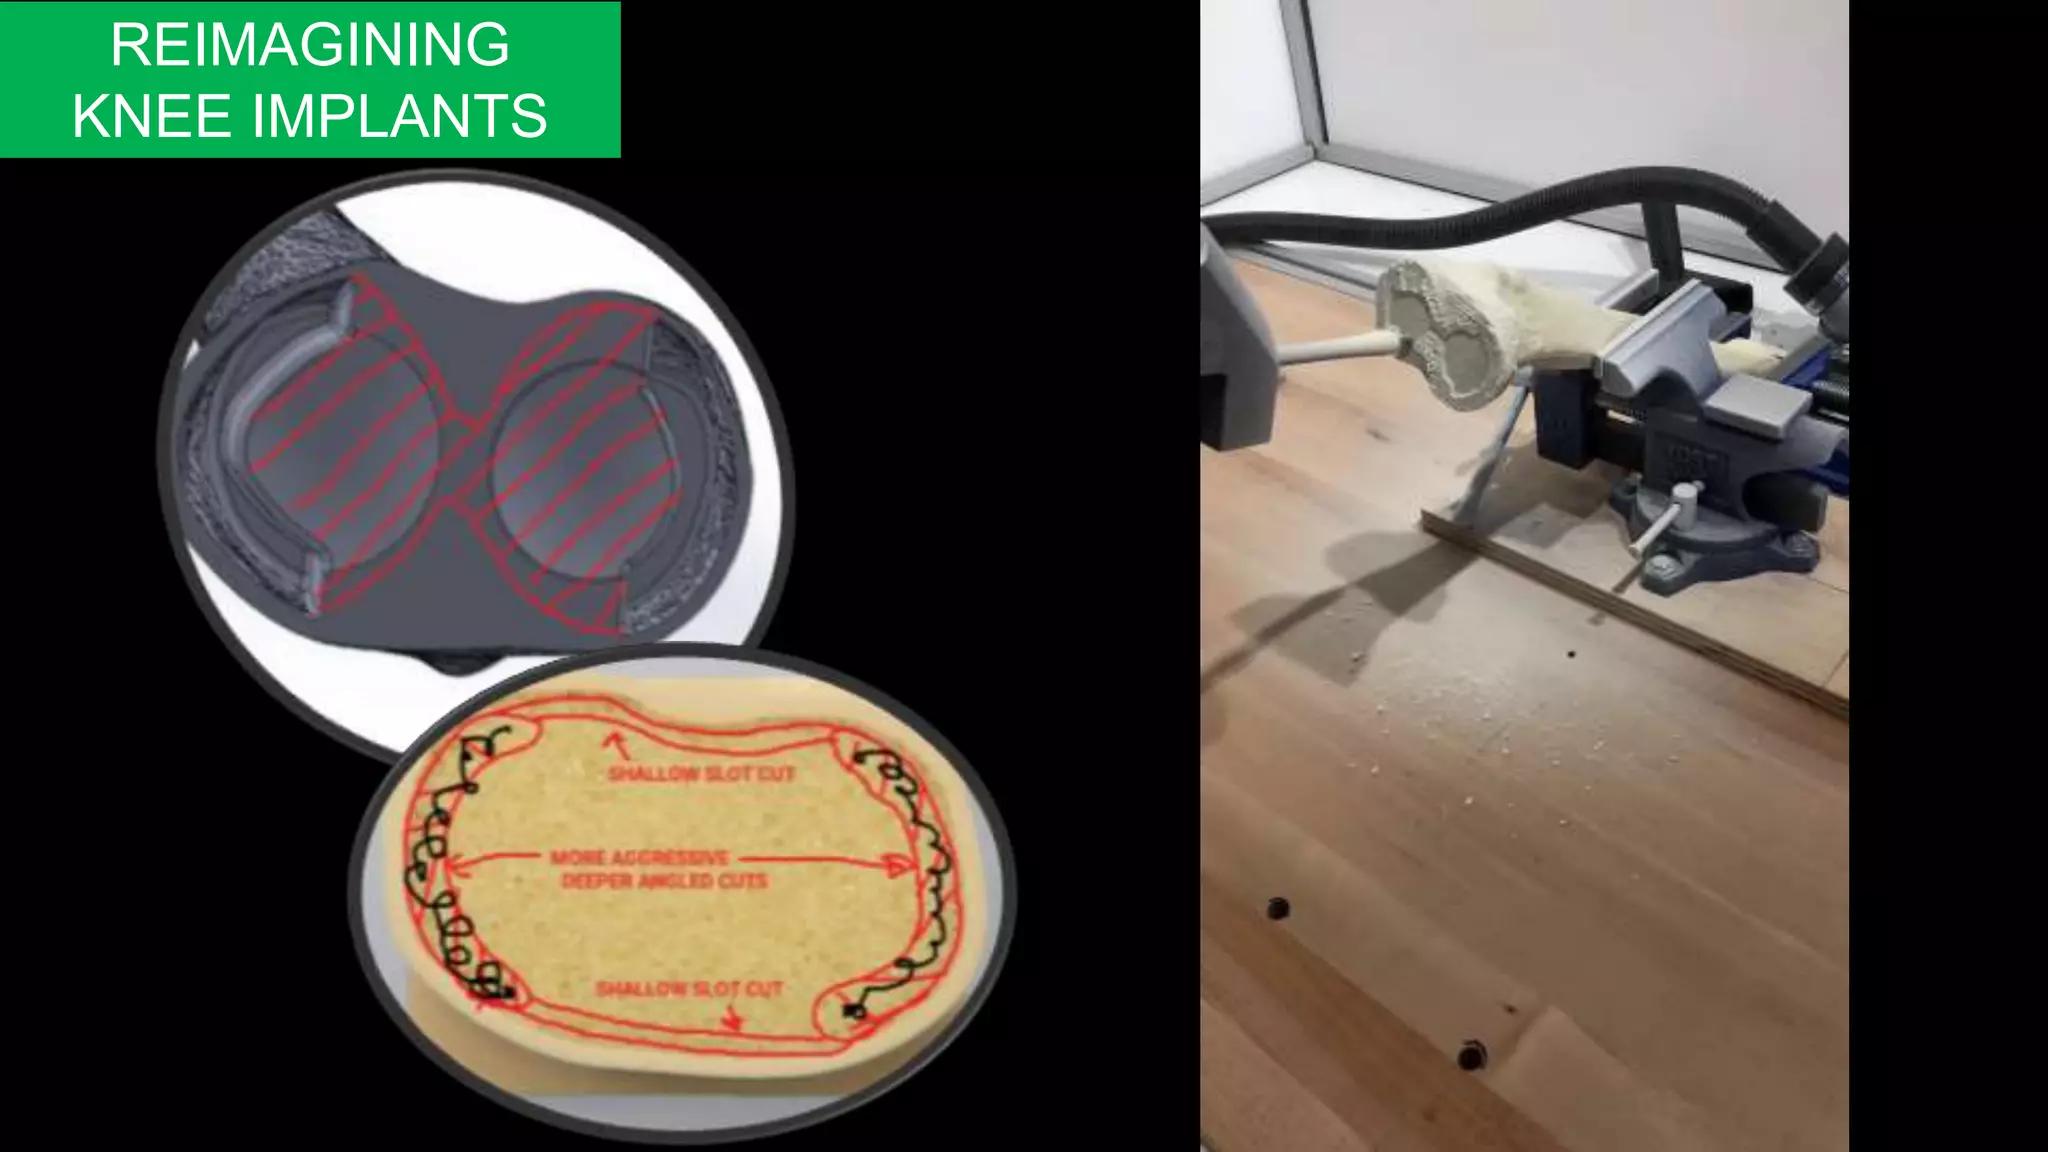
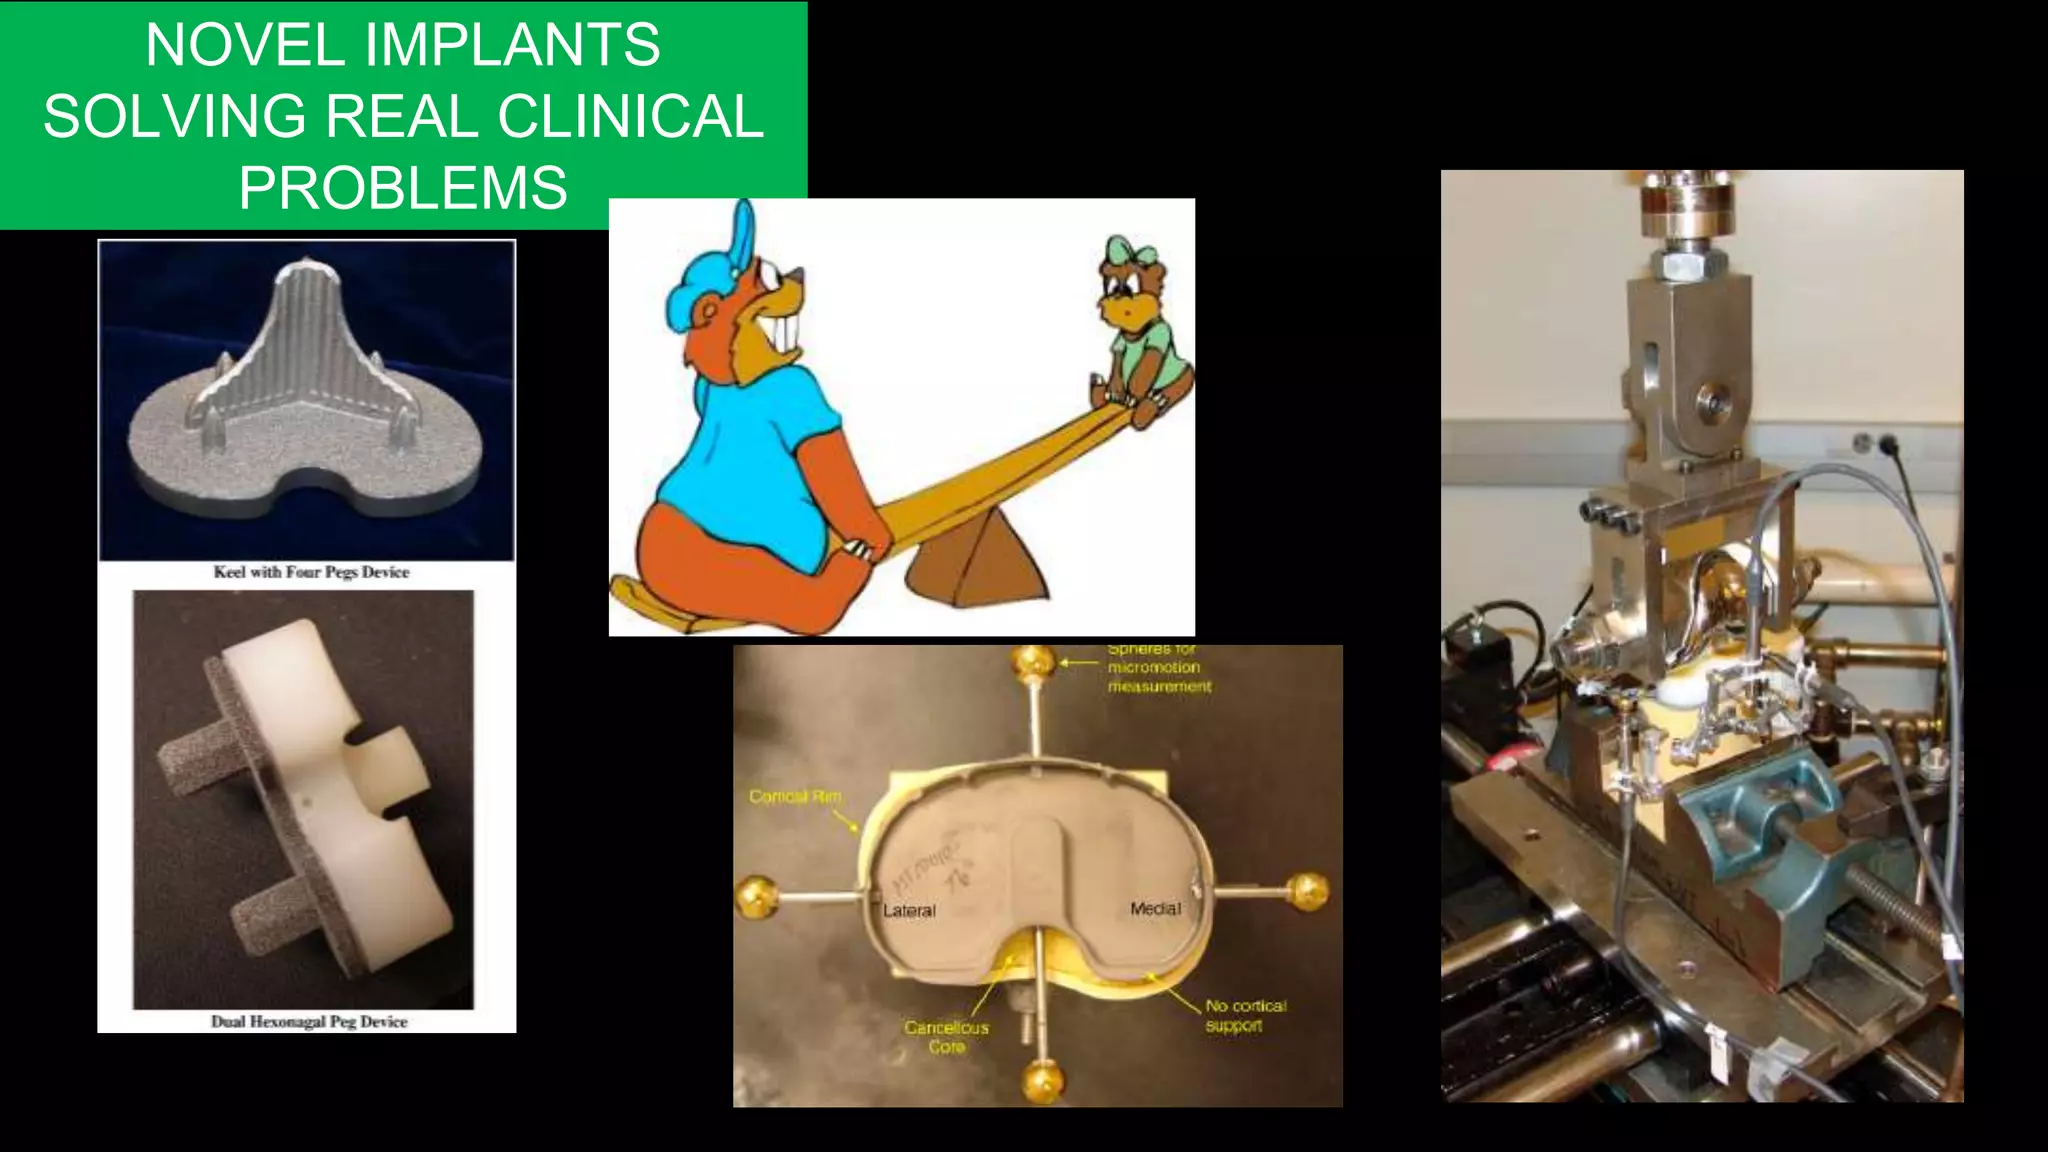
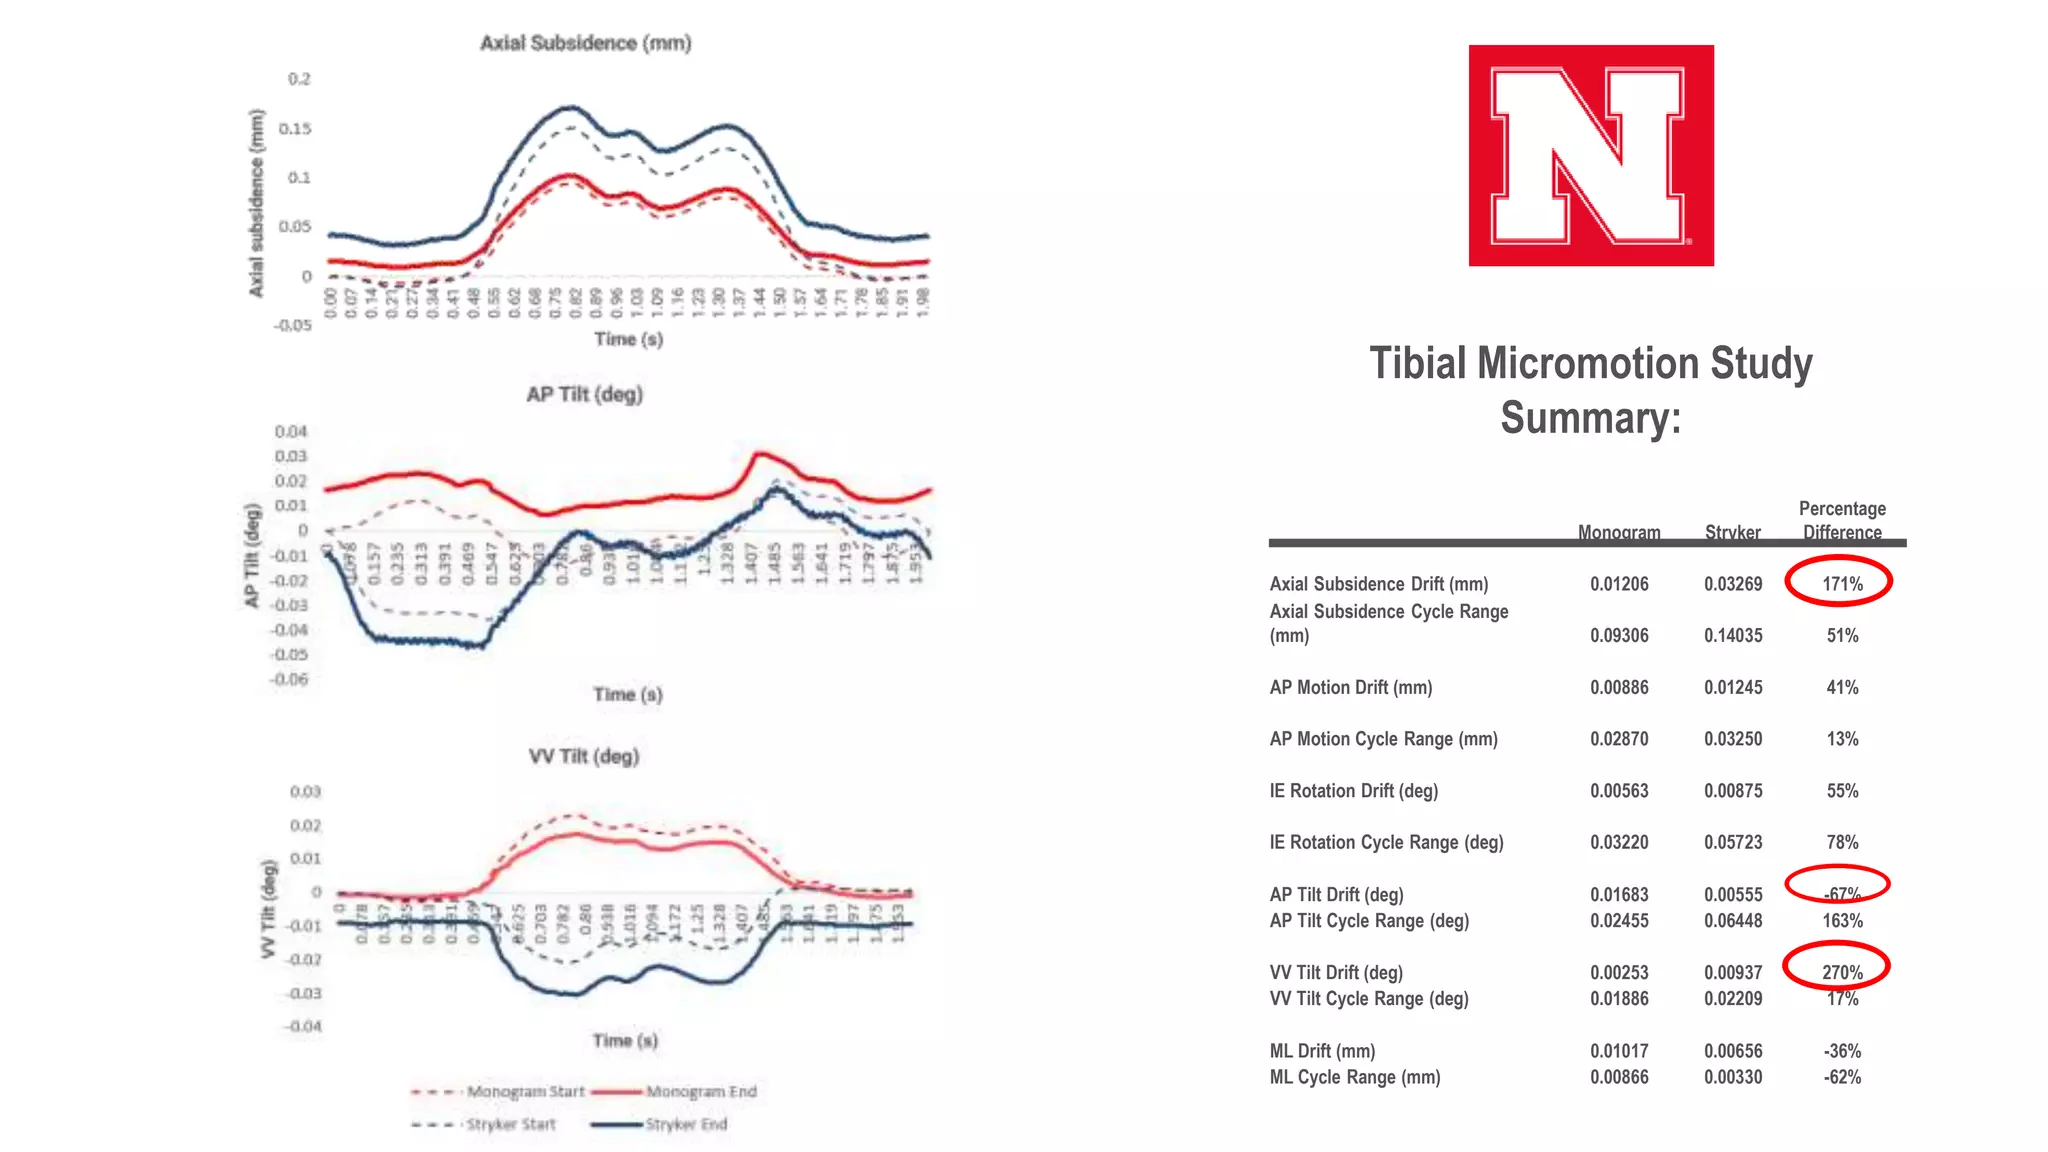
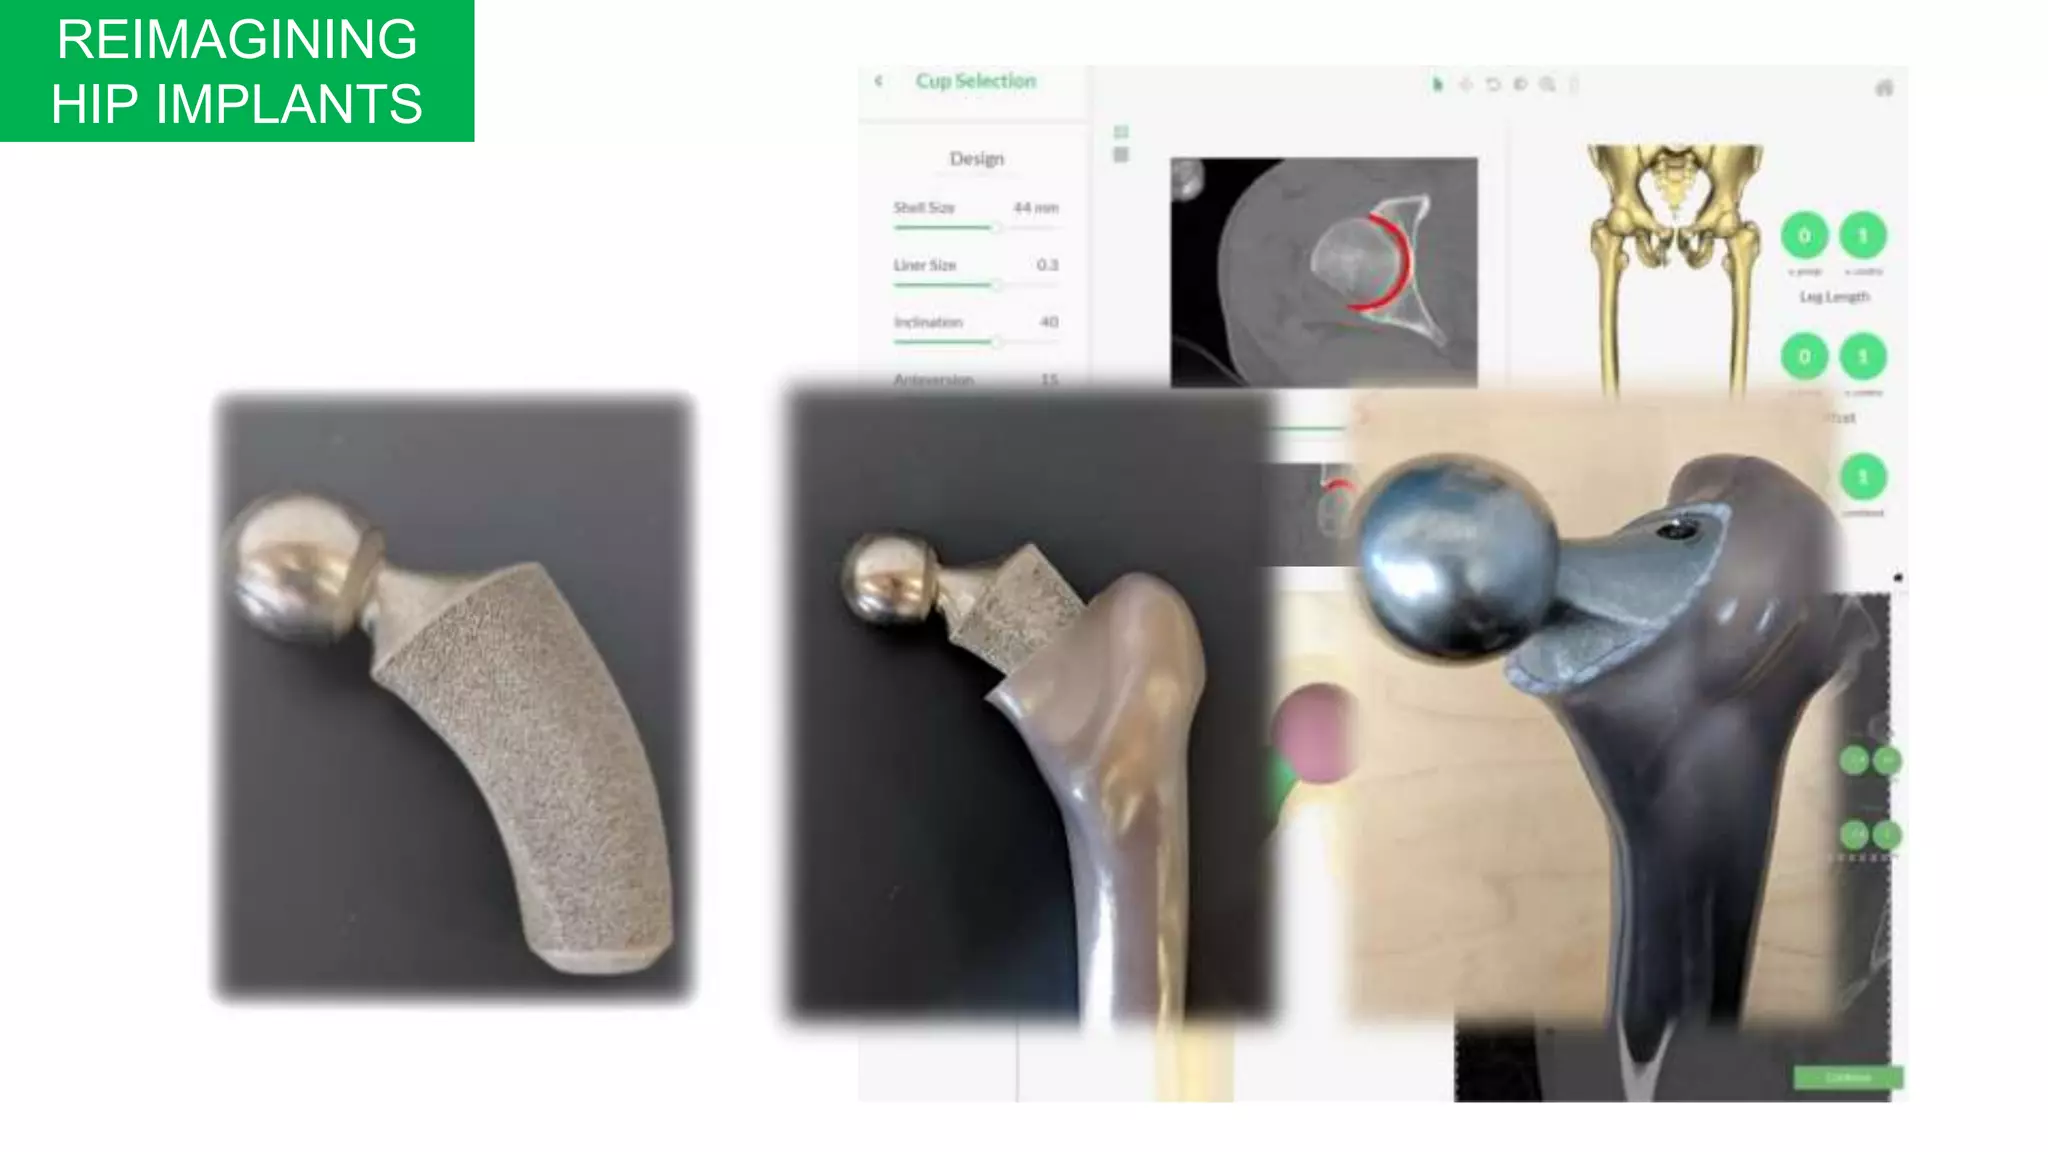
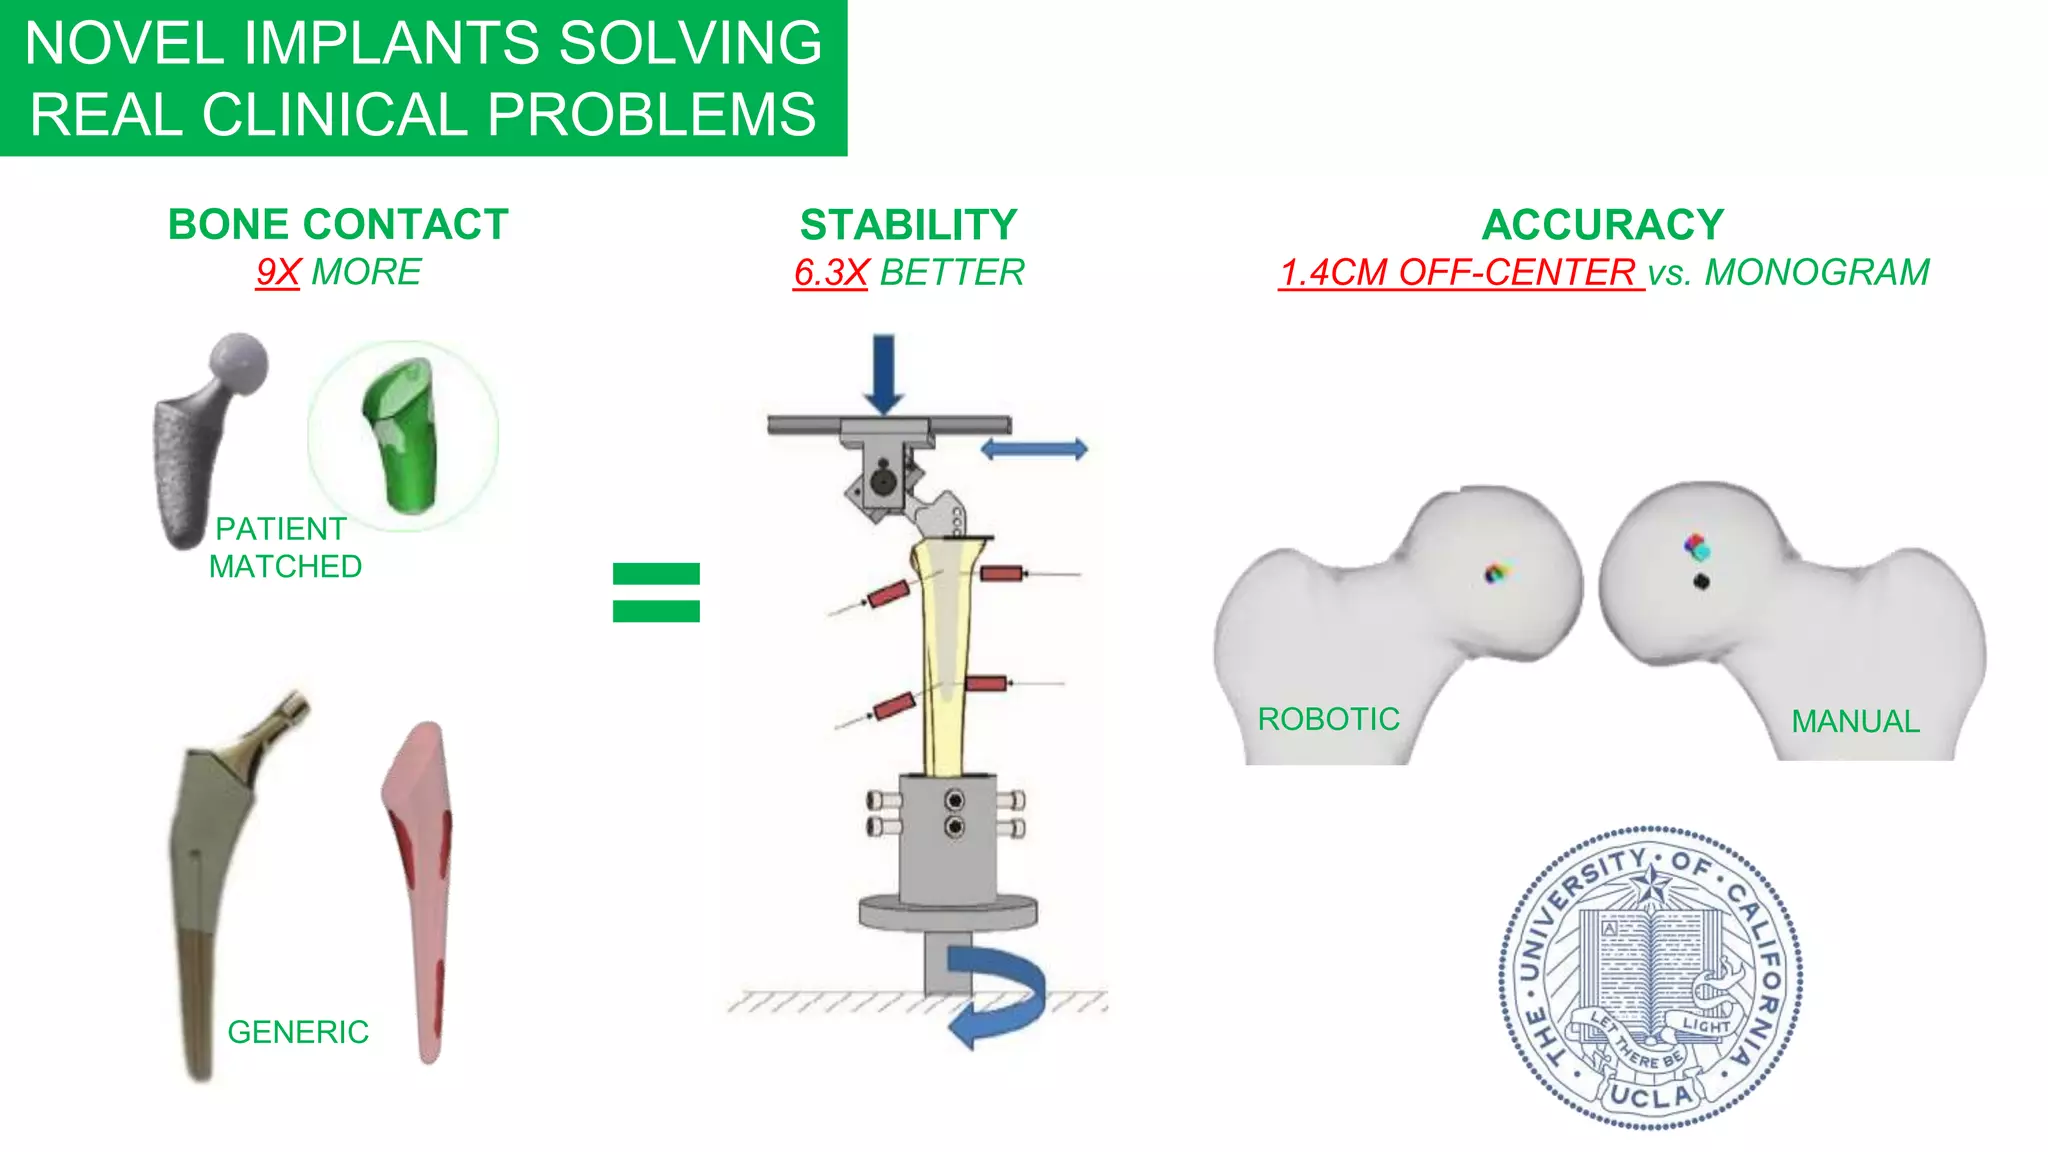
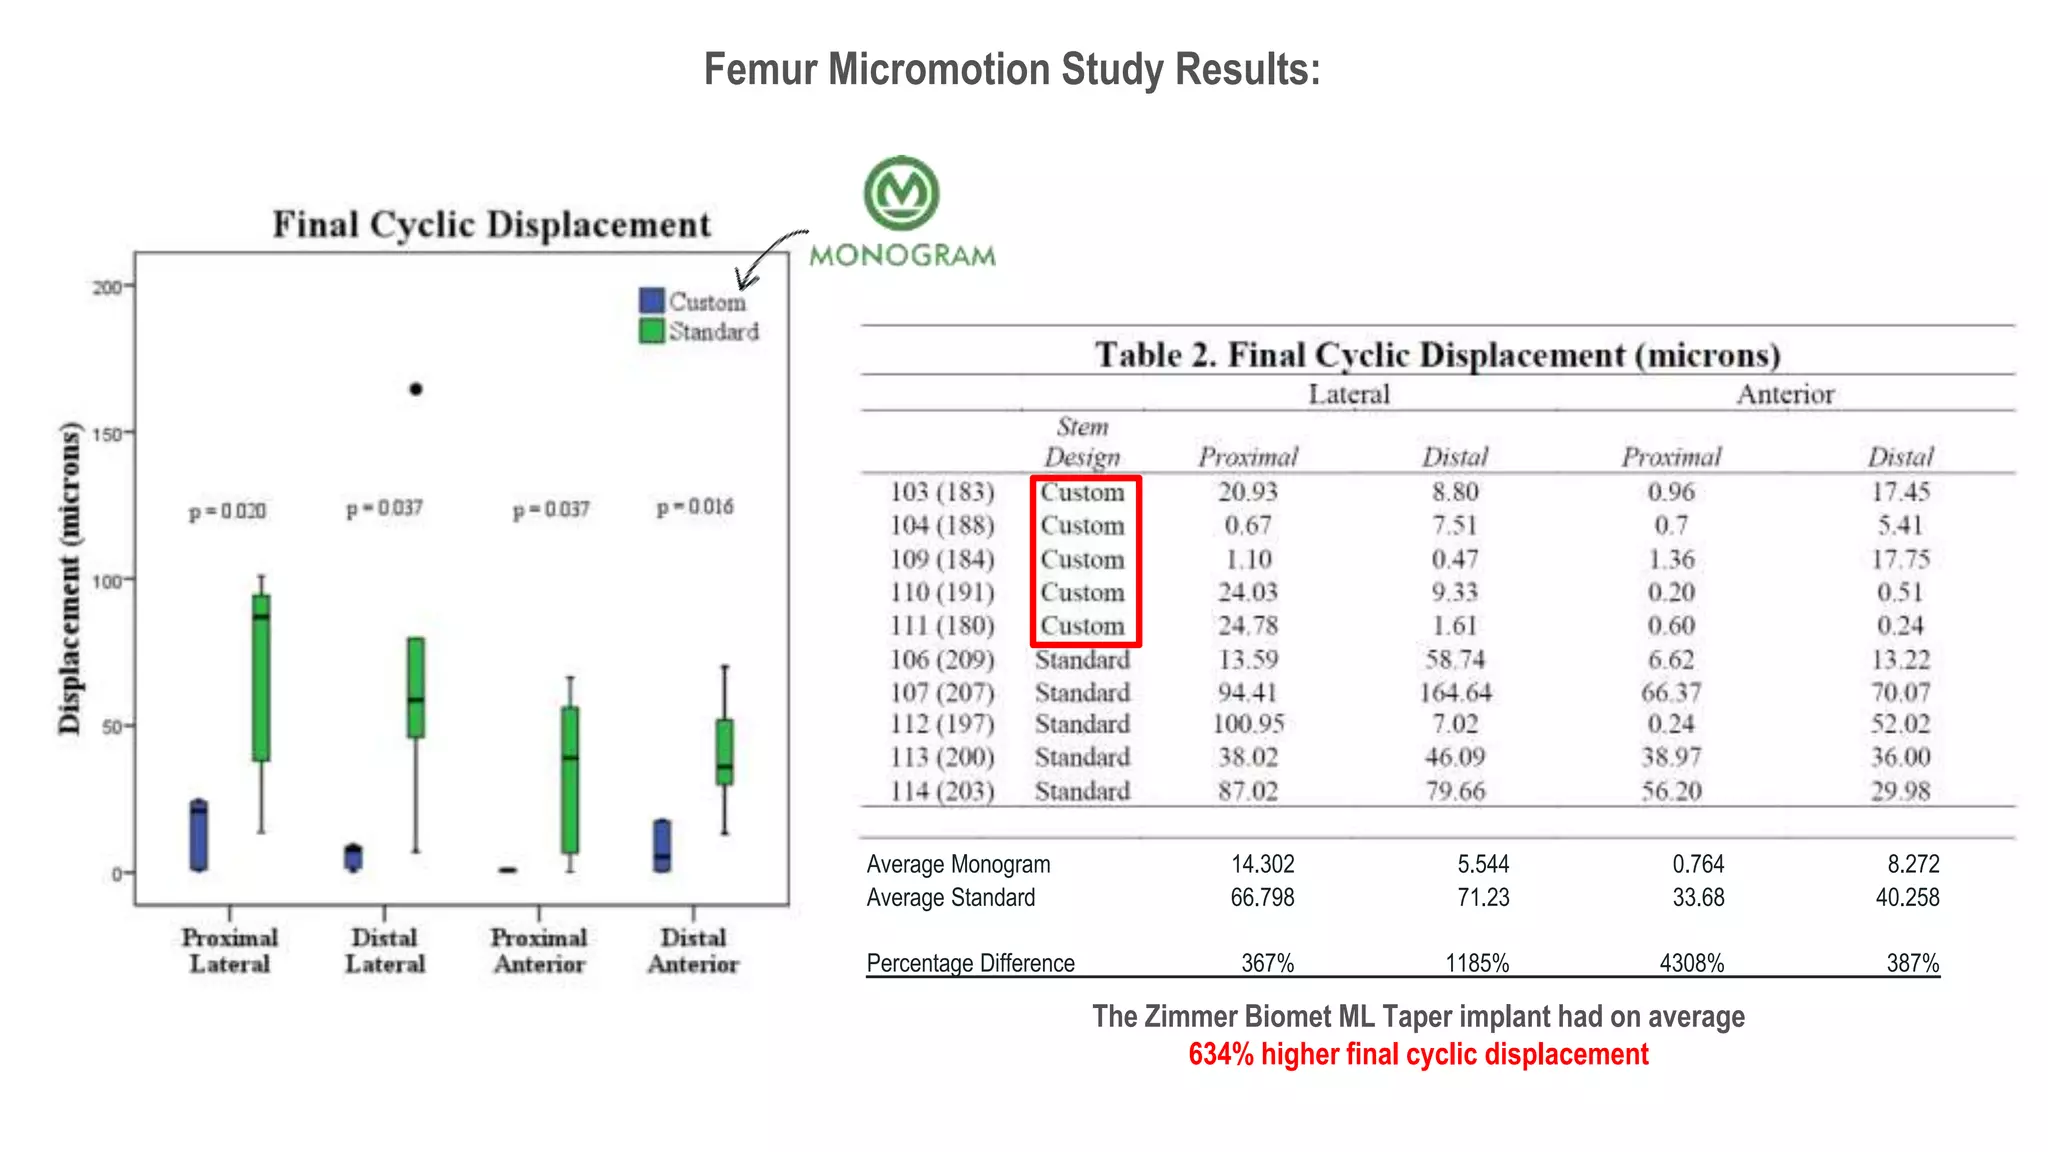
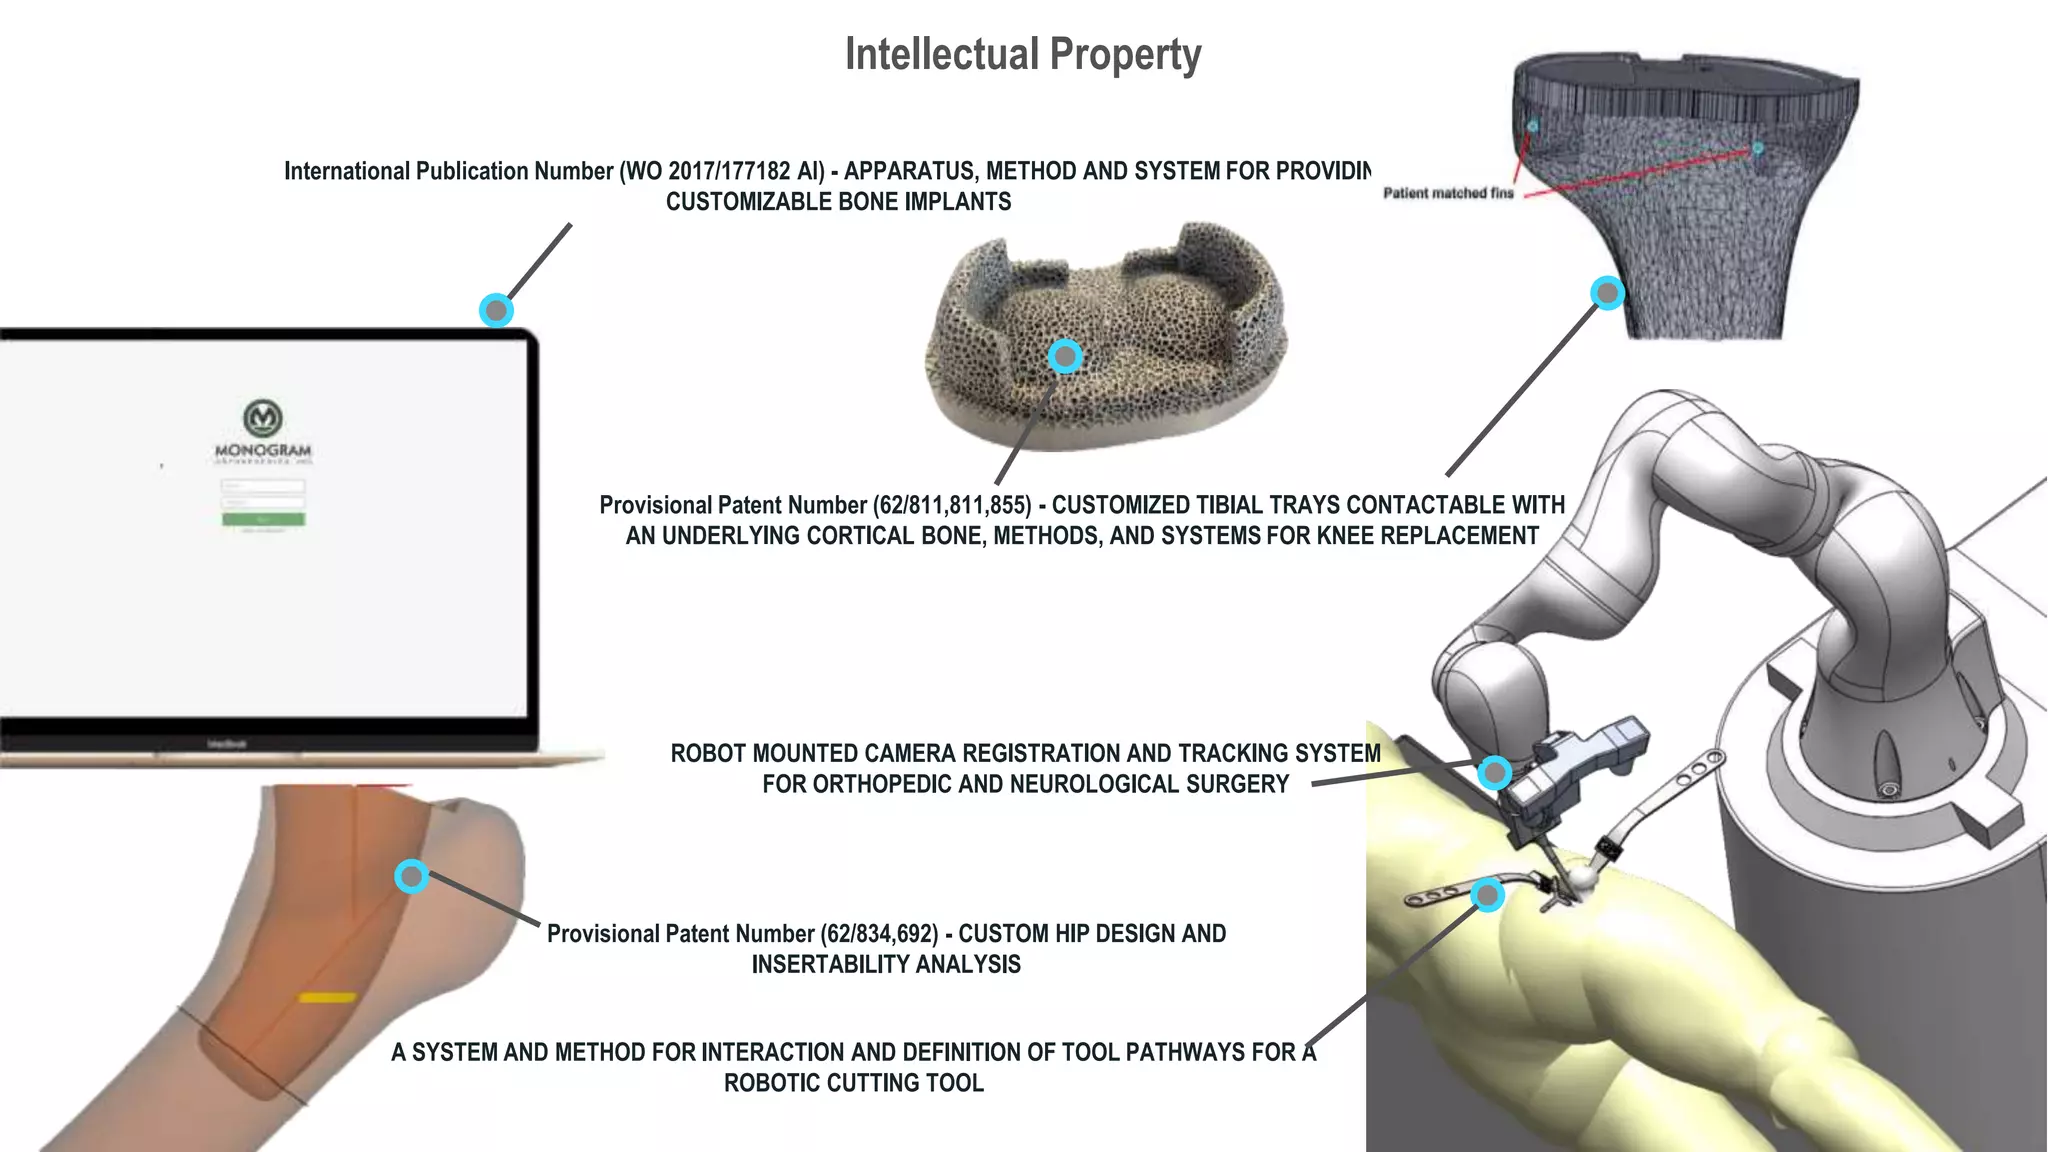
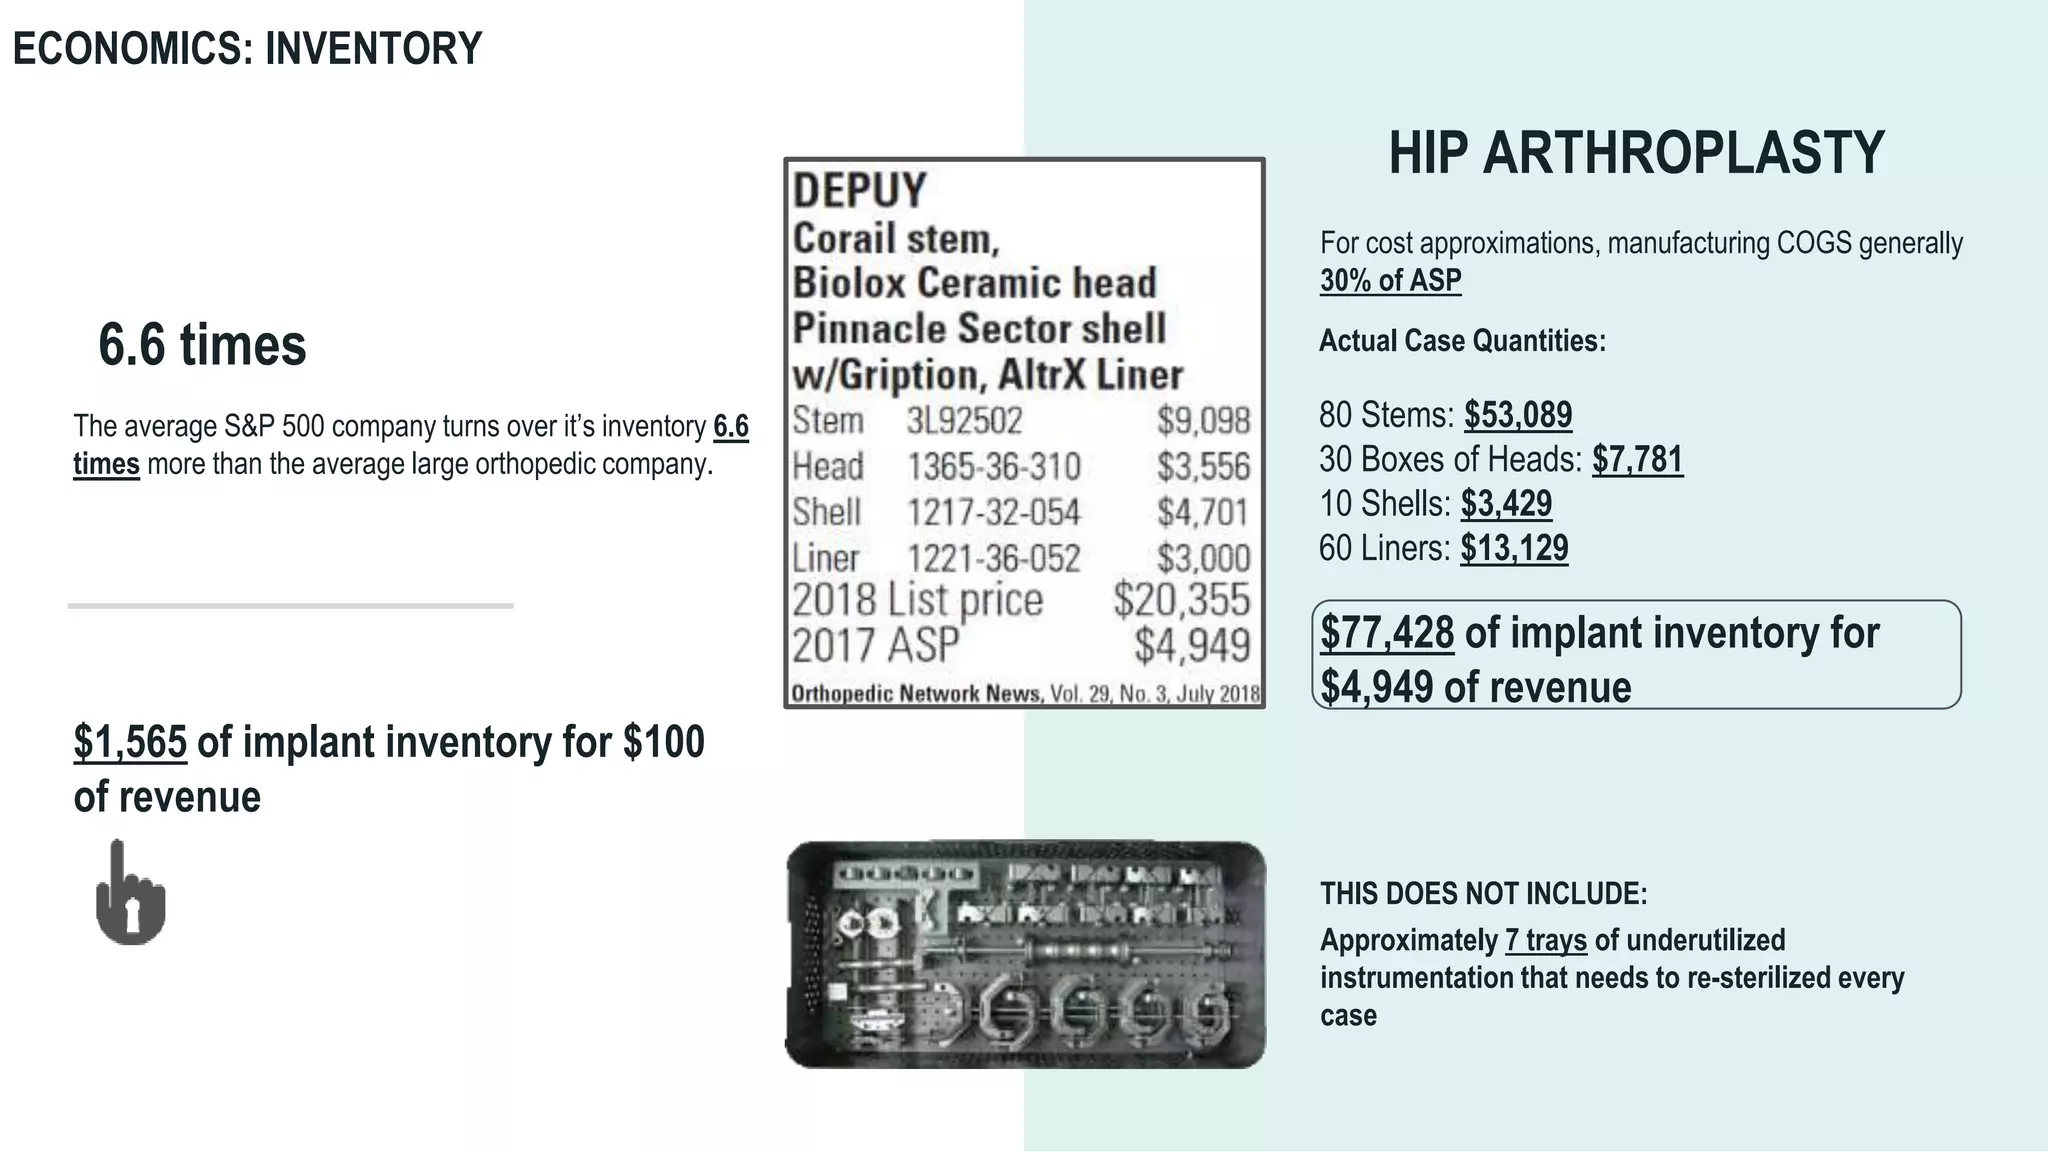
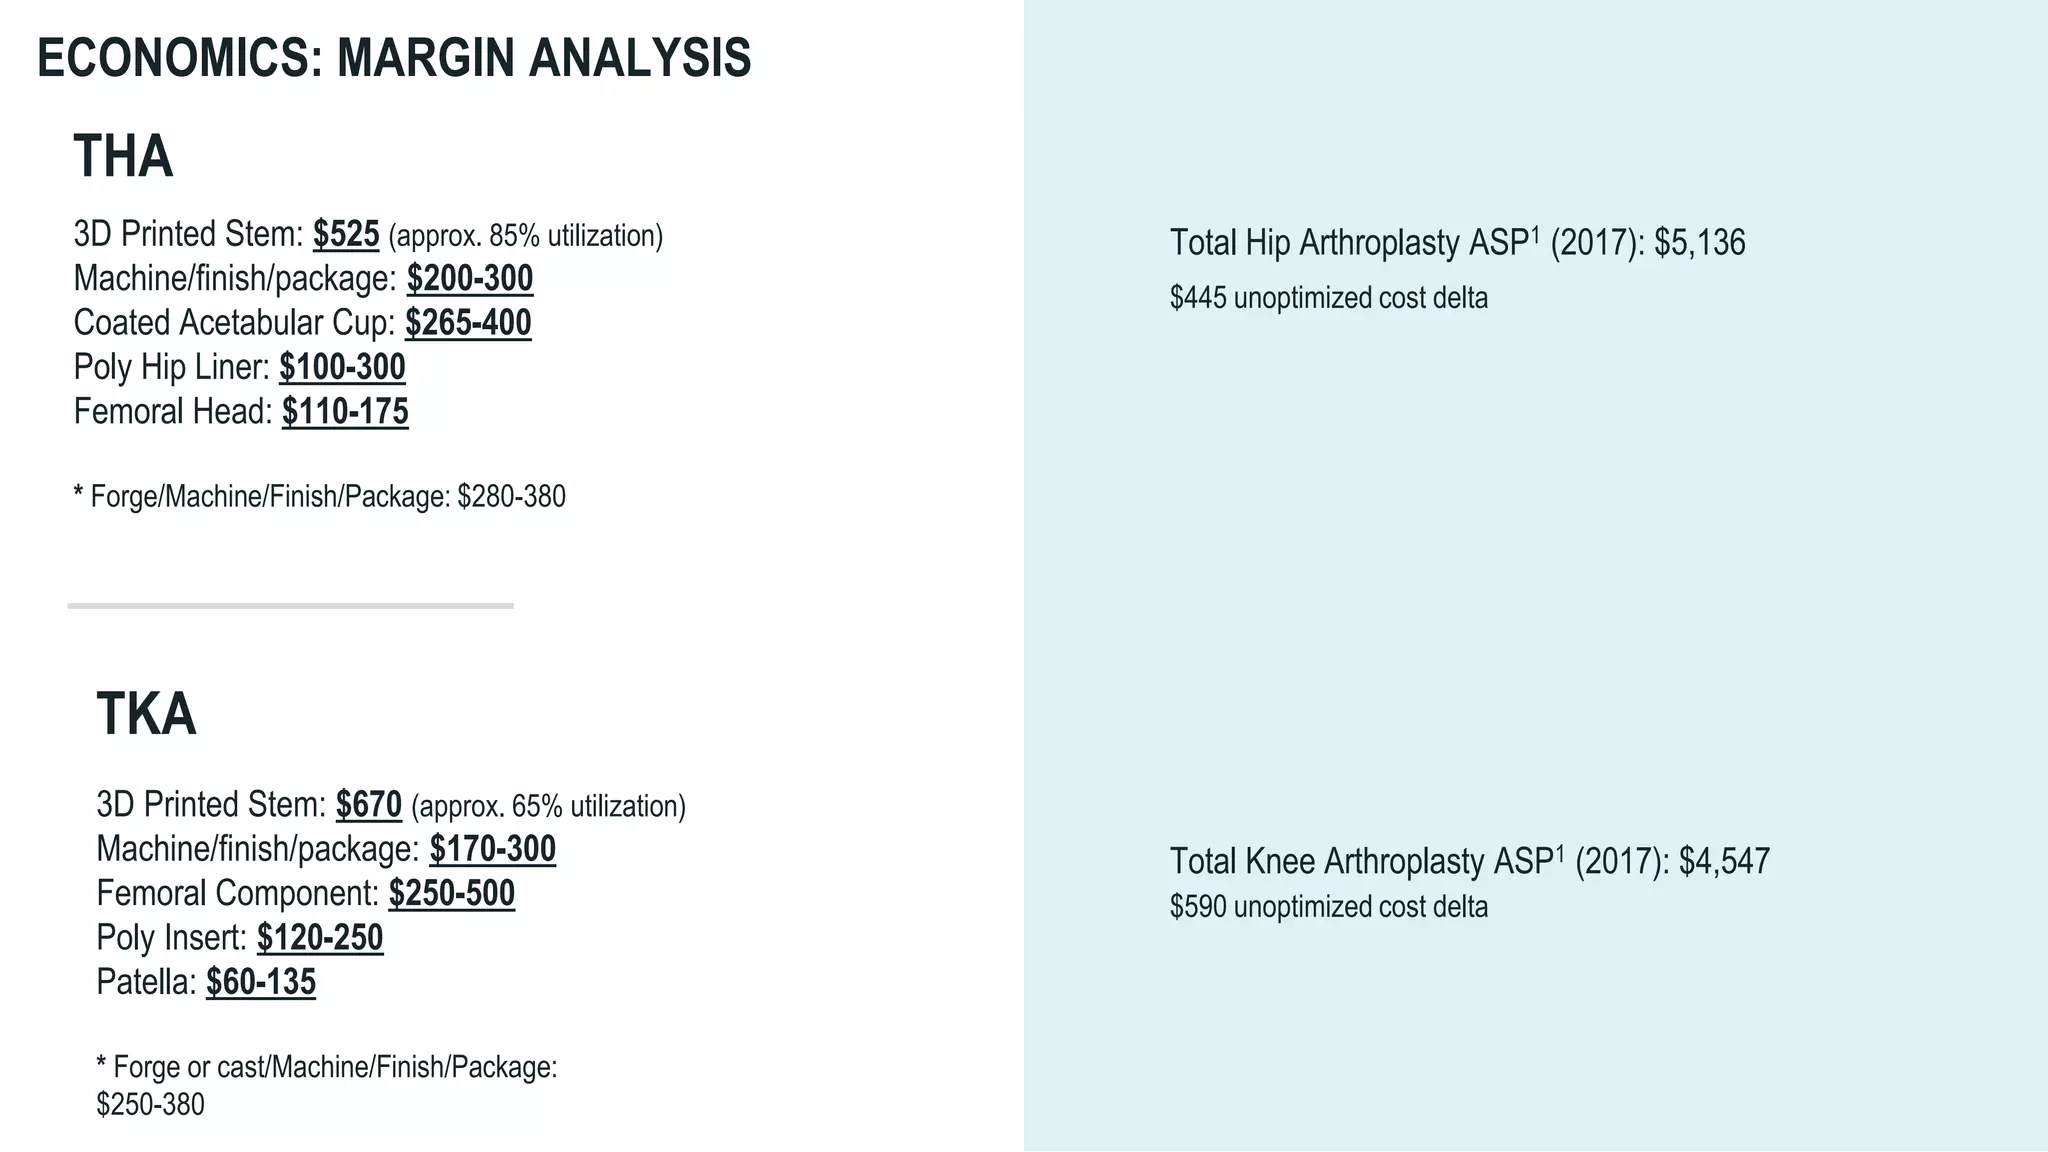
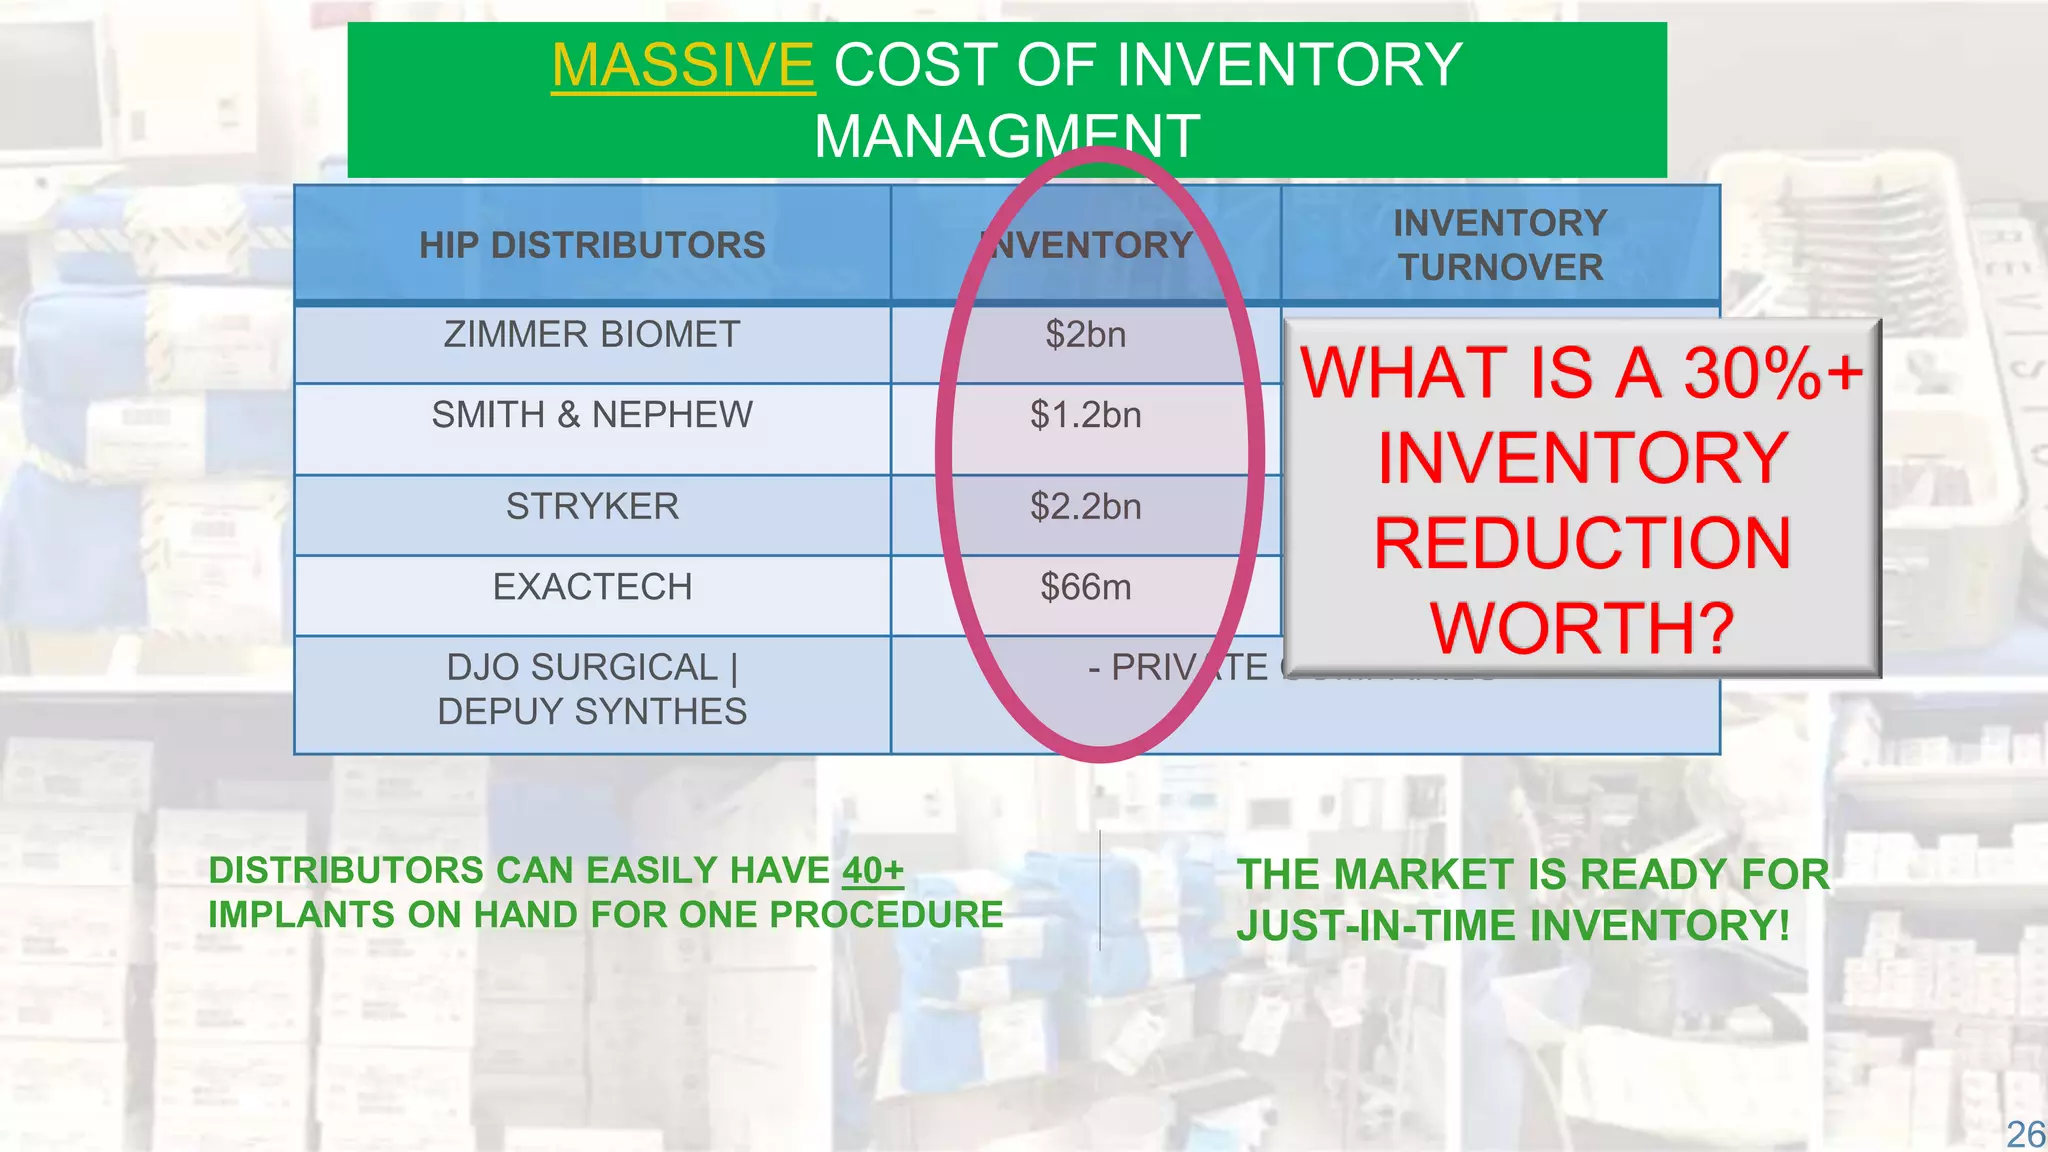
Orthopaedics
Reimagined
“…take an image and send out an instrument set and an implant that is going to fit perfect; it could dramatically
improve the efficiency of how we deliver these products to our customers.”
David Illingworth
CEO, Smith & Nephew
2011
THE INDUSTRY SEES THE
FUTURE
THE MONOGRAM SOLUTION
Why Orthopaedic Robotics Has Not Gone Away
Perfect X-rays
Better clinical results
Improved survivorship
BUT GEN 1 ROBOTS STILL HAVE ISSUES
Too expensive
Too slow
Too disruptive
Too big
GEN 1 NAVIGATION
GEN 1 POINT CLOUD REGISTRATION
| 44
GEN 1 IN PRACTICE
Less Disruptive – Smaller/Lighter
Faster (No haptics, streamlined registration)
Less Expensive – Moore’s Law
But still…Robots are being used
to drive sales of the same old implants.
BIG PLAYERS NOW
INVESTING IN GEN2
Gen 3 Orthobot
Faster, less disruptive, less costly,
and safer than Gen 2
AND
Designed for patient specific implants
that solve clinical problems
3D Printed “Quick-Point” Guides for Rapid Registration
REIMAGINING
KNEE IMPLANTS
REIMAGINING
KNEE IMPLANTS
NOVEL IMPLANTS
SOLVING REAL CLINICAL
PROBLEMS
Monogram Stryker
Percentage
Difference
Axial Subsidence Drift (mm) 0.01206 0.03269 171%
Axial Subsidence Cycle Range
(mm) 0.09306 0.14035 51%
AP Motion Drift (mm) 0.00886 0.01245 41%
AP Motion Cycle Range (mm) 0.02870 0.03250 13%
IE Rotation Drift (deg) 0.00563 0.00875 55%
IE Rotation Cycle Range (deg) 0.03220 0.05723 78%
AP Tilt Drift (deg) 0.01683 0.00555 -67%
AP Tilt Cycle Range (deg) 0.02455 0.06448 163%
VV Tilt Drift (deg) 0.00253 0.00937 270%
VV Tilt Cycle Range (deg) 0.01886 0.02209 17%
ML Drift (mm) 0.01017 0.00656 -36%
ML Cycle Range (mm) 0.00866 0.00330 -62%
Tibial Micromotion Study
Summary:
REIMAGINING
HIP IMPLANTS
NOVEL IMPLANTS SOLVING
REAL CLINICAL PROBLEMS
GENERIC
BONE CONTACT
9X MORE
ACCURACY
1.4CM OFF-CENTER vs. MONOGRAM
STABILITY
6.3X BETTER
ROBOTIC MANUAL
PATIENT
MATCHED
=
Femur Micromotion Study Results:
Average Monogram 14.302 5.544 0.764 8.272
Average Standard 66.798 71.23 33.68 40.258
Percentage Difference 367% 1185% 4308% 387%
The Zimmer Biomet ML Taper implant had on average
634% higher final cyclic displacement
Mechanical Testing: Femoral Component
7206-4-Axial Compression Fatigue 7206-6-Neck Fatigue
Intellectual Property
International Publication Number (WO 2017/177182 Al) - APPARATUS, METHOD AND SYSTEM FOR PROVIDING
CUSTOMIZABLE BONE IMPLANTS
Provisional Patent Number (62/811,811,855) - CUSTOMIZED TIBIAL TRAYS CONTACTABLE WITH
AN UNDERLYING CORTICAL BONE, METHODS, AND SYSTEMS FOR KNEE REPLACEMENT
Provisional Patent Number (62/834,692) - CUSTOM HIP DESIGN AND
INSERTABILITY ANALYSIS
ROBOT MOUNTED CAMERA REGISTRATION AND TRACKING SYSTEM
FOR ORTHOPEDIC AND NEUROLOGICAL SURGERY
A SYSTEM AND METHOD FOR INTERACTION AND DEFINITION OF TOOL PATHWAYS FOR A
ROBOTIC CUTTING TOOL
ECONOMICS: INVENTORY
HIP ARTHROPLASTY
Actual Case Quantities:
80 Stems: $53,089
30 Boxes of Heads: $7,781
10 Shells: $3,429
60 Liners: $13,129
For cost approximations, manufacturing COGS generally
30% of ASP
$77,428 of implant inventory for
$4,949 of revenue
Approximately 7 trays of underutilized
instrumentation that needs to re-sterilized every
case
THIS DOES NOT INCLUDE:
The average S&P 500 company turns over it’s inventory 6.6
times more than the average large orthopedic company.
6.6 times
$1,565 of implant inventory for $100
of revenue
ECONOMICS: MARGIN ANALYSIS
3D Printed Stem: $525 (approx. 85% utilization)
Machine/finish/package: $200-300
Coated Acetabular Cup: $265-400
Poly Hip Liner: $100-300
Femoral Head: $110-175
* Forge/Machine/Finish/Package: $280-380
$445 unoptimized cost delta
Total Hip Arthroplasty ASP1 (2017): $5,136
THA
3D Printed Stem: $670 (approx. 65% utilization)
Machine/finish/package: $170-300
Femoral Component: $250-500
Poly Insert: $120-250
Patella: $60-135
* Forge or cast/Machine/Finish/Package:
$250-380
TKA
Total Knee Arthroplasty ASP1 (2017): $4,547
$590 unoptimized cost delta
26
HIP DISTRIBUTORS INVENTORY
INVENTORY
TURNOVER
ZIMMER BIOMET $2bn 1.0x
SMITH & NEPHEW $1.2bn 1.0x
STRYKER $2.2bn 2.0x
EXACTECH $66m 1.2x
DJO SURGICAL |
DEPUY SYNTHES
- PRIVATE COMPANIES -
THE MARKET IS READY FOR
JUST-IN-TIME INVENTORY!
DISTRIBUTORS CAN EASILY HAVE 40+
IMPLANTS ON HAND FOR ONE PROCEDURE
MASSIVE COST OF INVENTORY
MANAGMENT
WHAT IS A 30%+
INVENTORY
REDUCTION
WORTH?
Good to the Bone
The Future of Personalized Implants in Joint Replacement: Additive, Robotics, Augmented Reality

The Future of Personalized Implants in Joint Replacement: Additive, Robotics, Augmented Reality

  • 2.
  • 3.
    “…take an imageand send out an instrument set and an implant that is going to fit perfect; it could dramatically improve the efficiency of how we deliver these products to our customers.” David Illingworth CEO, Smith & Nephew 2011 THE INDUSTRY SEES THE FUTURE
  • 4.
  • 6.
    Why Orthopaedic RoboticsHas Not Gone Away Perfect X-rays Better clinical results Improved survivorship
  • 7.
    BUT GEN 1ROBOTS STILL HAVE ISSUES Too expensive Too slow Too disruptive Too big
  • 8.
  • 9.
    GEN 1 POINTCLOUD REGISTRATION
  • 10.
    | 44 GEN 1IN PRACTICE
  • 11.
    Less Disruptive –Smaller/Lighter Faster (No haptics, streamlined registration) Less Expensive – Moore’s Law But still…Robots are being used to drive sales of the same old implants. BIG PLAYERS NOW INVESTING IN GEN2
  • 12.
    Gen 3 Orthobot Faster,less disruptive, less costly, and safer than Gen 2 AND Designed for patient specific implants that solve clinical problems
  • 14.
    3D Printed “Quick-Point”Guides for Rapid Registration
  • 15.
  • 16.
  • 17.
    NOVEL IMPLANTS SOLVING REALCLINICAL PROBLEMS
  • 18.
    Monogram Stryker Percentage Difference Axial SubsidenceDrift (mm) 0.01206 0.03269 171% Axial Subsidence Cycle Range (mm) 0.09306 0.14035 51% AP Motion Drift (mm) 0.00886 0.01245 41% AP Motion Cycle Range (mm) 0.02870 0.03250 13% IE Rotation Drift (deg) 0.00563 0.00875 55% IE Rotation Cycle Range (deg) 0.03220 0.05723 78% AP Tilt Drift (deg) 0.01683 0.00555 -67% AP Tilt Cycle Range (deg) 0.02455 0.06448 163% VV Tilt Drift (deg) 0.00253 0.00937 270% VV Tilt Cycle Range (deg) 0.01886 0.02209 17% ML Drift (mm) 0.01017 0.00656 -36% ML Cycle Range (mm) 0.00866 0.00330 -62% Tibial Micromotion Study Summary:
  • 19.
  • 20.
    NOVEL IMPLANTS SOLVING REALCLINICAL PROBLEMS GENERIC BONE CONTACT 9X MORE ACCURACY 1.4CM OFF-CENTER vs. MONOGRAM STABILITY 6.3X BETTER ROBOTIC MANUAL PATIENT MATCHED =
  • 21.
    Femur Micromotion StudyResults: Average Monogram 14.302 5.544 0.764 8.272 Average Standard 66.798 71.23 33.68 40.258 Percentage Difference 367% 1185% 4308% 387% The Zimmer Biomet ML Taper implant had on average 634% higher final cyclic displacement
  • 22.
    Mechanical Testing: FemoralComponent 7206-4-Axial Compression Fatigue 7206-6-Neck Fatigue
  • 23.
    Intellectual Property International PublicationNumber (WO 2017/177182 Al) - APPARATUS, METHOD AND SYSTEM FOR PROVIDING CUSTOMIZABLE BONE IMPLANTS Provisional Patent Number (62/811,811,855) - CUSTOMIZED TIBIAL TRAYS CONTACTABLE WITH AN UNDERLYING CORTICAL BONE, METHODS, AND SYSTEMS FOR KNEE REPLACEMENT Provisional Patent Number (62/834,692) - CUSTOM HIP DESIGN AND INSERTABILITY ANALYSIS ROBOT MOUNTED CAMERA REGISTRATION AND TRACKING SYSTEM FOR ORTHOPEDIC AND NEUROLOGICAL SURGERY A SYSTEM AND METHOD FOR INTERACTION AND DEFINITION OF TOOL PATHWAYS FOR A ROBOTIC CUTTING TOOL
  • 24.
    ECONOMICS: INVENTORY HIP ARTHROPLASTY ActualCase Quantities: 80 Stems: $53,089 30 Boxes of Heads: $7,781 10 Shells: $3,429 60 Liners: $13,129 For cost approximations, manufacturing COGS generally 30% of ASP $77,428 of implant inventory for $4,949 of revenue Approximately 7 trays of underutilized instrumentation that needs to re-sterilized every case THIS DOES NOT INCLUDE: The average S&P 500 company turns over it’s inventory 6.6 times more than the average large orthopedic company. 6.6 times $1,565 of implant inventory for $100 of revenue
  • 25.
    ECONOMICS: MARGIN ANALYSIS 3DPrinted Stem: $525 (approx. 85% utilization) Machine/finish/package: $200-300 Coated Acetabular Cup: $265-400 Poly Hip Liner: $100-300 Femoral Head: $110-175 * Forge/Machine/Finish/Package: $280-380 $445 unoptimized cost delta Total Hip Arthroplasty ASP1 (2017): $5,136 THA 3D Printed Stem: $670 (approx. 65% utilization) Machine/finish/package: $170-300 Femoral Component: $250-500 Poly Insert: $120-250 Patella: $60-135 * Forge or cast/Machine/Finish/Package: $250-380 TKA Total Knee Arthroplasty ASP1 (2017): $4,547 $590 unoptimized cost delta
  • 26.
    26 HIP DISTRIBUTORS INVENTORY INVENTORY TURNOVER ZIMMERBIOMET $2bn 1.0x SMITH & NEPHEW $1.2bn 1.0x STRYKER $2.2bn 2.0x EXACTECH $66m 1.2x DJO SURGICAL | DEPUY SYNTHES - PRIVATE COMPANIES - THE MARKET IS READY FOR JUST-IN-TIME INVENTORY! DISTRIBUTORS CAN EASILY HAVE 40+ IMPLANTS ON HAND FOR ONE PROCEDURE MASSIVE COST OF INVENTORY MANAGMENT WHAT IS A 30%+ INVENTORY REDUCTION WORTH?
  • 27.