Download to read offline


![P-value and confidence interval
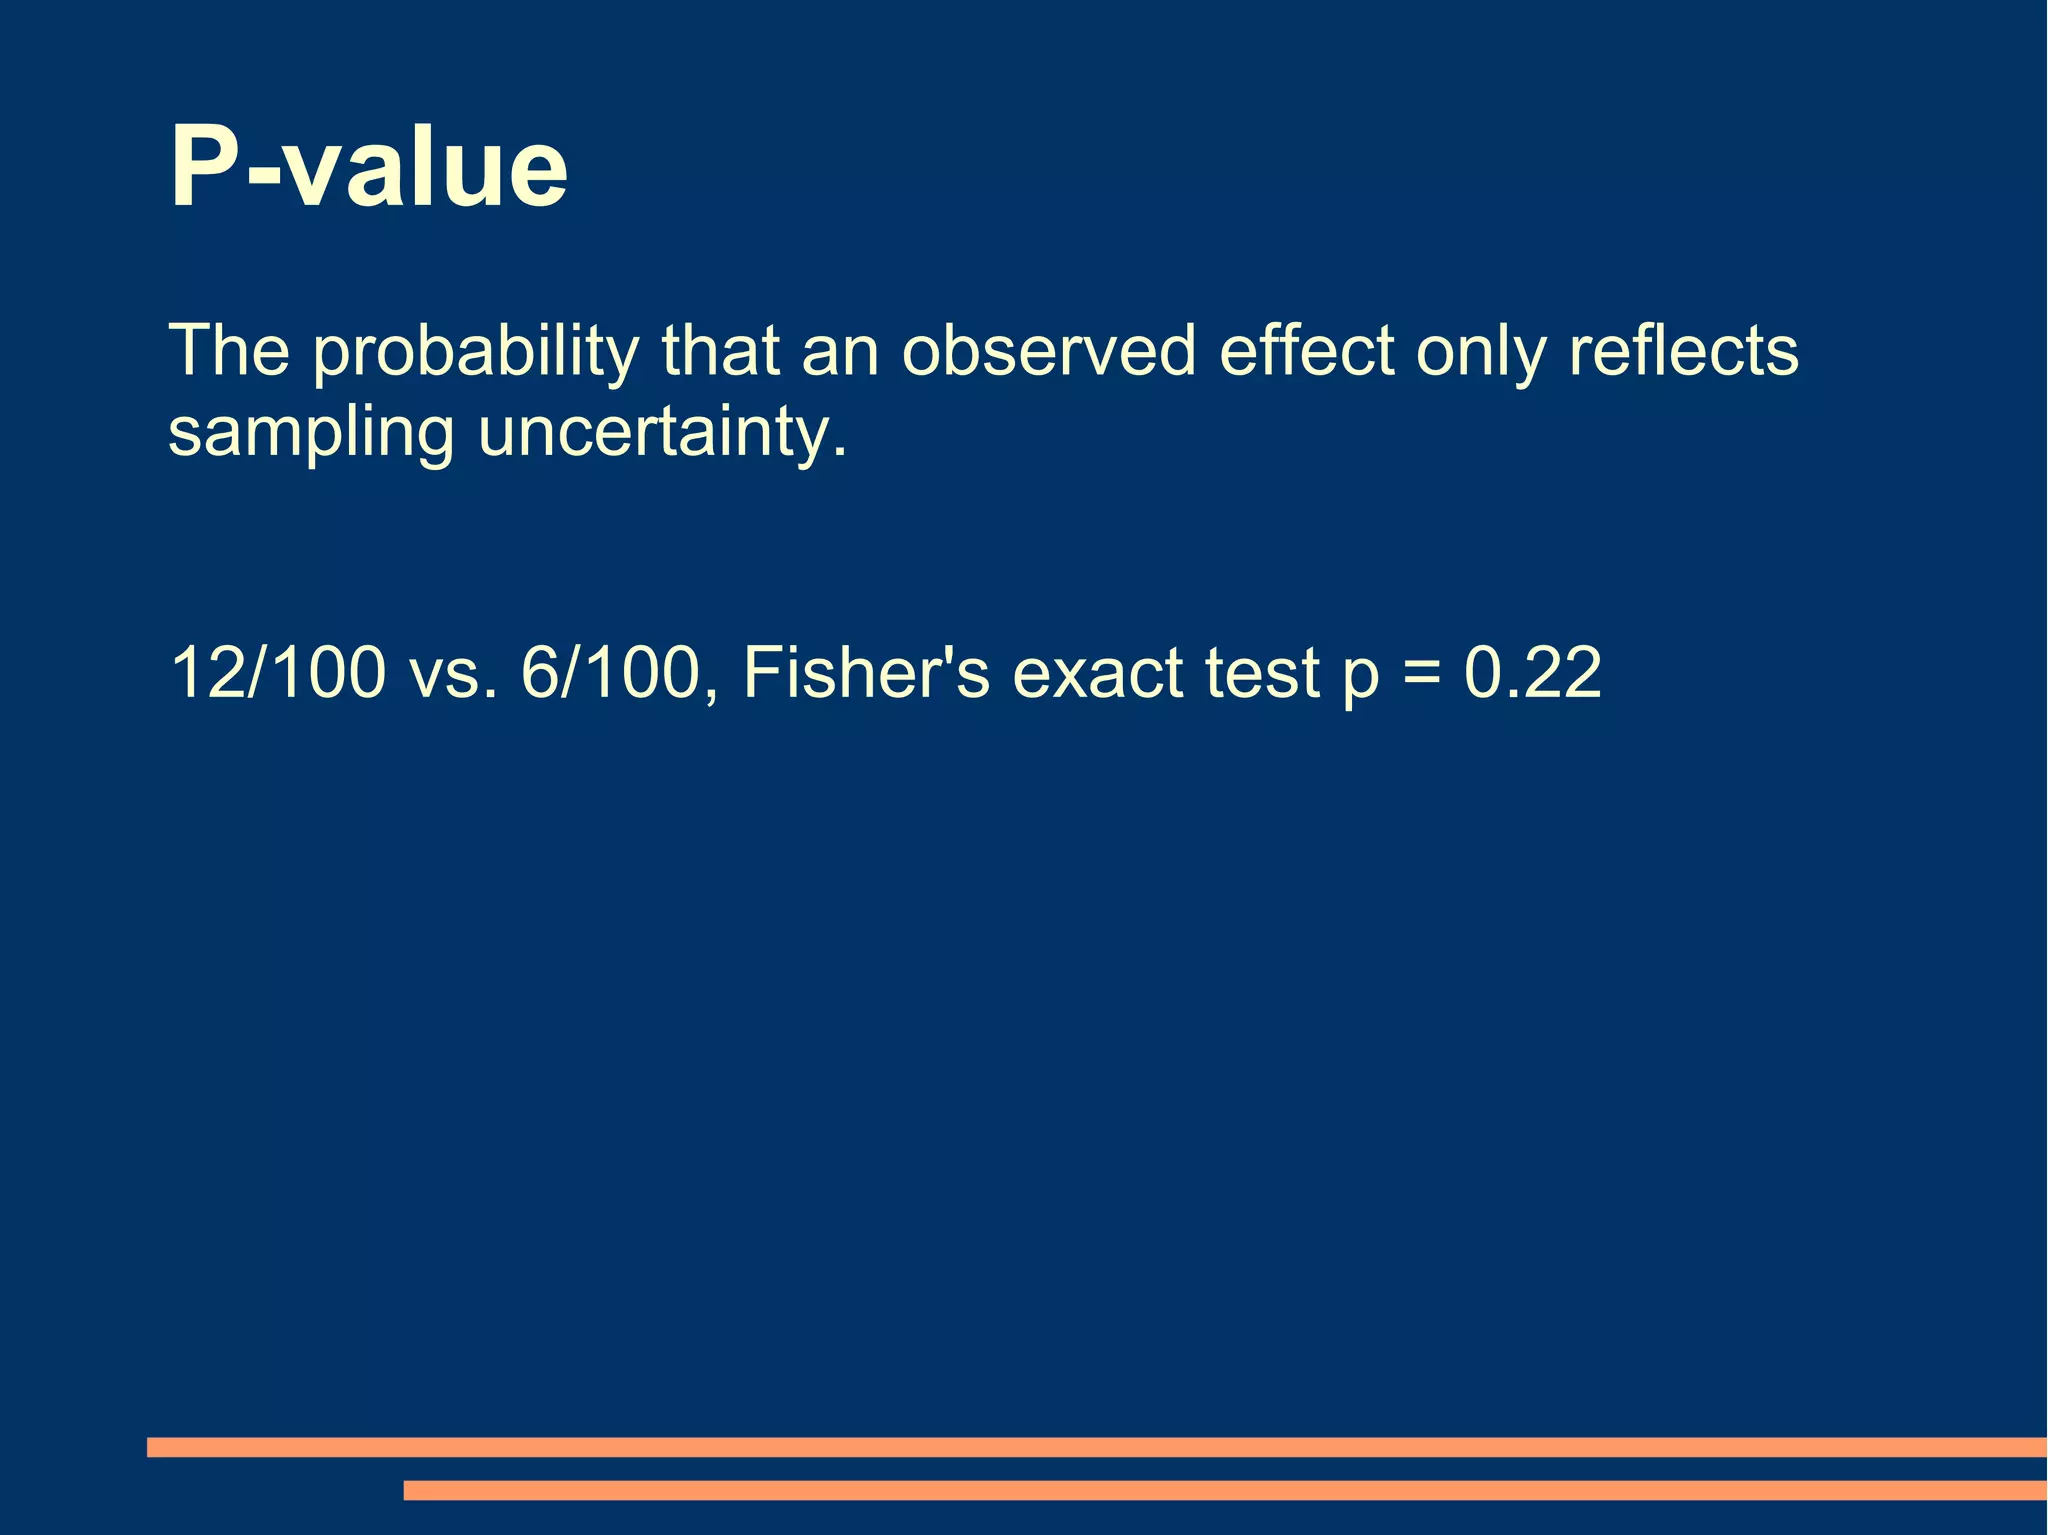
P-values Conclusion from confidence intervals
[2 alternatives] [6 alternatives]
p < 0.05 Statistically but not clinically significant effect
Statistically and clinically significant effect
p < 0.05
p < 0.05 Statistically, but not necessarily clinically, significant effect
n.s.
Inconclusive
n.s. Neither statistically nor clinically significant effect
p < 0.05 Statistically significant reversed effect
Effect
0
Clinically significant effects](https://image.slidesharecdn.com/copenhagen2008-121013085529-phpapp01/75/Copenhagen-2008-44-2048.jpg)


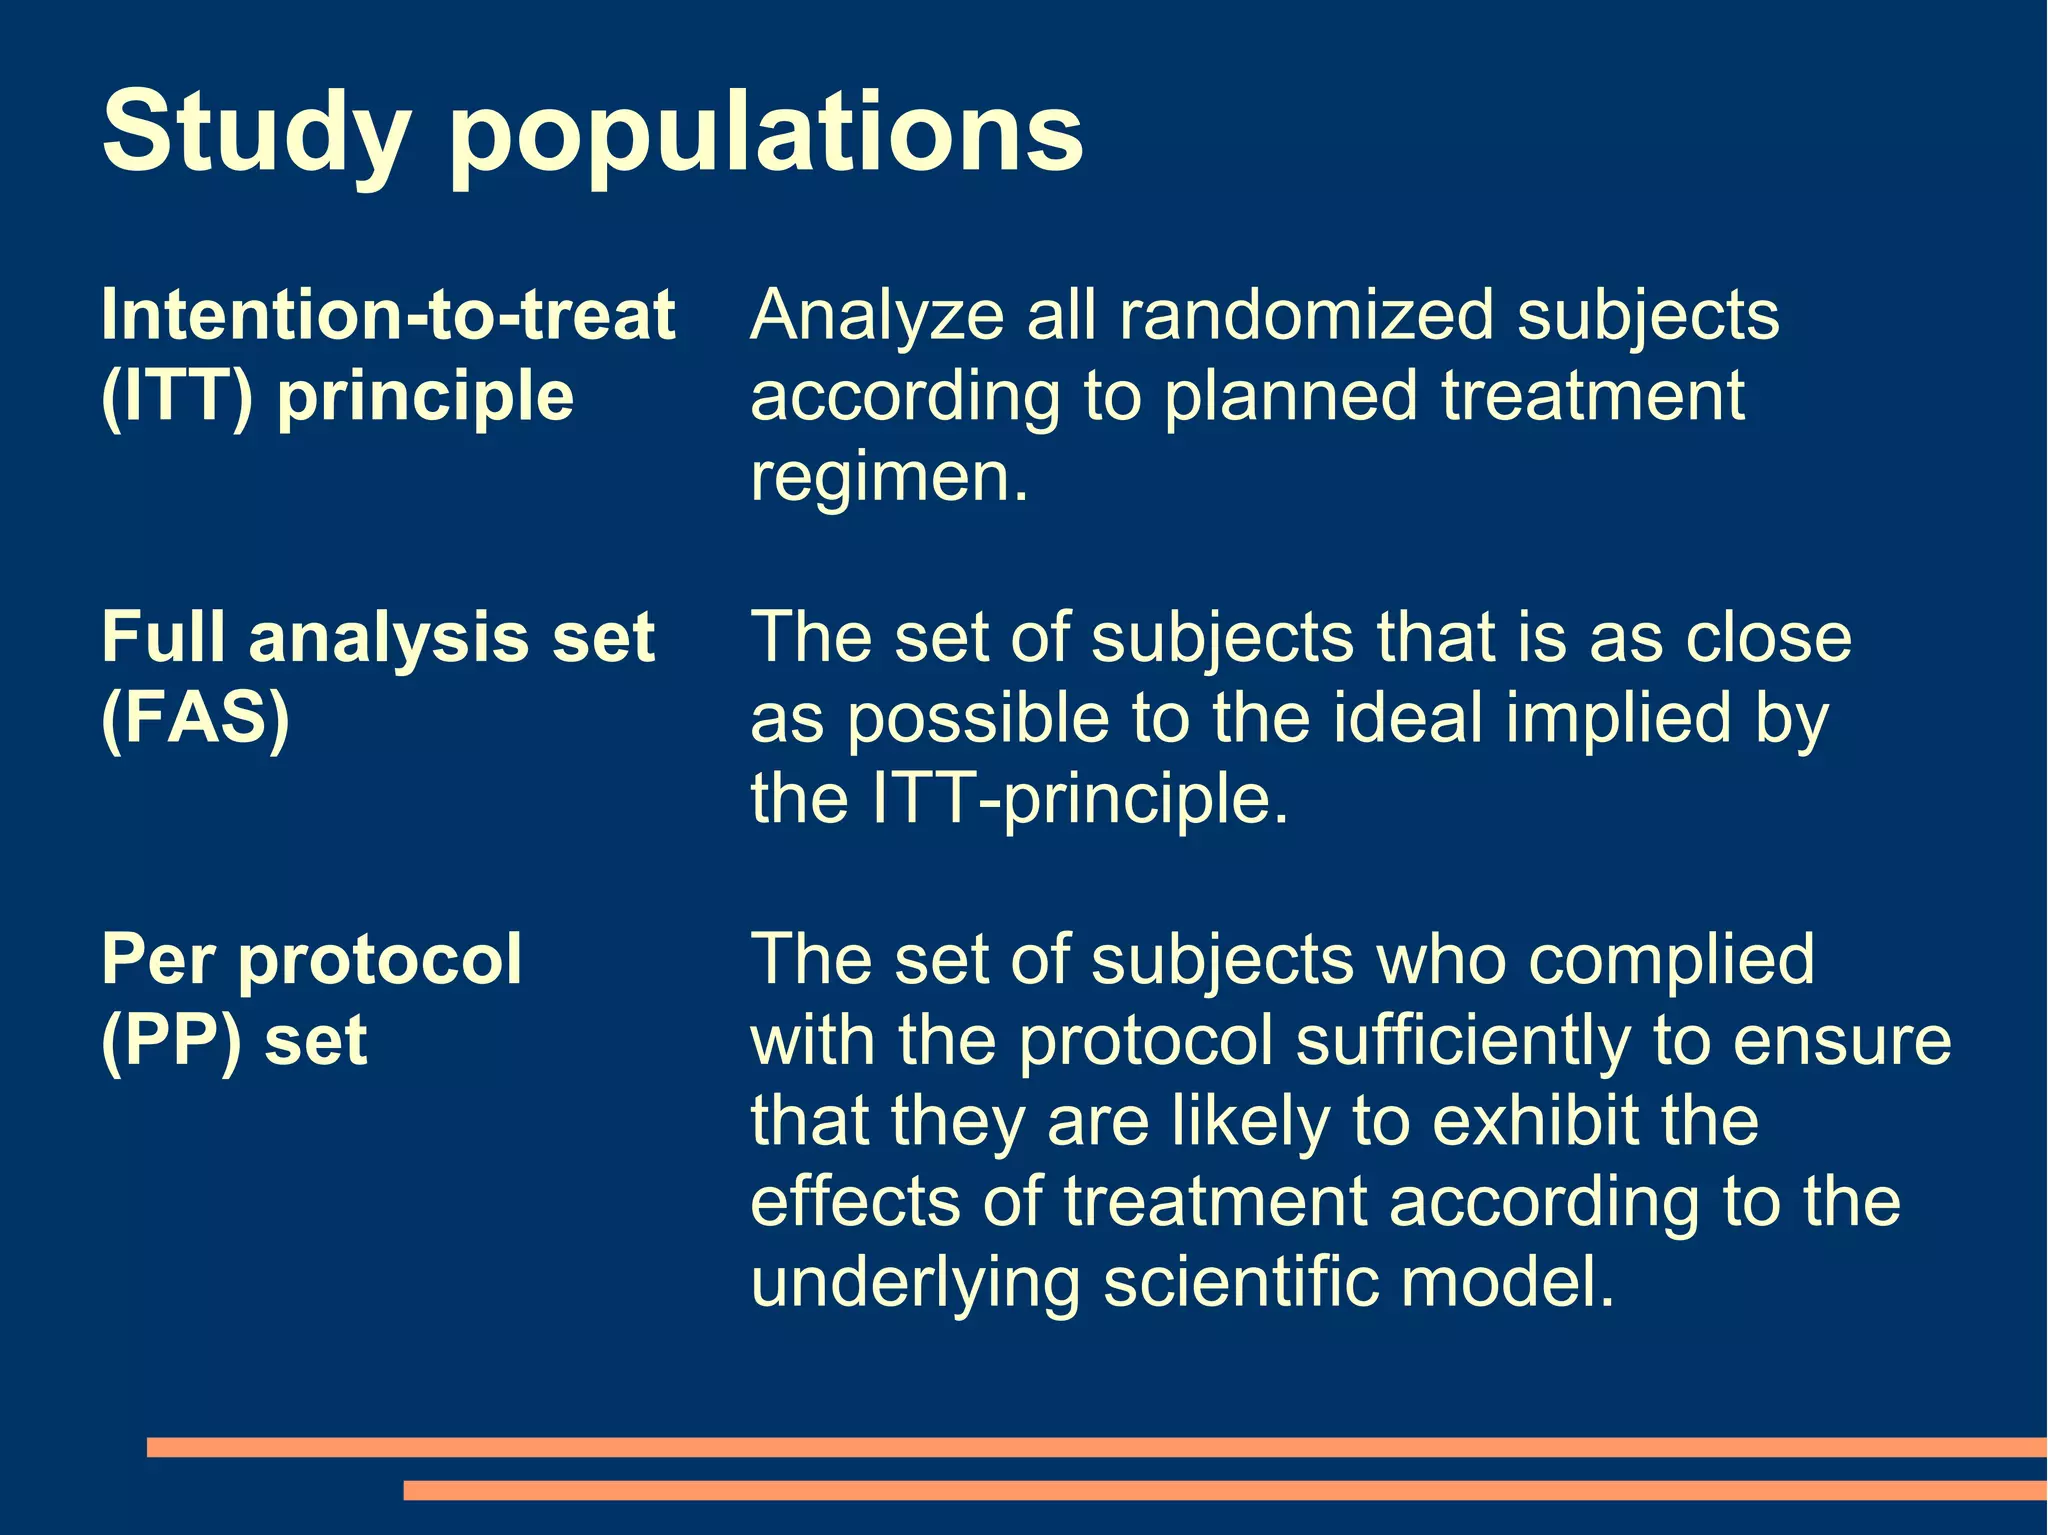

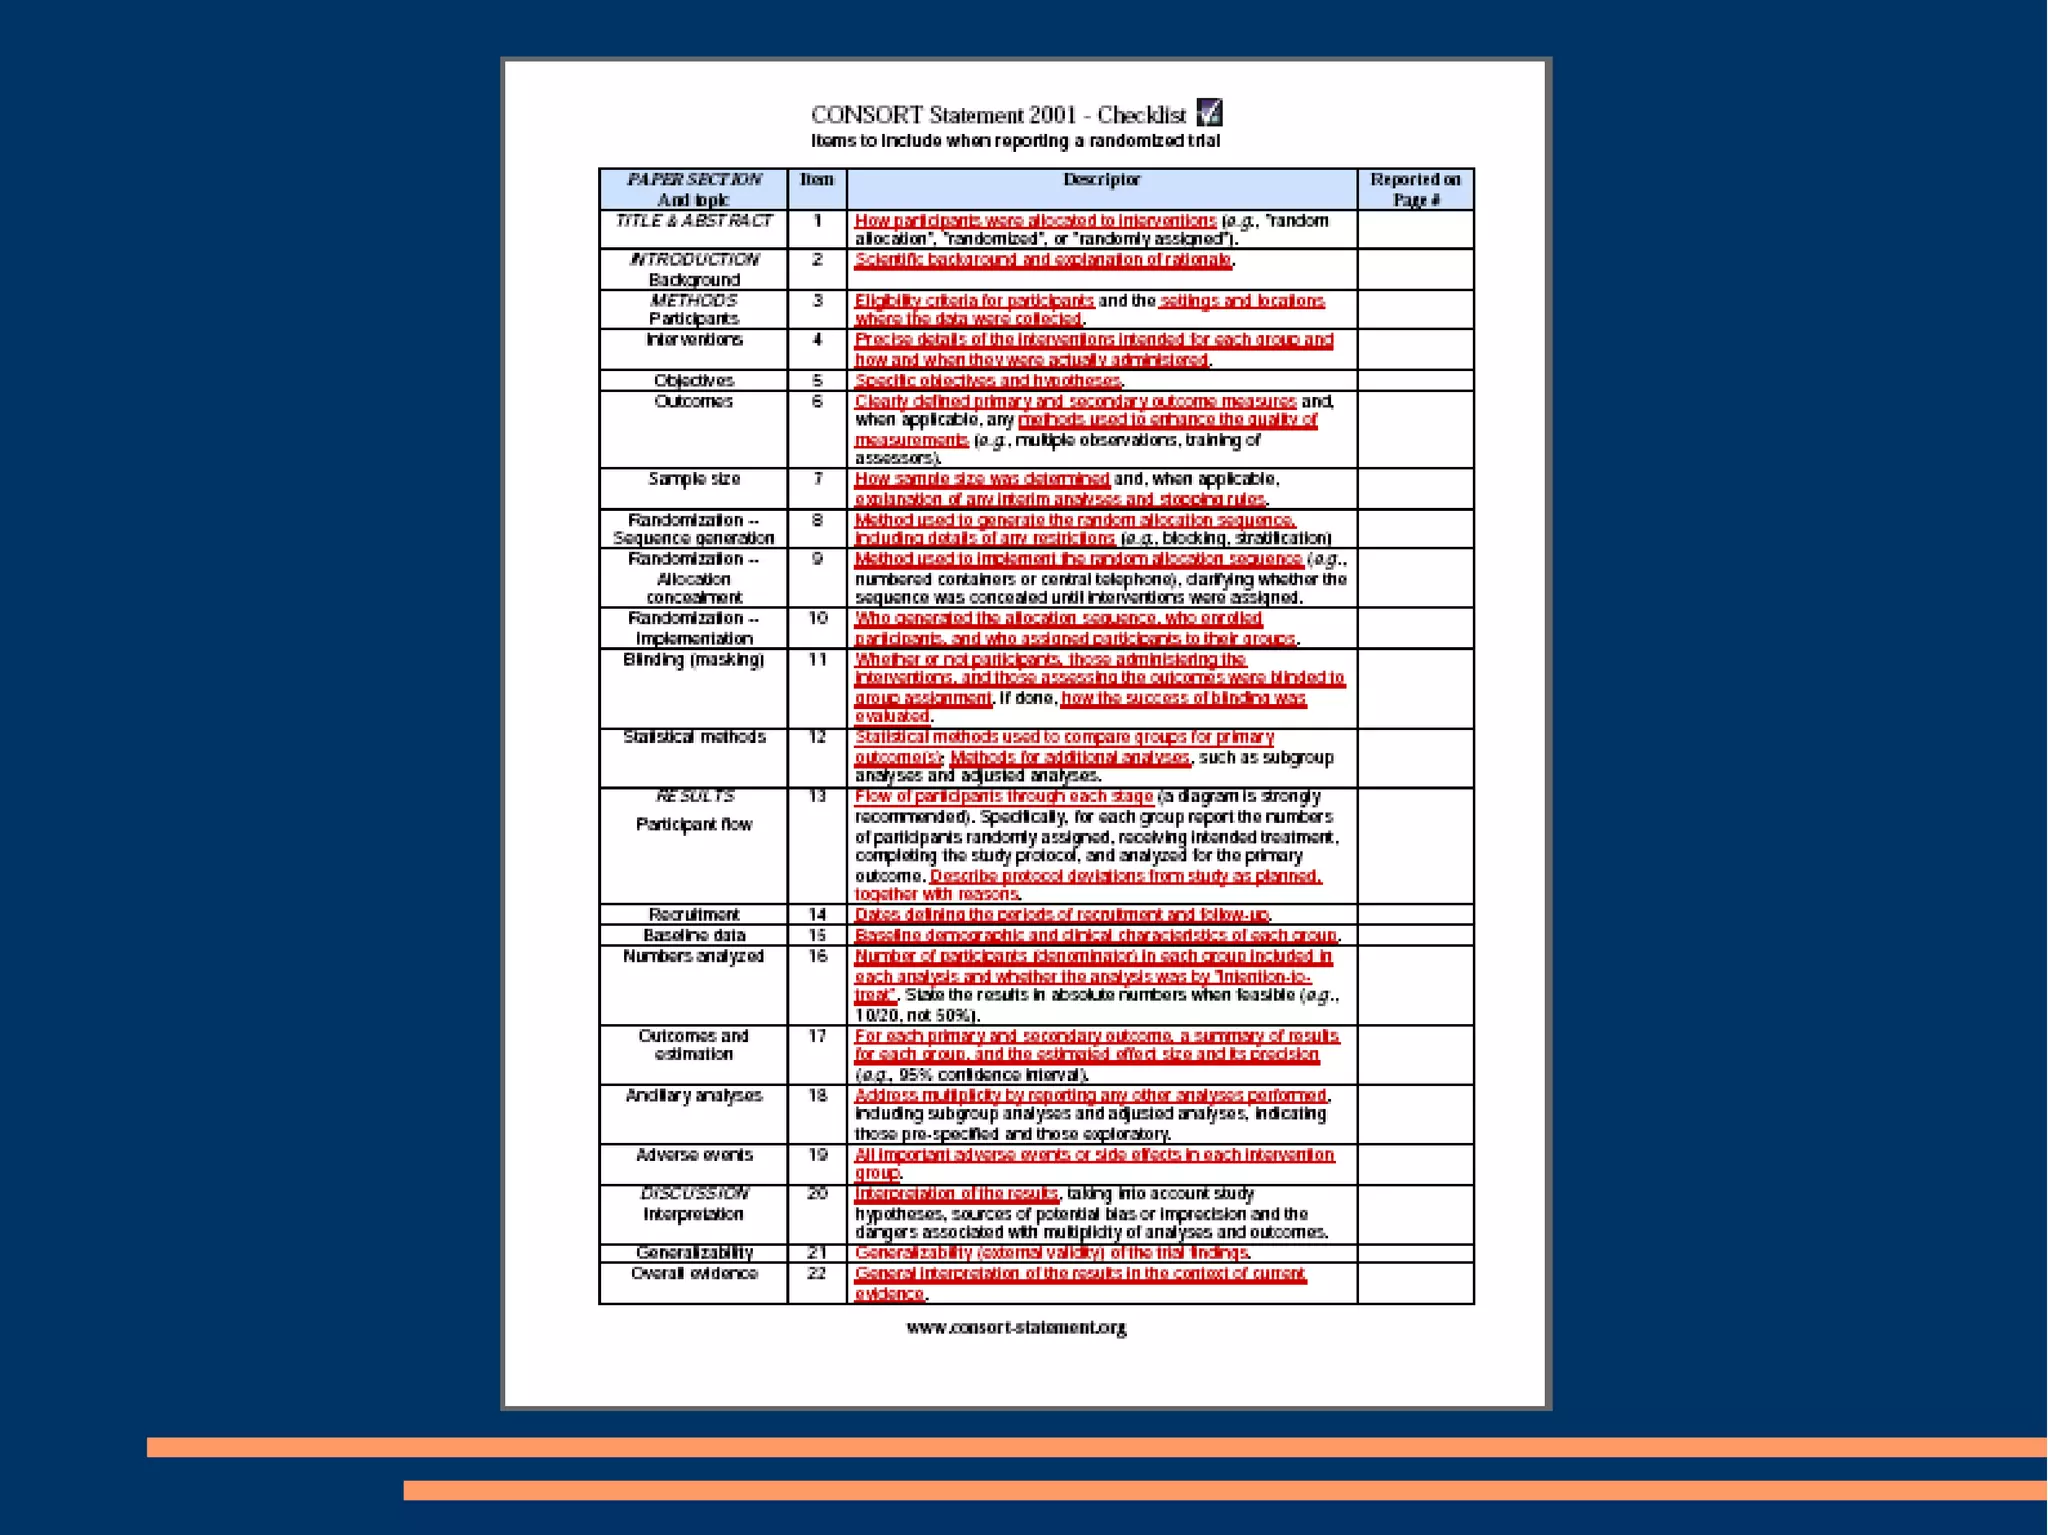


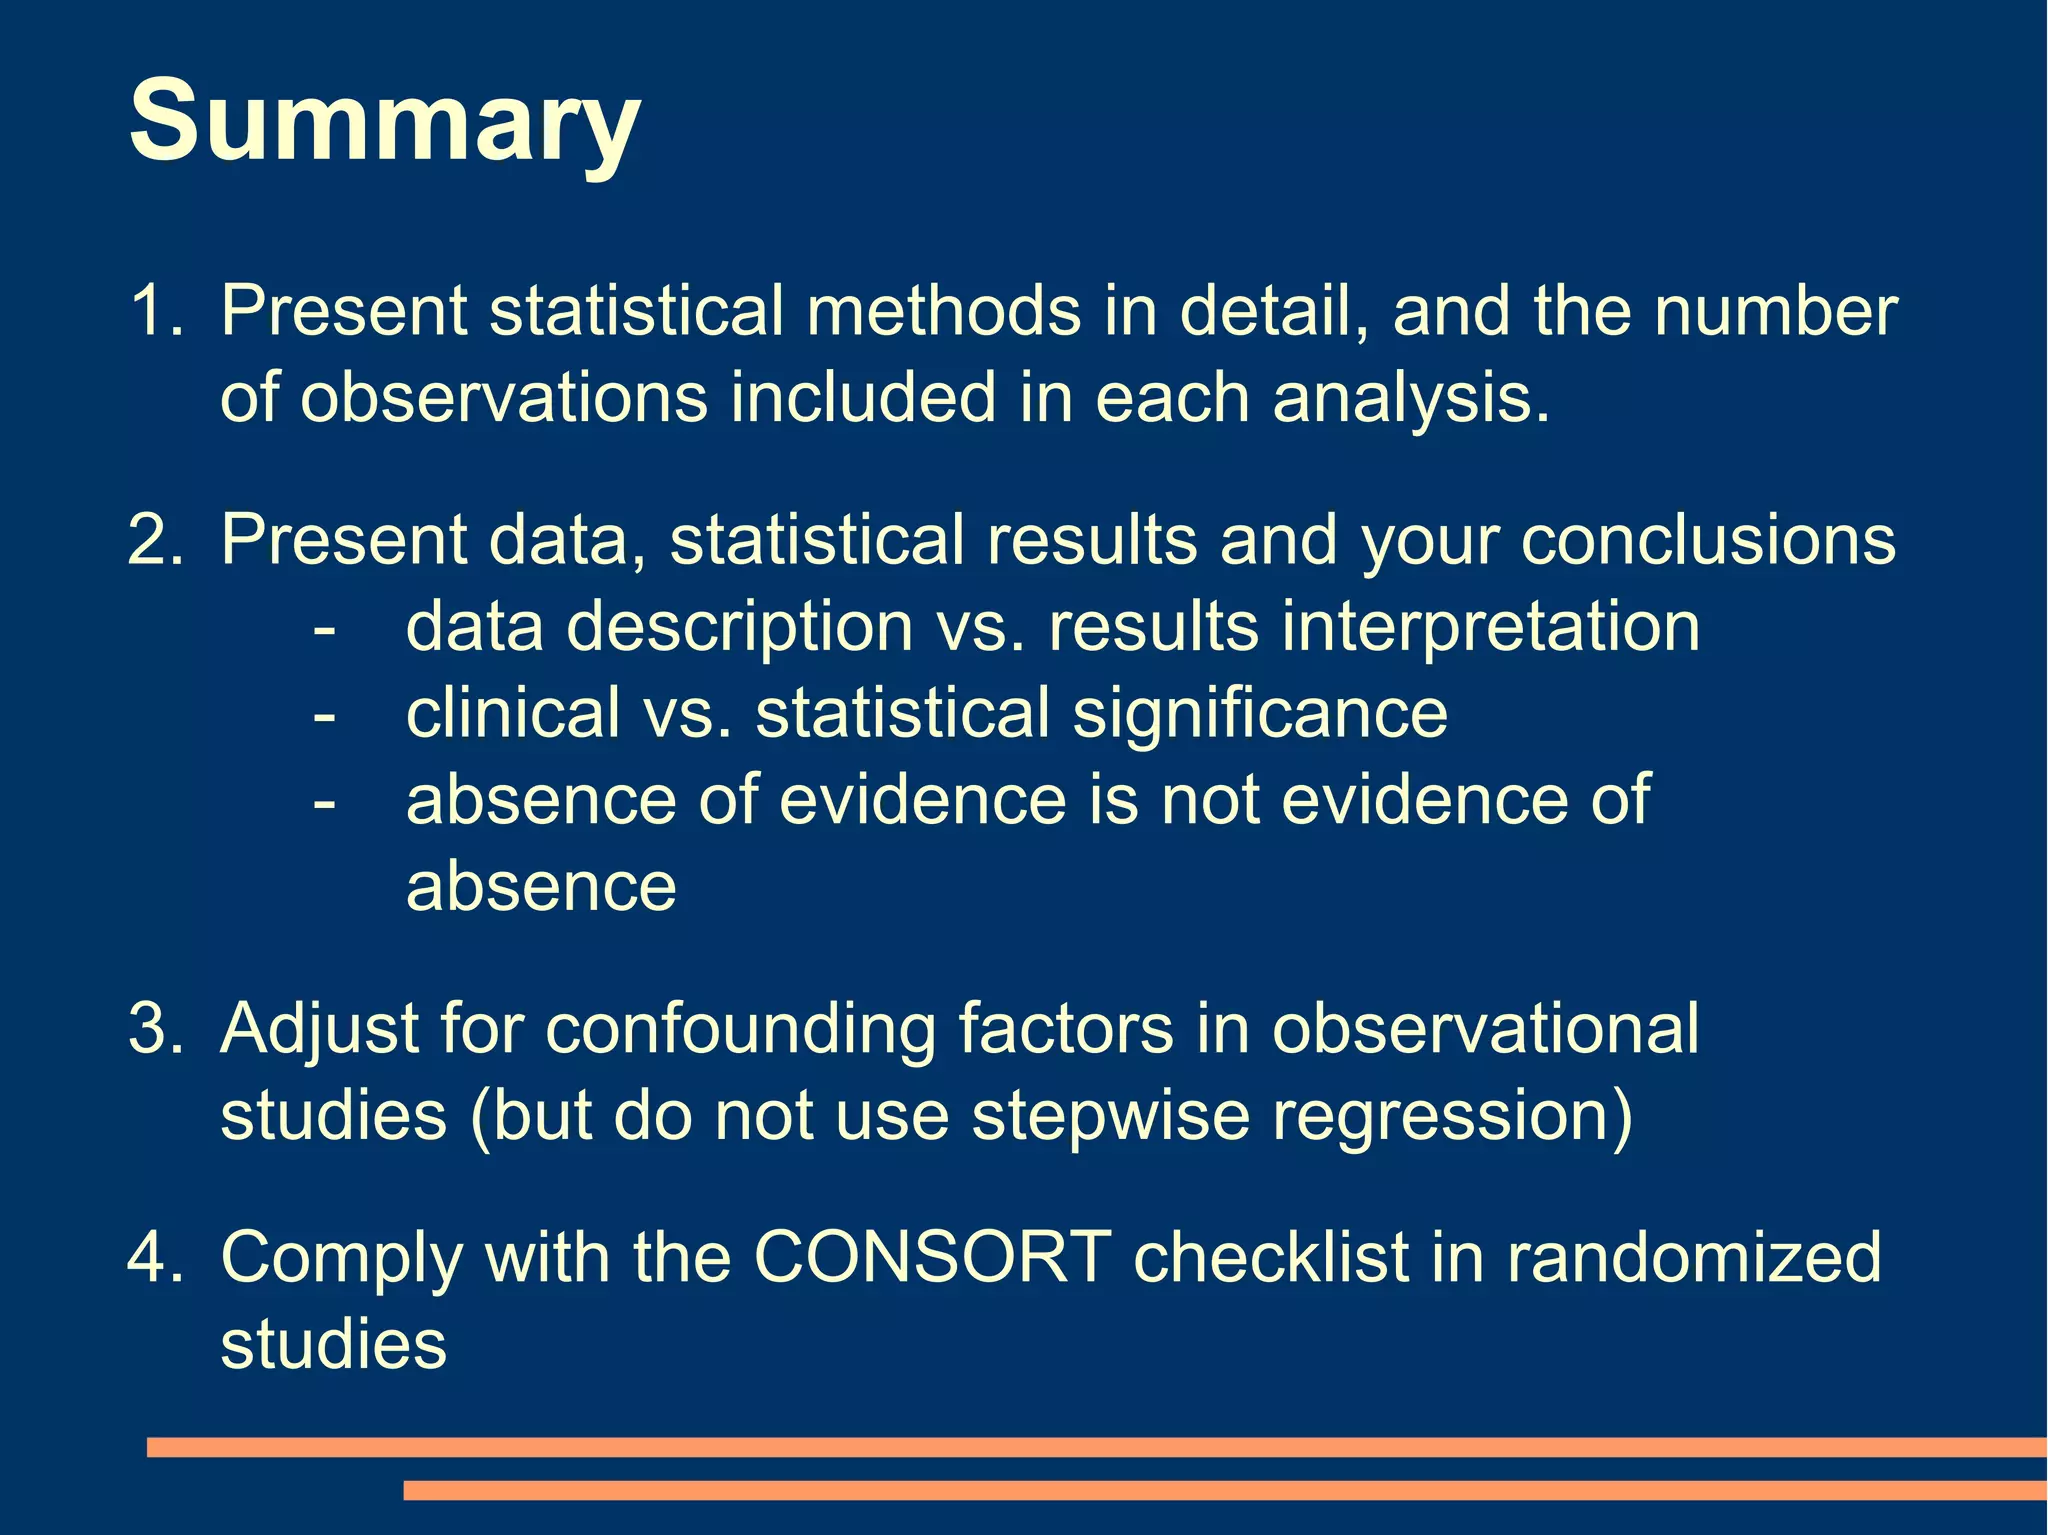


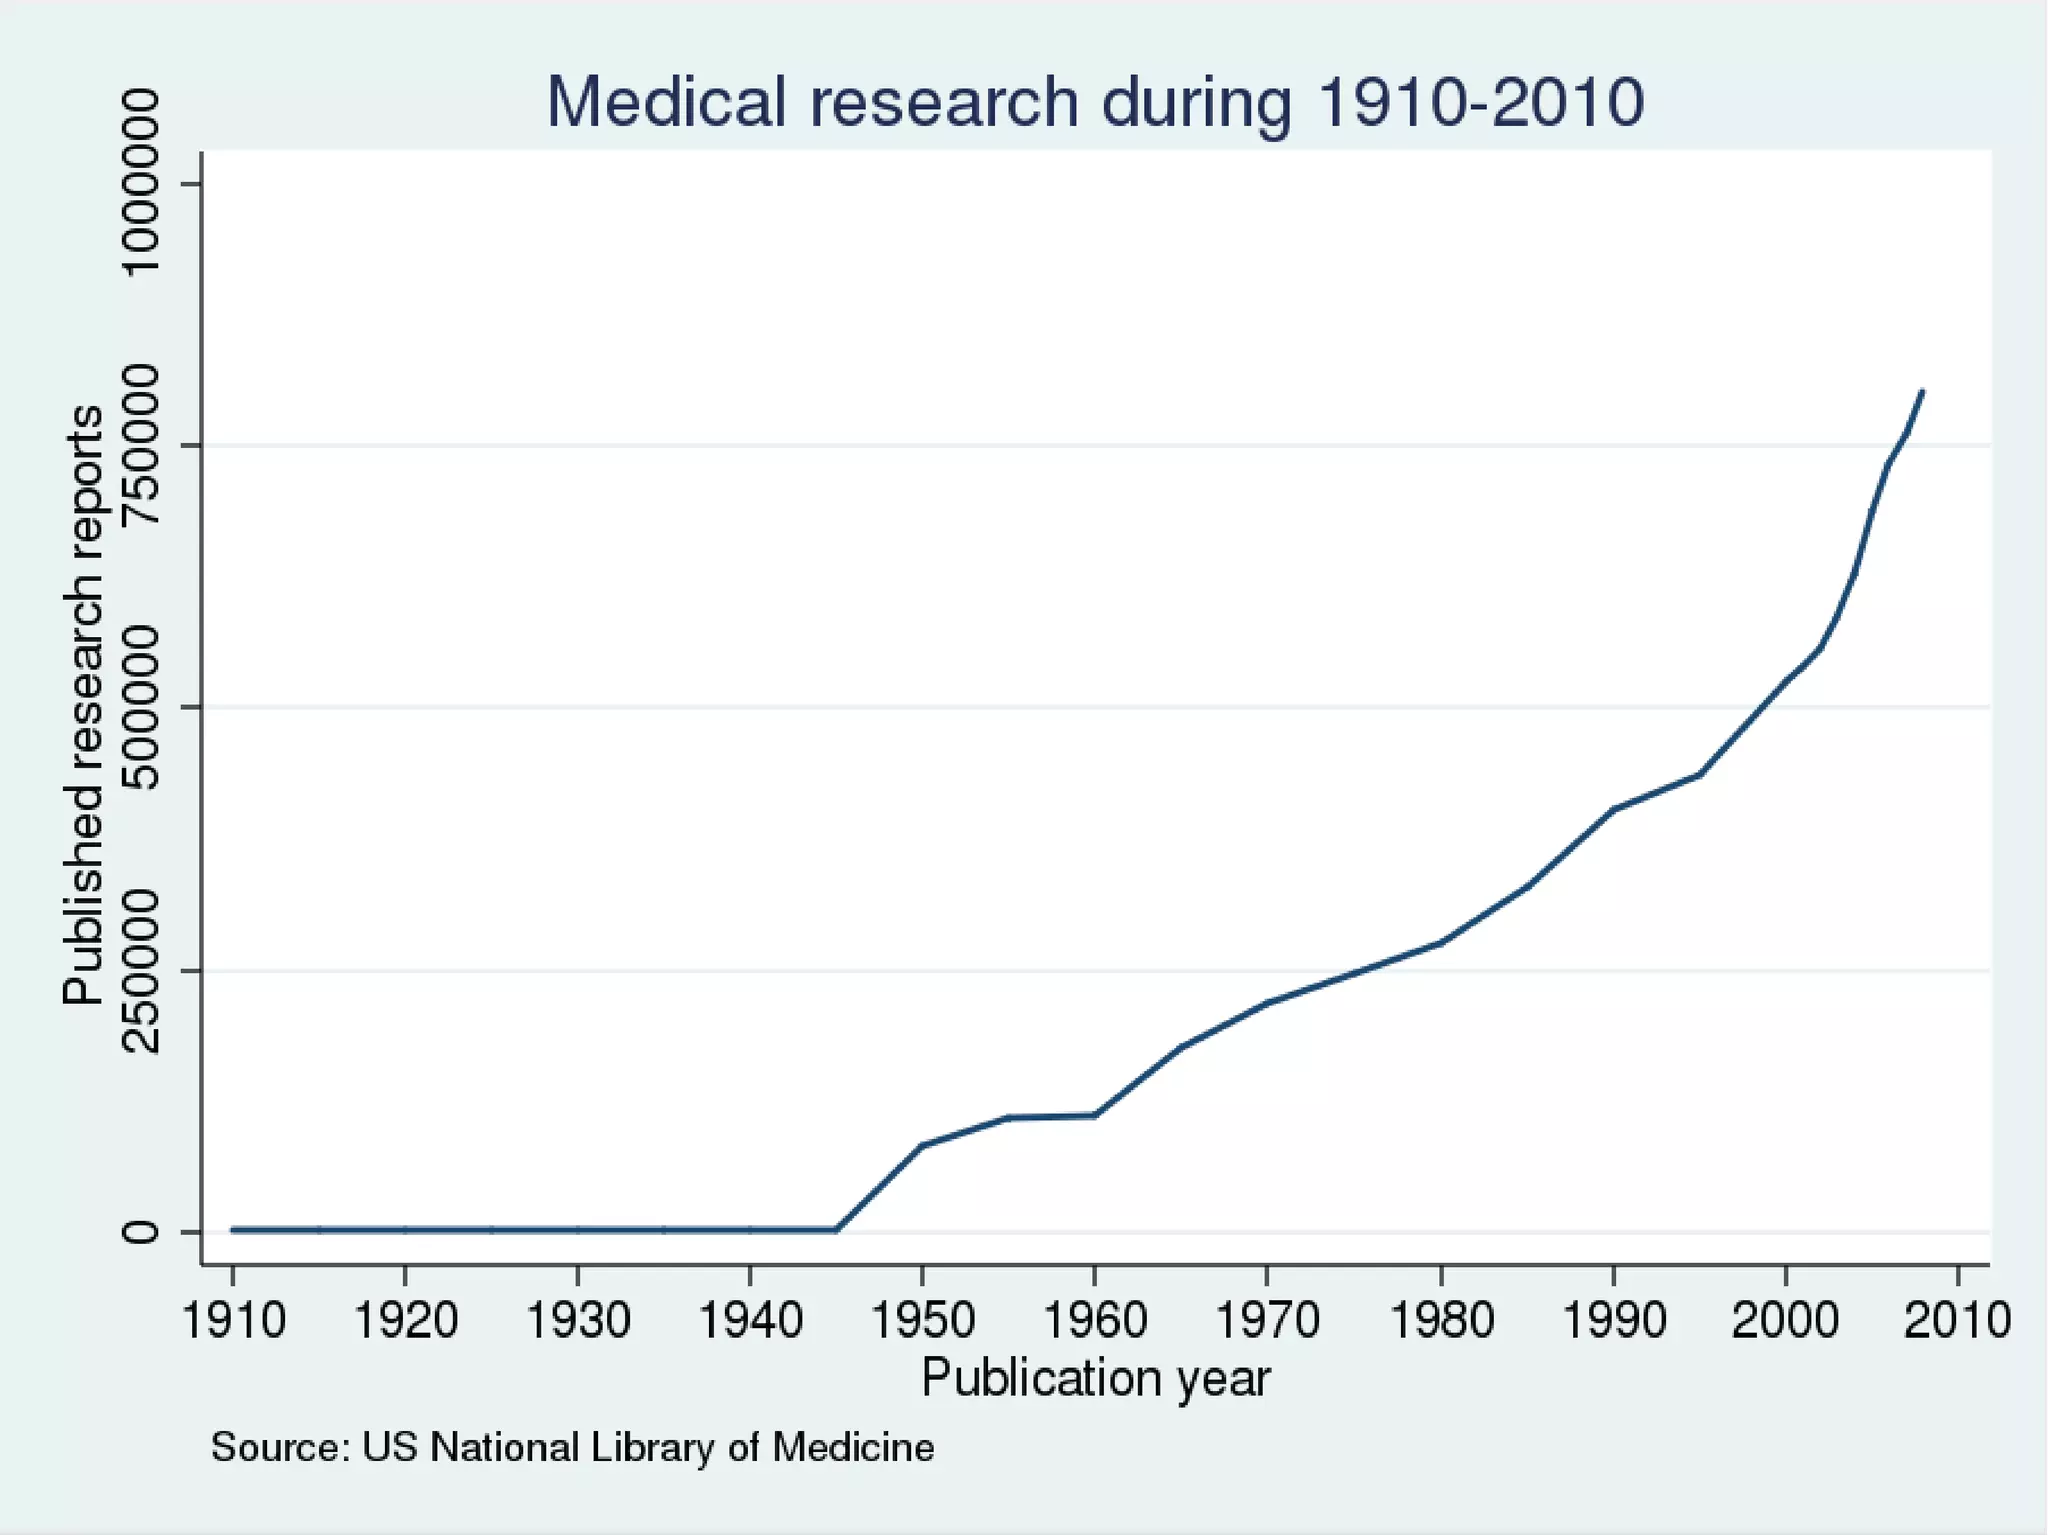
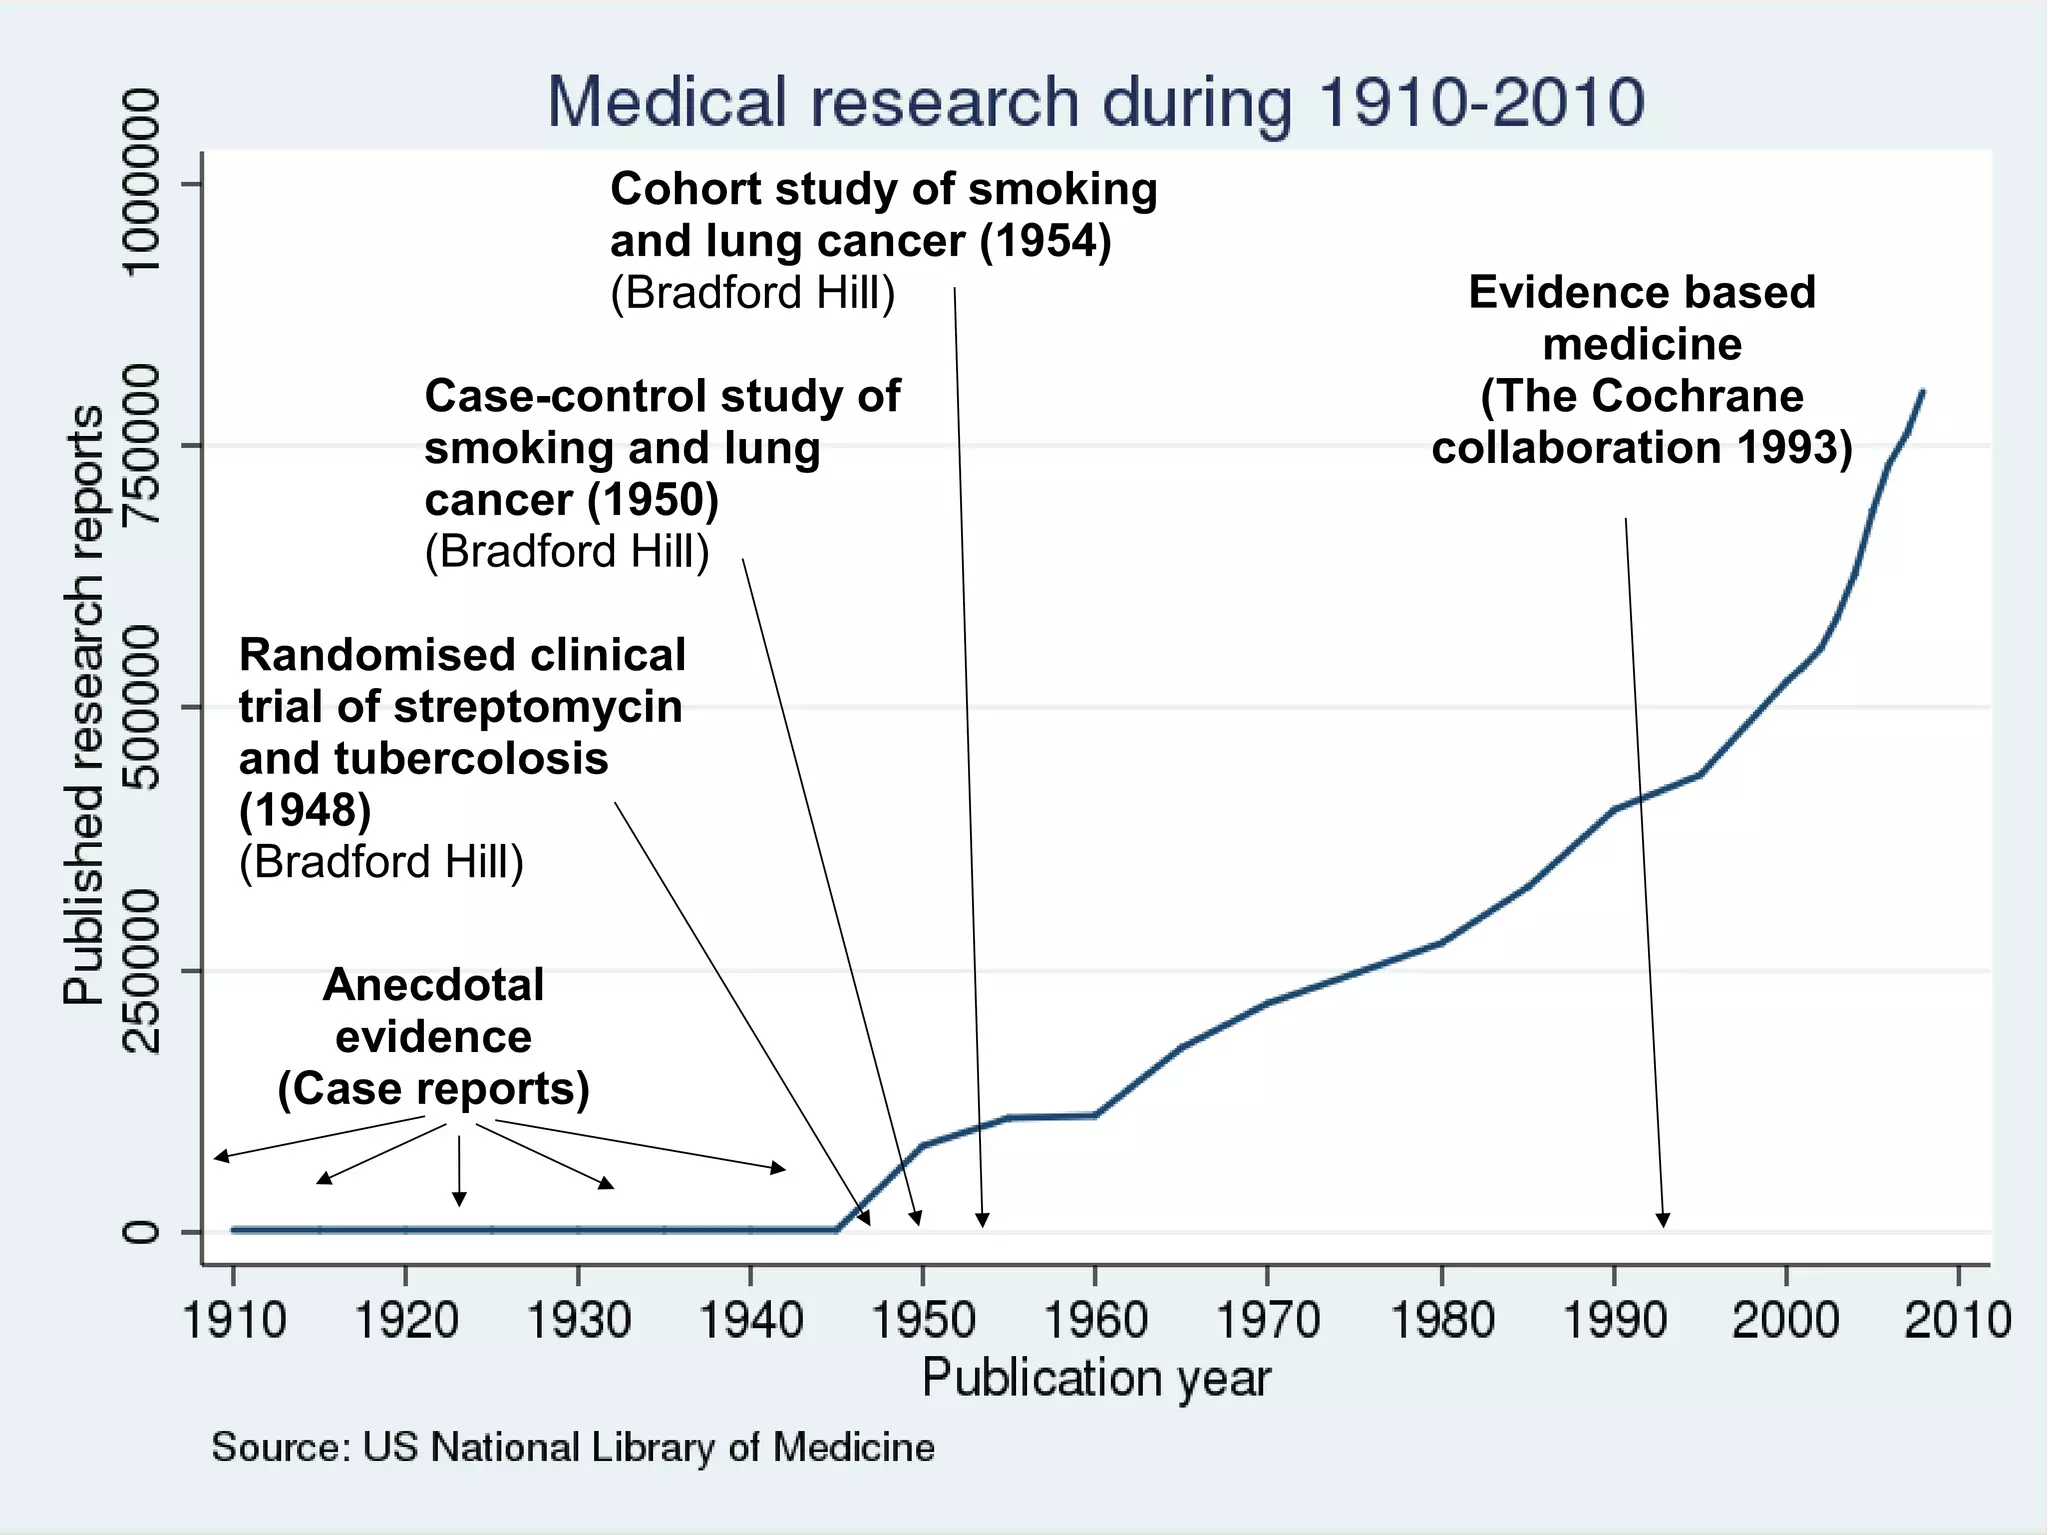
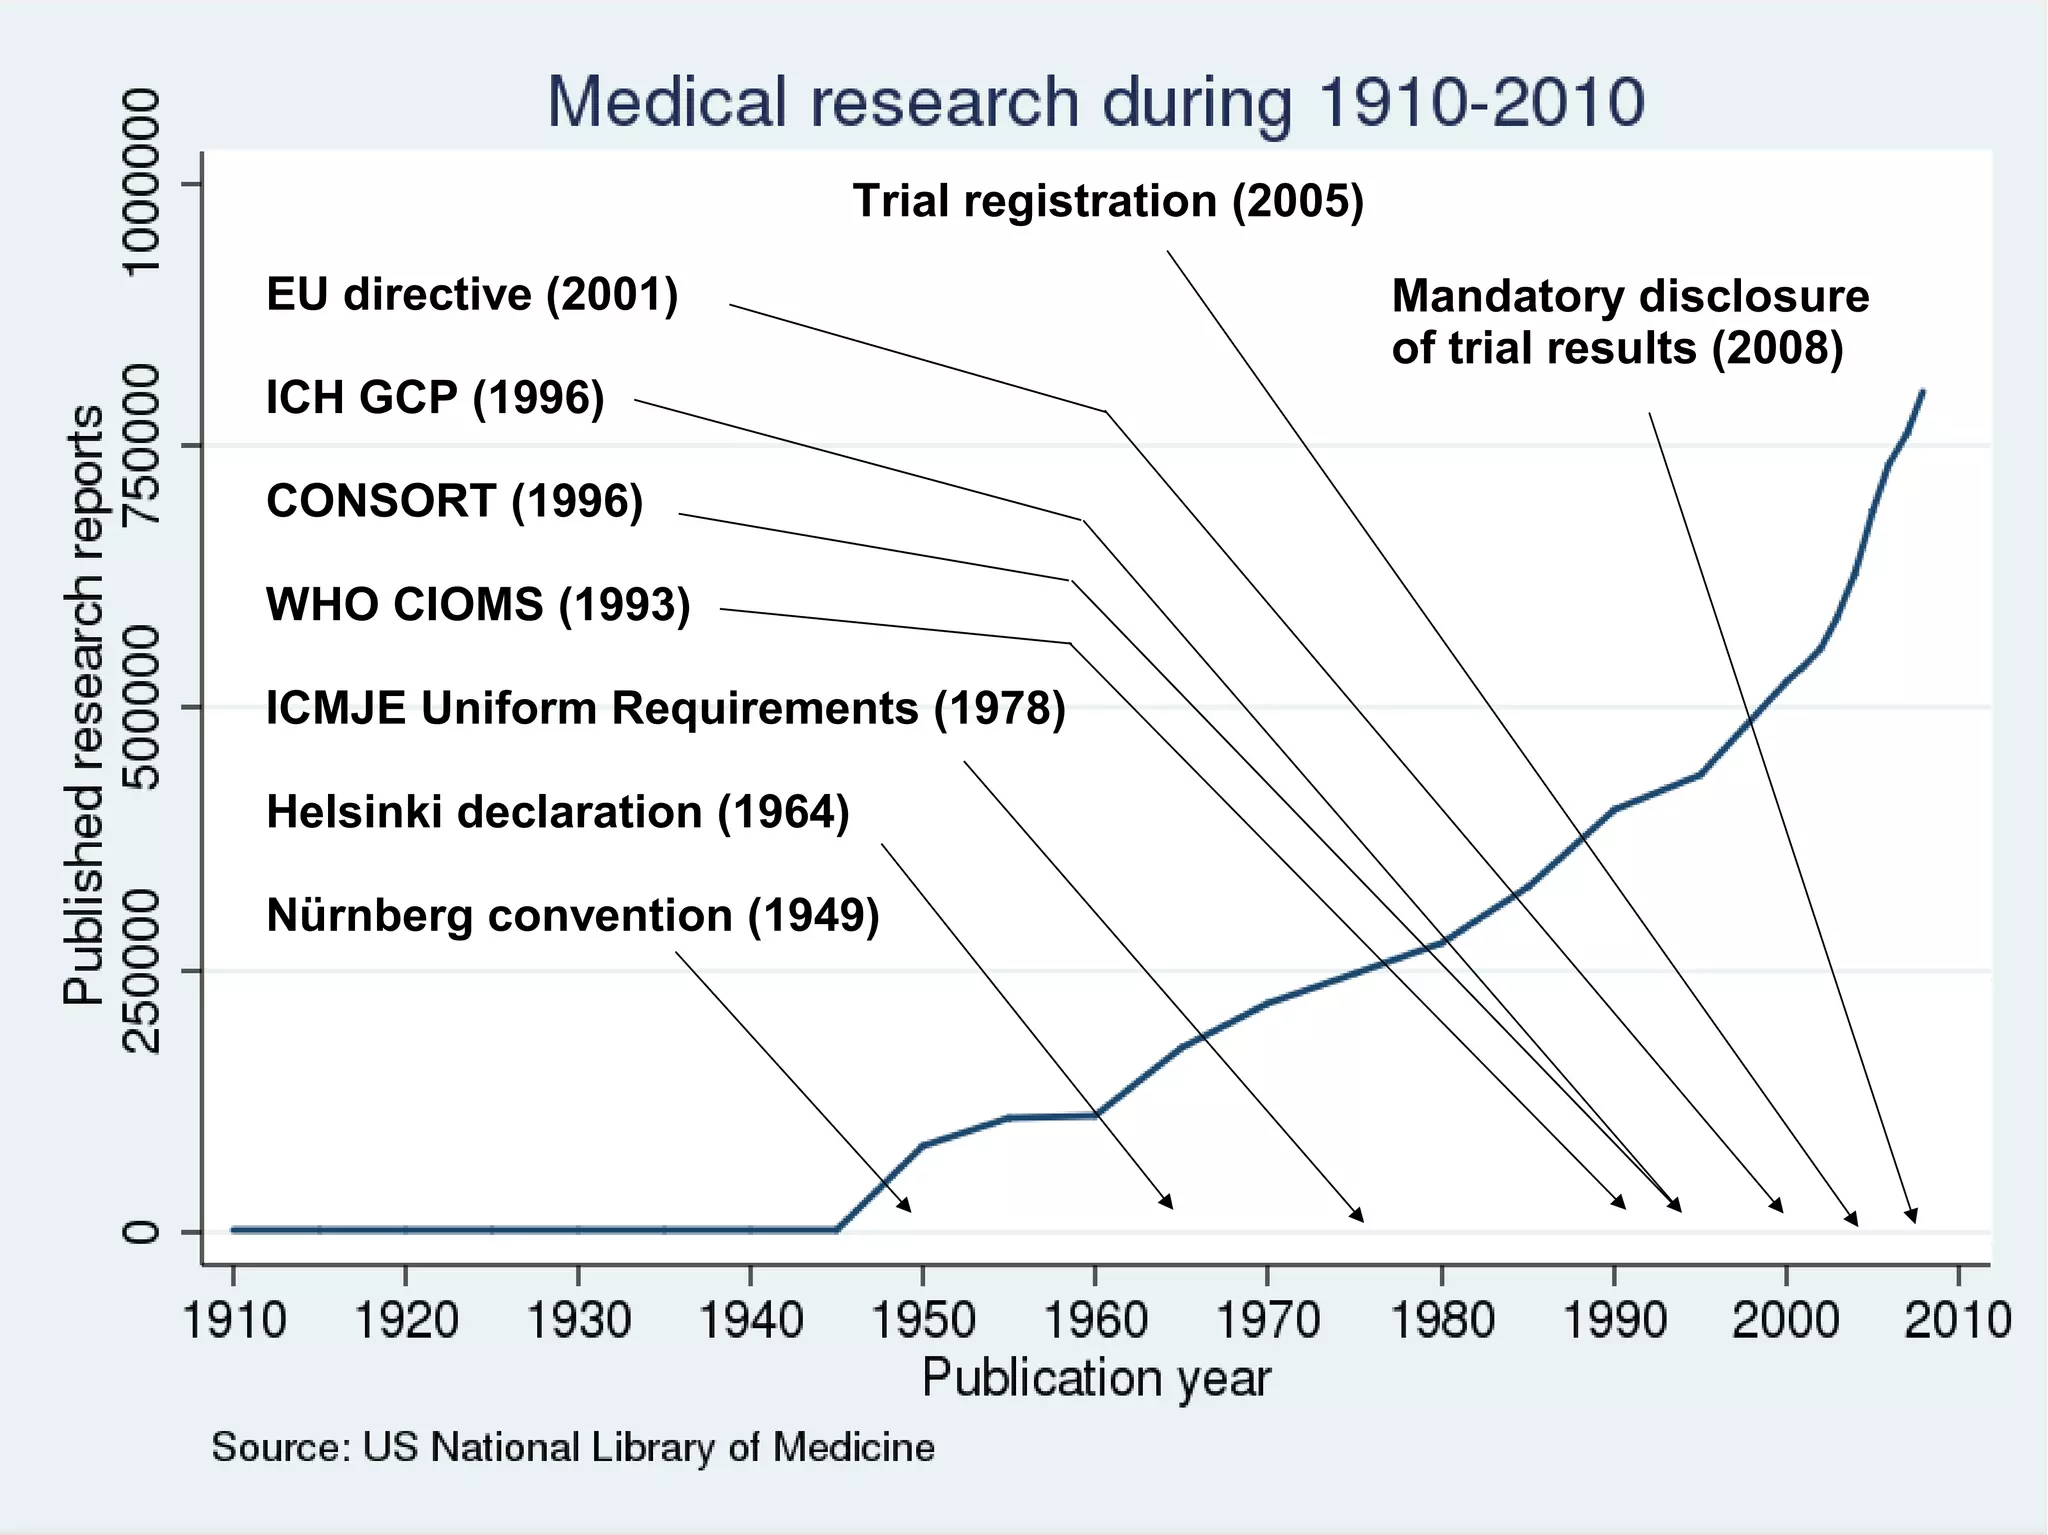
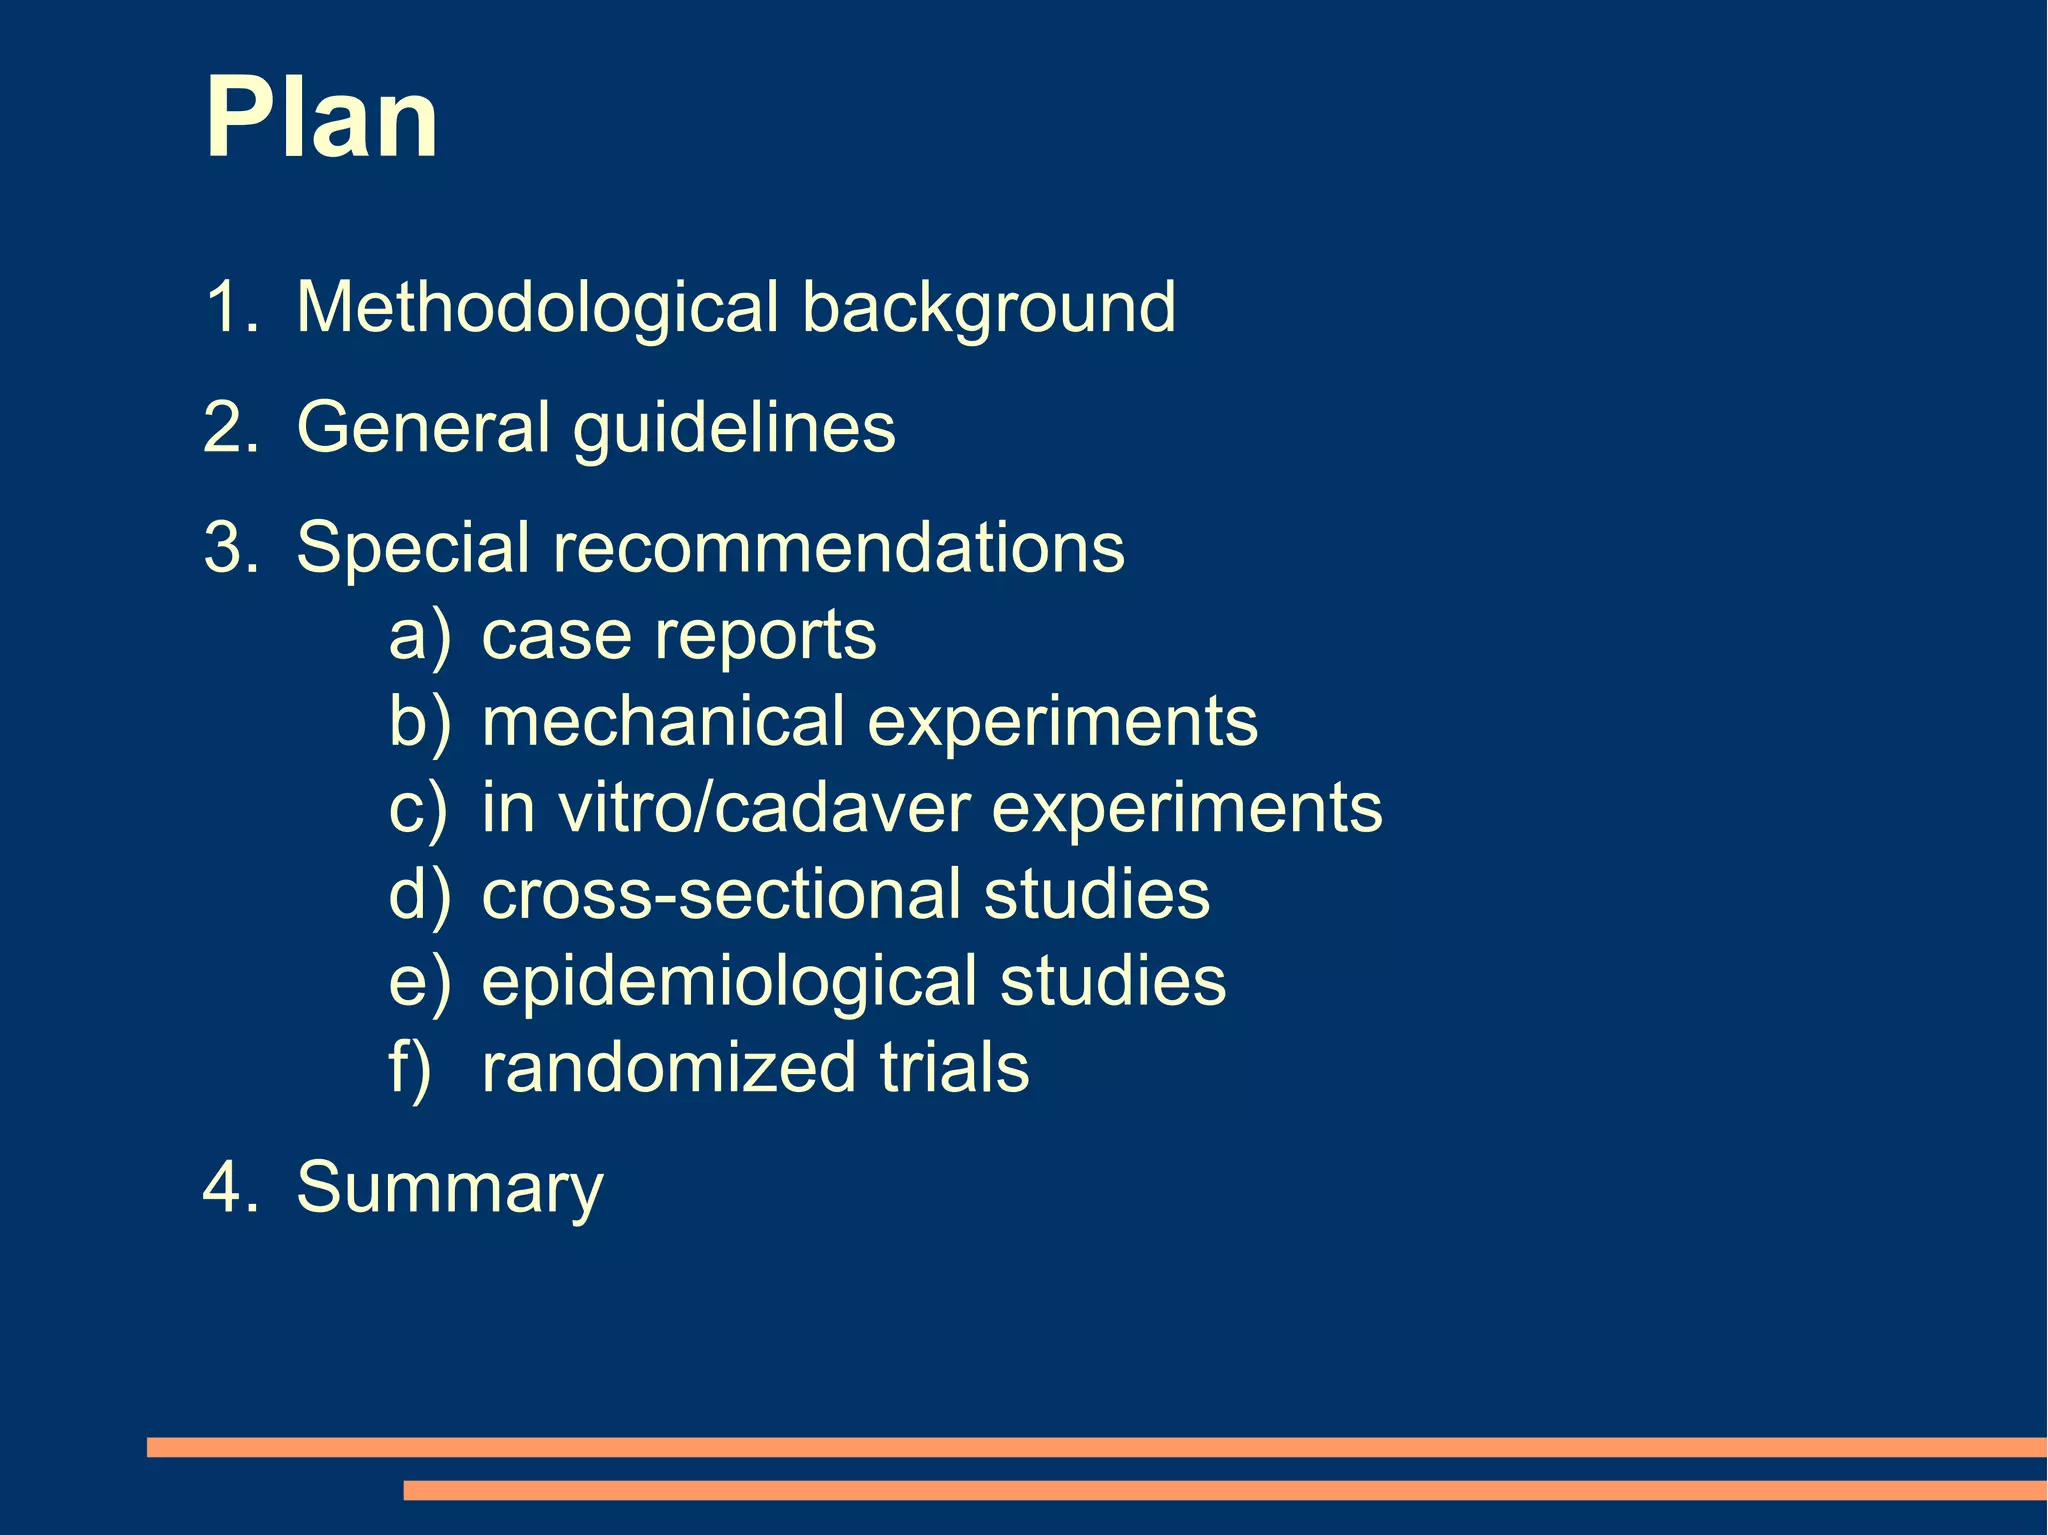
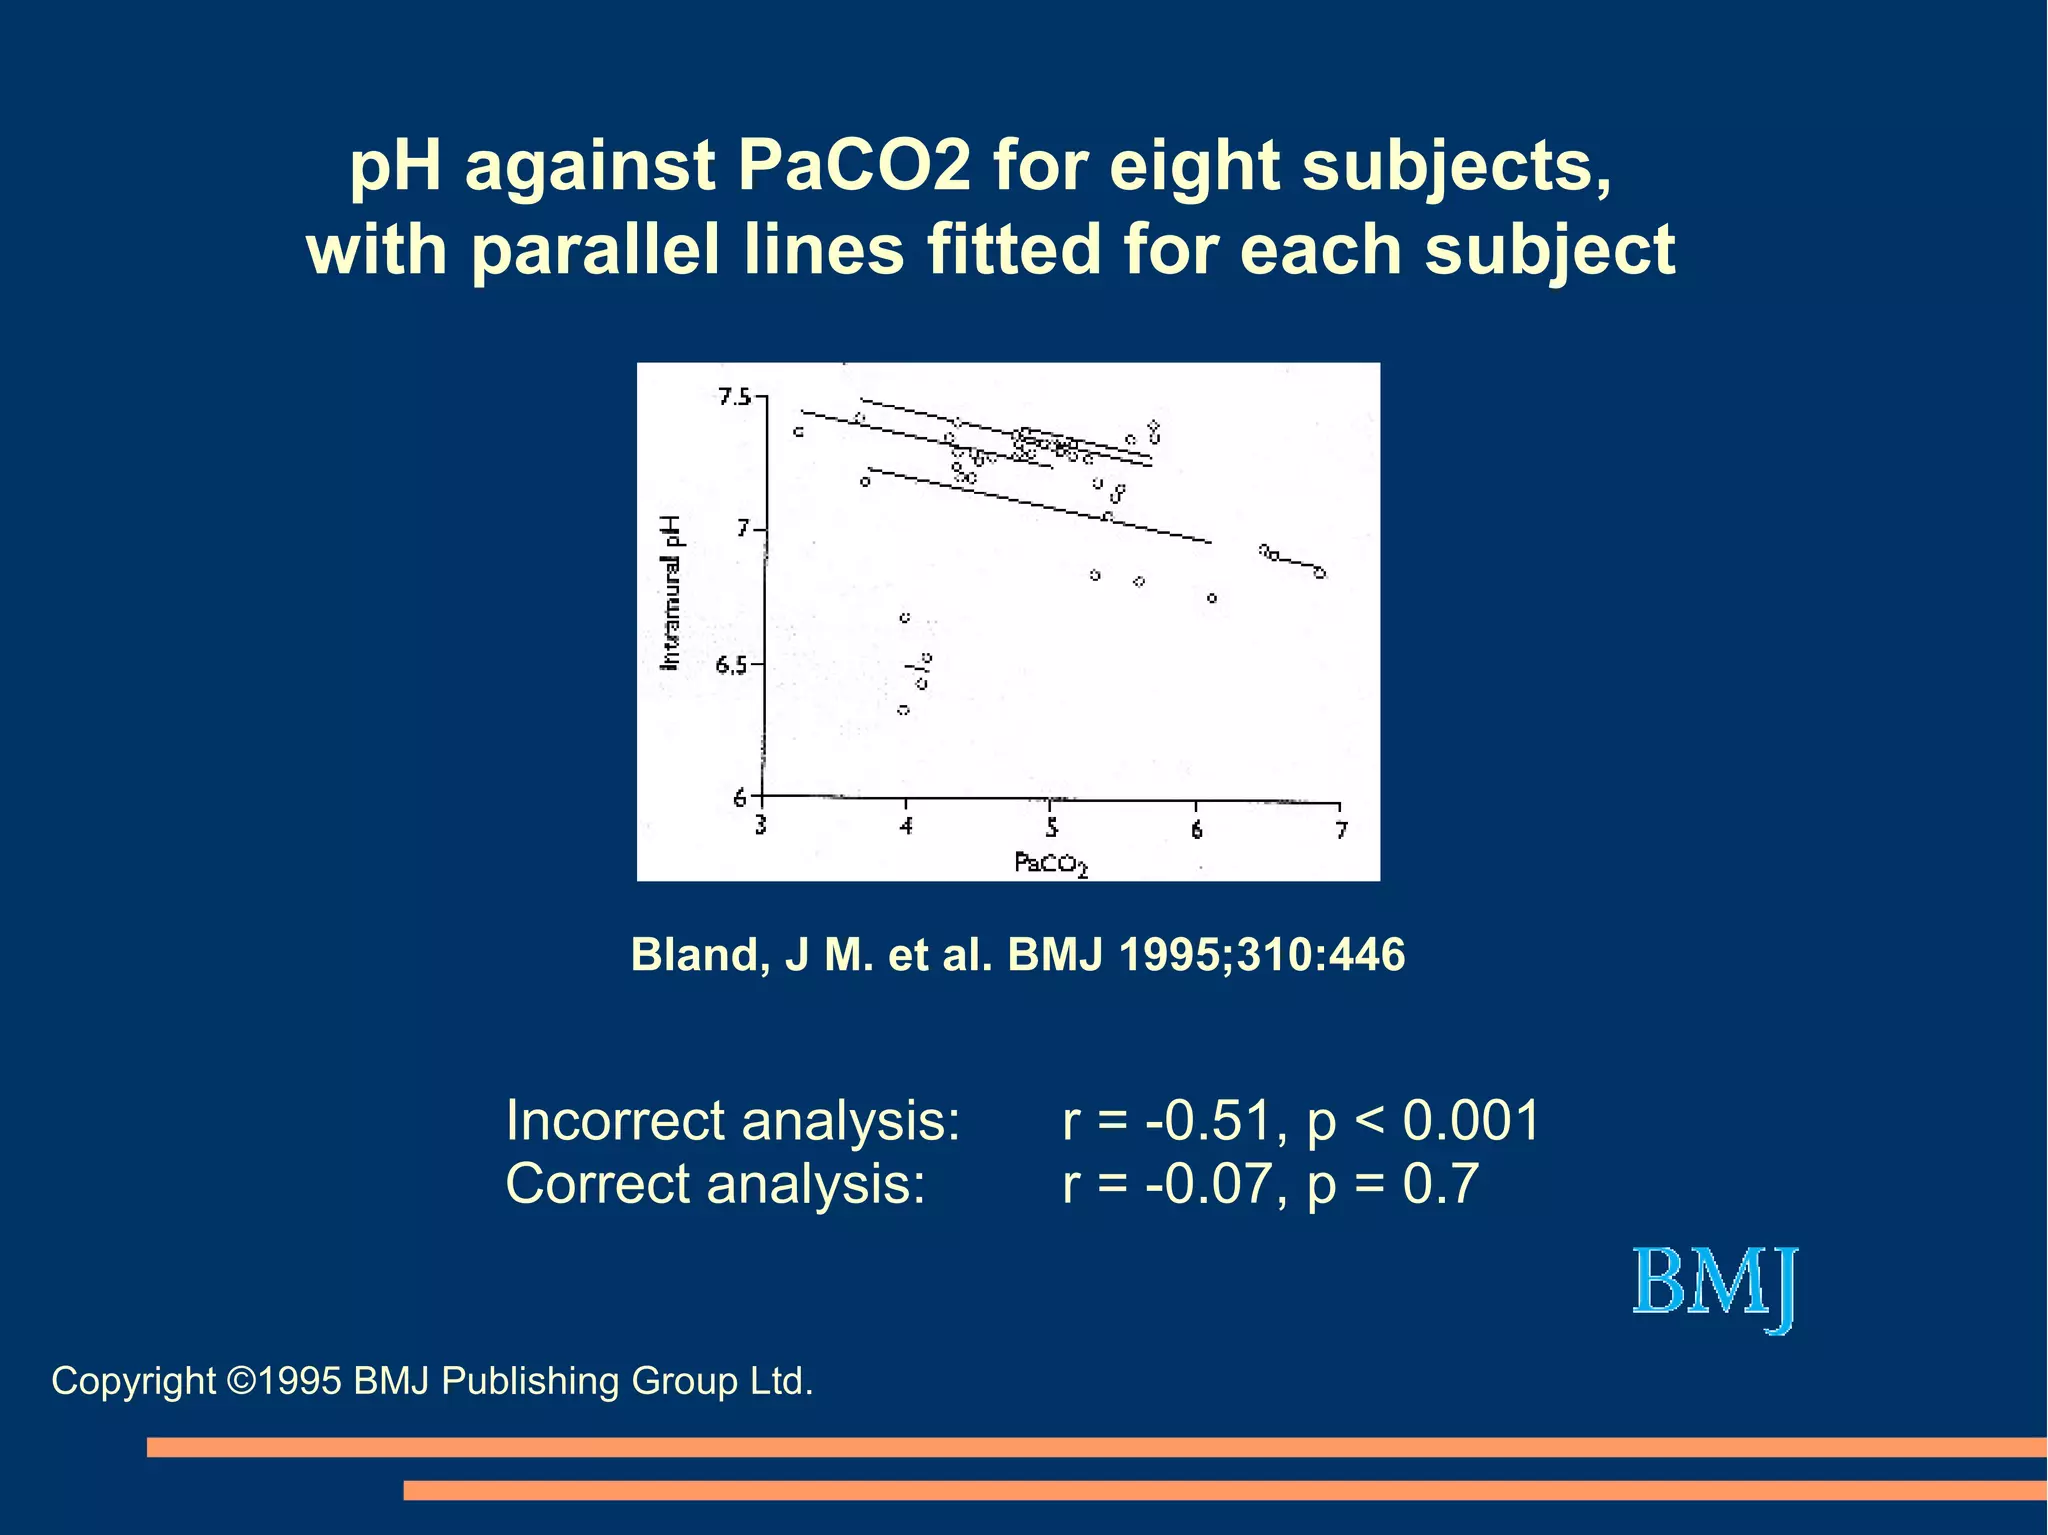
The document provides guidelines for improving statistical analysis and reporting in research manuscripts submitted for publication. It discusses key methodological concepts like measurement uncertainty, sampling uncertainty, p-values, confidence intervals, and assumptions of statistical tests. It provides special recommendations for different study designs including case reports, experiments, observational studies, and randomized trials. The document emphasizes presenting details of statistical methods, quantifying findings with precision measures, avoiding sole reliance on p-values, adjusting for confounding, and following reporting guidelines for randomized trials.


![RSS 2013 - A re-analysis of the Cochrane Library data]](https://cdn.slidesharecdn.com/ss_thumbnails/rssnewcastle3sep13-140606083345-phpapp02-thumbnail.jpg?width=640&height=640&fit=bounds)


