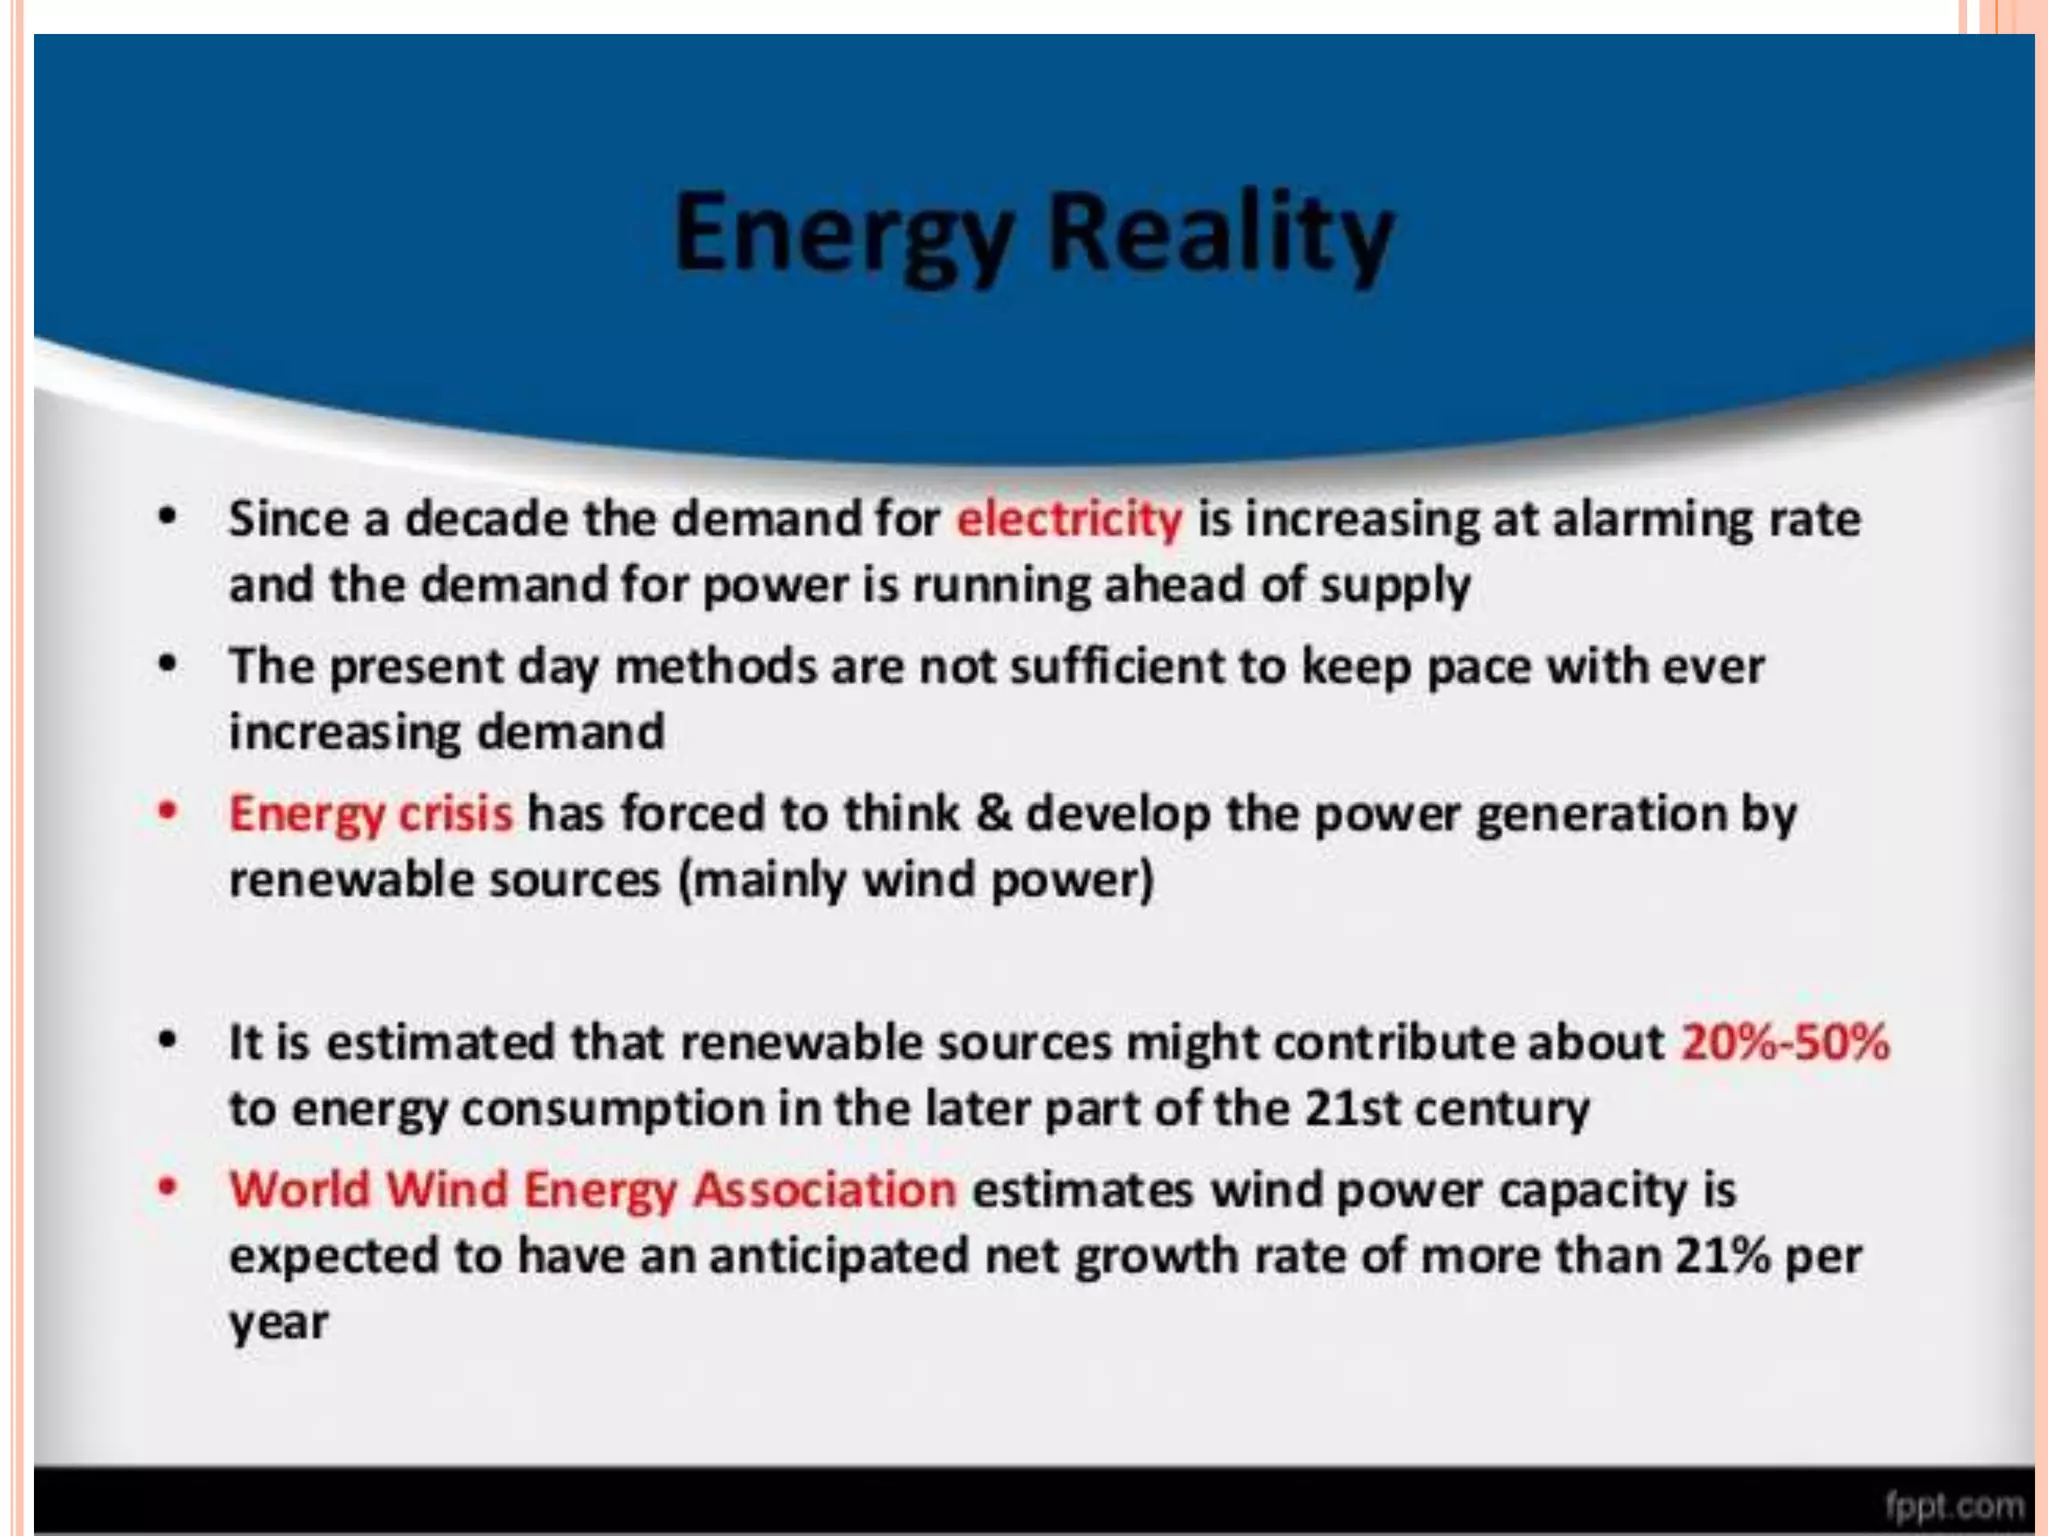
WIND POWER PLANT
Prof. Siraskar G.D.
Mechanical engineering department
PCCOE&R
By David
MacKay's
Wind power generation capacity in India has significantly
increased in recent years. As of the end of October 2017 the
total installed wind power capacity was 32.72 GW,
India had the fourth largest installed wind power capacity in the world.
Installed wind power capacity and generation in India since 2007
Financi
al year
09-10 10-11 11-12 12-13 13-14 14-15 15-16 16-17
Installe
d
capacit
y (MW)
13,064 16,084 18,421 20,150 22,465 23,447 26,777 32,280
Genera
tion
(GWh)
28,214 28,604 46,011
•Tamil Nadu has become a leader in Wind Power in India. In
Muppandal windfarm the total capacity is 1500 MW
•Maharashtra is one of the prominent states that installed
wind power projects second to Tamil Nadu in India. As of end
of March 2016, installed wind power capacity is 4655.25 MW
Ran
k
Power plant Producer Location State MWe
1
Muppandal
windfarm[26]
Muppandal
Wind
Kanyakumari Tamil Nadu 1500
2
Jaisalmer Wind
Park[27]
Suzlon
Energy
Jaisalmer Rajasthan 1064
3
Brahmanvel
windfarm[28]
Parakh Agro
Industries
Dhule Maharashtra 528
4
Dhalgaon
windfarm[29]
Gadre
Marine
Exports
Sangli Maharashtra 278
5
Vankusawade Wind
Park
Suzlon
Energy Ltd.
Satara
District.
Maharashtra 259
3, siemens-Gamesa Renewable Energy SWT-8.0-154
First seen in 2011 as a 6MW unit with a rotor diameter of 120 metres,
Siemens twice since upgraded the direct-drive offshore turbine for a
power rating of 8MW with an extended rotor diameter of 154 metres
Power rating 8MW Rotor diameter 154m
Drivetrain Direct-drive IEC Class lB
.
1. MHI Vestas V164 9.5MW: The fortunes of the MHI Vestas joint venture,
created in April 2014, depend largely on the success of this model, the
biggest wind turbine in serial production today
Power rating 9.5MW Rotor diameter 164m
Drivetrain Medium-speed geared IEC Class S
2. Adwen AD-180
Another product of an offshore joint venture - this time between Gamesa
and Areva - the Adwen AD-180 is setting a new benchmark for blade length
at 88.4 metres, 10% longer than even those of the MHI Vestas V164.
Power rating 8MW Rotor diameter 180m
Drivetrain Medium-speed geared IEC Class lB
Wind Power plant:
Classification of wind turbine
•Two blades : 2 MW to 3MW , large wind turbines, with
better material like glass fiber reinforced plastic
•Three blades : 15 kw to 3 MW, speed 300 to 400 rpm
•Multi blades : 20 to 30 blades, 60 to 80 rpm
Vertical axis
•Savonius rotor:/ s –rotor: ,
hollow elliptical cylinder sliced in
two pieces and each of these
halves fixed to a vertical axis with
fixed gap
•Darrieus types rotor : two or
three convex shaped blades with
aerofoil cross-section along with
their length the blades are curved
into shapes called troposkein.
•Advantages over horizontal: no
orientation in the direction of wind
•can work at low speed up to 8 kmh
where as horizontal need 16 kmh
•No big structure required
Vertical axis wind turbine:
•Does not need yaw control mechanism since vanes of wind
mill can accept the wind from any direction
•Does not require big support tower , as gear box generator
mounted on ground
•Cost is less
•Cost of maintenance is low
•Height of tower 100 m
•Hollow shaft supported by two bearings
•Upper platforms supported by six guy ropes
Horizontal axis wind turbine:
•2 to 3 blades FRP
•Diameter of rotor 2 to 25 m modern up to 100 m even up to
180 m
•Automatic electromagnetic brakes if wind speed beyond
design capacity
•The hub, brakes, gear box, generators is housed in box
called nacelle
•Small wind turbine , tail vane adjust direction of wind blades
in the wind direction
•In big turbine , wind sensors sense the direction and yaw
mechanism adjust the wind blades in wind direction
25 to 40 m, dia, at
speed of 300 to 400
rpm produced 120 kw
power
Power Coefficient - It's an Efficiency
I would like to call it (and some people do) overall turbine system efficiency. The
wind power industry often calls it the Power Coefficient, and gives it the
symbol Cp.
The technical and product literature is now full of it (the term Cp I mean), so
Power Coefficient it shall be for the rest of this page.
Power Coefficient - An Indicator of Total Wind Turbine System Efficiency
The term Power Coefficient is commonly used to designate the efficiency of the
entire turbine power system. As shown in the expression below, it is generally
defined as the ratio of the "electrical power produced by the wind turbine" (Pout in
the formula below) divided by the "wind power into the turbine" (Pin). Pin is
sometimes also called "available wind power". But I don't really like that
expression because the total power in the wind is never really totally "available".
The tip-speed ratio, X, or TSR for wind turbines is the ratio
between the tangential speed of the tip of a blade and the
actual speed of the
Cost of wind mill = 4 crores / MW
Attempts to develop and refine OTEC technology started in the 1880s. In
1881, Jacques Arsene d'Arsonval, a French physicist, proposed tapping the
thermal energy of the ocean
In 1935, Claude constructed a plant aboard a 10,000-ton cargo vessel moored
off the coast of Brazil. Weather and waves destroyed it before it could
generate net power.[5] (Net power is the amount of power generated after
subtracting power needed to run the system).
In 1956, French scientists designed a 3 MW plant for Abidjan, Ivory Coast. The
plant was never completed, because new finds of large amounts of cheap
petroleum made it uneconomical.[5]
In 1962, J. Hilbert Anderson and James H. Anderson, Jr. focused on increasing
component efficiency. They patented their new "closed cycle" design in
1967.[7] This design improved upon the original closed-cycle Rankine system,
and included this in an outline for a plant that would produce power at lower cost
than oil or coal. At the time, however, their research garnered little attention since
coal and nuclear were considered the future of energy.[6]
Japan is a major contributor to the development of OTEC
technology.[8] Beginning in 1970 the Tokyo Electric Power Company successfully
built and deployed a 100 kW closed-cycle OTEC plant on the island
of Nauru.[8] The plant became operational on 14 October 1981, producing about
120 kW of electricity;
Currently operating OTEC plants[edit]
In March 2013, Saga University with various Japanese industries
completed the installation of a new OTEC plant. Okinawa Prefecture announced
the start of the OTEC operation testing at Kume Island on April 15, 2013. The
main aim is to prove the validity of computer models and demonstrate OTEC to
the public. The testing and research will be conducted with the support of Saga
University until the end of FY 2016. IHI Plant Construction Co. Ltd, Yokogawa
Electric Corporation, and Xenesys Inc were entrusted with constructing the 100
kilowatt class plant within the grounds of the Okinawa Prefecture Deep Sea
Water Research Center. The location was specifically chosen in order to utilize
existing deep seawater and surface seawater intake pipes installed for the
research center in 2000. The pipe is used for the intake of deep sea water for
research, fishery, and agricultural use.[19] The plant consists of two 50 kW units
in double Rankine configuration.[30] The OTEC facility and deep seawater
research center are open to free public tours by appointment in English and
Japanese.[31] Currently, this is one of only two fully operational OTEC plants in
the world. This plant operates continuously when specific tests are not
underway.
In 2011, Makai Ocean Engineering completed a heat exchanger test facility at
NELHA. Used to test a variety of heat exchange technologies for use in OTEC,
Makai has received funding to install a 105 kW turbine.[32] Installation will make
this facility the largest operational OTEC facility, though the record for largest
power will remain with the Open Cycle plant also developed in Hawaii.
In July 2014, DCNS group partnered with Akuo Energy announced NER 300
funding for their NEMO project. If successful, the 16MW gross 10MW net offshore
plant will be the largest OTEC facility to date. DCNS plans to have NEMO
operational by 2020.[33]
An ocean thermal energy conversion power plant built by Makai Ocean
Engineering went operational in Hawaii in August 2015 . The governor of
Hawaii, David Ige, "flipped the switch" to activate the plant. This is the first true
closed-cycle ocean Thermal Energy Conversion (OTEC) plant to be connected to
a U.S. electrical grid . It is a demo plant capable of generating 105 kilowatts,
enough to power about 120 homes.[34]
The world's biggest operational OTEC plant has an annual
power generation capacity of 100kW, which is sufficient to
power 120 homes in Hawaii. Image: courtesy of Makai Ocean
Engineering. The OTEC plant is located within the Natural
Energy Laboratory of Hawaii Authority (NELHA) in Kailua-
Kona.
Tidal energy
Station
Capacity
(MW)
Country Location Comm
Annapolis
Royal
Generating
Station
20 Canada
44°45′07″N65
°30′40″W
1984
Jiangxia Tidal
Power
Station
3.2 China
28°20′34″N12
1°14′25″E
1980
Kislaya Guba
Tidal Power
Station
1.7 Russia
69°22′37″N 3
3°04′33″E
1968
Rance Tidal
Power
Station
240 France
48°37′05″N02
°01′24″W
1966
Sihwa Lake
Tidal Power
Station
254 South Korea
37°18′47″N12
6°36′46″E
2011
Sihwa Lake
Tidal Power
Station
254 South Korea
37°18′47″N12
6°36′46″E
2011
Strangford
Lough SeaGe
n (Decommiss
ioned in 2016)
1.2
United
Kingdom
54°22′04″N05°
32′40″W
2008
Uldolmok
Tidal Power
Station
1.5 South Korea
34°32′07″N12
6°14′06″E
2009
Eastern
Scheldt Barrie
r Tidal Power
Plant
1.25
The
Netherlands
51°36′19″N 03
°40′59″E
2015
Proposed[edit]
There are many stations in proposal at the moment. The following table lists
tidal power stations that are only at a proposal stage
Station Capacity (MW) Country Location Const
Garorim Bay Tidal
Power Station
520 South Korea Garorim Bay
Incheon Tidal Power
Station
818 or 1,320 South Korea
37°29′48″N 126°20′32″
E
2017
Severn Barrage 8,640 United Kingdom
51°21′30″N 03°06′00″
W
Tugurskaya Tidal
Power Plant
3,640 Russia Okhotsk Sea
Mezenskaya Tidal
Power Plant
24,000 Russia Mezen Bay
Penzhinskaya Tidal
Power Plant
87,100 Russia Penzhin Bay
Skerries Tidal Stream
Array
10.5 United Kingdom
53°26′N 04°36′W appr
ox.
Tidal Lagoon Swansea
Bay
320 United Kingdom Swansea Bay 2015–2017
Dalupiri Blue Energy
Project
2,200 Philippines 12°25′N 124°17′E
Gulf of Kutch Project 50 India Gulf of Kutch 2012
Alderney tidal plant 300 Alderney 49°42′52″N 2°12′19″W 2020
The Gujarat government is all set to develop India’s first tidal energy plant. The
state government has approved Rs 25 crore for setting up the 50 MW plant at
the Gulf of Kutch. It will produce energy from the ocean tides.Y 2012
open cycle MHD system
FUEL CELLS
Fuel cell
THE PROMISE OF FUEL CELLS
 “A score of nonutility companies are well advanced
toward developing a powerful chemical fuel cell,
which could sit in some hidden closet of every
home silently ticking off electric power.”
 Theodore Levitt, “Marketing Myopia,” Harvard
Business Review, 1960
Theodore Levitt, “Marketing Myopia,” Harvard Business Review, 1960
PEM FUEL CELL
PARTS OF A FUEL CELL Anode
 Negative post of the fuel cell.
 Conducts the electrons that are freed from the hydrogen molecules so that
they can be used in an external circuit.
 Etched channels disperse hydrogen gas over the surface of catalyst.
 Cathode
 Positive post of the fuel cell
 Etched channels distribute oxygen to the surface of the catalyst.
 Conducts electrons back from the external circuit to the catalyst
 Recombine with the hydrogen ions and oxygen to form water.
 Electrolyte
 Proton exchange membrane.
 Specially treated material, only conducts positively charged ions.
 Membrane blocks electrons.
 Catalyst
 Special material that facilitates reaction of oxygen and hydrogen
 Usually platinum powder very thinly coated onto carbon paper or cloth.
 Rough & porous maximizes surface area exposed to hydrogen or oxygen
 The platinum-coated side of the catalyst faces the PEM.
FUEL CELL OPERATION
 Pressurized hydrogen gas (H2) enters cell on anode
side.
 Gas is forced through catalyst by pressure.
 When H2 molecule comes contacts platinum catalyst, it splits
into two H+ ions and two electrons (e-).
 Electrons are conducted through the anode
 Make their way through the external circuit (doing useful work
such as turning a motor) and return to the cathode side of the
fuel cell.
 On the cathode side, oxygen gas (O2) is forced through
the catalyst
 Forms two oxygen atoms, each with a strong negative
charge.
 Negative charge attracts the two H+ ions through the
membrane,
 Combine with an oxygen atom and two electrons from the
external circuit to form a water molecule (H2O).
PROTON-EXCHANGE MEMBRANE CELL
http://www.news.cornell.edu/releases/Nov03/Fuelcell.institute.deb.html
PEM FUEL CELL ANIMATION
Click on Diagram
FUEL CELL STACK
http://www.nrel.gov/hydrogen/photos.html
HYDROGEN FUEL CELL EFFICIENCY
 40% efficiency converting methanol to hydrogen in
reformer
 80% of hydrogen energy content converted to electrical
energy
 80% efficiency for inverter/motor
 Converts electrical to mechanical energy
 Overall efficiency of 24-32%
AUTO POWER EFFICIENCY COMPARISON
Technology
System
Efficiency
Fuel Cell 24-32%
Electric Battery 26%
Gasoline Engine 20%
http://www.howstuffworks.com/fuel-cell.htm/printable
OTHER TYPES OF FUEL CELLS
 Alkaline fuel cell (AFC)
 This is one of the oldest designs. It has been used in the U.S. space program
since the 1960s. The AFC is very susceptible to contamination, so it requires
pure hydrogen and oxygen. It is also very expensive, so this type of fuel cell is
unlikely to be commercialized.
 Phosphoric-acid fuel cell (PAFC)
 The phosphoric-acid fuel cell has potential for use in small stationary power-
generation systems. It operates at a higher temperature than PEM fuel cells, so
it has a longer warm-up time. This makes it unsuitable for use in cars.
 Solid oxide fuel cell (SOFC)
 These fuel cells are best suited for large-scale stationary power generators that
could provide electricity for factories or towns. This type of fuel cell operates at
very high temperatures (around 1,832 F, 1,000 C). This high temperature
makes reliability a problem, but it also has an advantage: The steam produced
by the fuel cell can be channeled into turbines to generate more electricity. This
improves the overall efficiency of the system.
 Molten carbonate fuel cell (MCFC)
 These fuel cells are also best suited for large stationary power generators. They
operate at 1,112 F (600 C), so they also generate steam that can be used to
generate more power. They have a lower operating temperature than the
SOFC, which means they don't need such exotic materials. This makes the
design a little less expensive.
http://www.howstuffworks.com/fuel-cell.htm/printable
ADVANTAGES/DISADVANTAGES OF FUEL
CELLS
 Advantages
 Water is the only discharge (pure H2)
 Disadvantages
 CO2 discharged with methanol reform
 Little more efficient than alternatives
 Technology currently expensive
 Many design issues still in progress
 Hydrogen often created using “dirty” energy (e.g., coal)
 Pure hydrogen is difficult to handle
 Refilling stations, storage tanks, …
FUEL CELLS
EXTRA SLIDES
FUEL CELL ENERGY EXCHANGE
http://hyperphysics.phy-astr.gsu.edu/hbase/thermo/electrol.html
PEM FUEL CELL SCHEMATIC

Non conventional power plants

  • 1.
    WIND POWER PLANT Prof.Siraskar G.D. Mechanical engineering department PCCOE&R
  • 2.
  • 4.
    Wind power generationcapacity in India has significantly increased in recent years. As of the end of October 2017 the total installed wind power capacity was 32.72 GW, India had the fourth largest installed wind power capacity in the world. Installed wind power capacity and generation in India since 2007 Financi al year 09-10 10-11 11-12 12-13 13-14 14-15 15-16 16-17 Installe d capacit y (MW) 13,064 16,084 18,421 20,150 22,465 23,447 26,777 32,280 Genera tion (GWh) 28,214 28,604 46,011
  • 5.
    •Tamil Nadu hasbecome a leader in Wind Power in India. In Muppandal windfarm the total capacity is 1500 MW •Maharashtra is one of the prominent states that installed wind power projects second to Tamil Nadu in India. As of end of March 2016, installed wind power capacity is 4655.25 MW
  • 6.
    Ran k Power plant ProducerLocation State MWe 1 Muppandal windfarm[26] Muppandal Wind Kanyakumari Tamil Nadu 1500 2 Jaisalmer Wind Park[27] Suzlon Energy Jaisalmer Rajasthan 1064 3 Brahmanvel windfarm[28] Parakh Agro Industries Dhule Maharashtra 528 4 Dhalgaon windfarm[29] Gadre Marine Exports Sangli Maharashtra 278 5 Vankusawade Wind Park Suzlon Energy Ltd. Satara District. Maharashtra 259
  • 8.
    3, siemens-Gamesa RenewableEnergy SWT-8.0-154 First seen in 2011 as a 6MW unit with a rotor diameter of 120 metres, Siemens twice since upgraded the direct-drive offshore turbine for a power rating of 8MW with an extended rotor diameter of 154 metres Power rating 8MW Rotor diameter 154m Drivetrain Direct-drive IEC Class lB . 1. MHI Vestas V164 9.5MW: The fortunes of the MHI Vestas joint venture, created in April 2014, depend largely on the success of this model, the biggest wind turbine in serial production today Power rating 9.5MW Rotor diameter 164m Drivetrain Medium-speed geared IEC Class S 2. Adwen AD-180 Another product of an offshore joint venture - this time between Gamesa and Areva - the Adwen AD-180 is setting a new benchmark for blade length at 88.4 metres, 10% longer than even those of the MHI Vestas V164. Power rating 8MW Rotor diameter 180m Drivetrain Medium-speed geared IEC Class lB
  • 11.
  • 21.
  • 22.
    •Two blades :2 MW to 3MW , large wind turbines, with better material like glass fiber reinforced plastic •Three blades : 15 kw to 3 MW, speed 300 to 400 rpm •Multi blades : 20 to 30 blades, 60 to 80 rpm
  • 23.
    Vertical axis •Savonius rotor:/s –rotor: , hollow elliptical cylinder sliced in two pieces and each of these halves fixed to a vertical axis with fixed gap •Darrieus types rotor : two or three convex shaped blades with aerofoil cross-section along with their length the blades are curved into shapes called troposkein.
  • 24.
    •Advantages over horizontal:no orientation in the direction of wind •can work at low speed up to 8 kmh where as horizontal need 16 kmh •No big structure required
  • 25.
    Vertical axis windturbine: •Does not need yaw control mechanism since vanes of wind mill can accept the wind from any direction •Does not require big support tower , as gear box generator mounted on ground •Cost is less •Cost of maintenance is low •Height of tower 100 m •Hollow shaft supported by two bearings •Upper platforms supported by six guy ropes
  • 26.
  • 28.
    •2 to 3blades FRP •Diameter of rotor 2 to 25 m modern up to 100 m even up to 180 m •Automatic electromagnetic brakes if wind speed beyond design capacity •The hub, brakes, gear box, generators is housed in box called nacelle •Small wind turbine , tail vane adjust direction of wind blades in the wind direction •In big turbine , wind sensors sense the direction and yaw mechanism adjust the wind blades in wind direction
  • 30.
    25 to 40m, dia, at speed of 300 to 400 rpm produced 120 kw power
  • 39.
    Power Coefficient -It's an Efficiency I would like to call it (and some people do) overall turbine system efficiency. The wind power industry often calls it the Power Coefficient, and gives it the symbol Cp. The technical and product literature is now full of it (the term Cp I mean), so Power Coefficient it shall be for the rest of this page. Power Coefficient - An Indicator of Total Wind Turbine System Efficiency The term Power Coefficient is commonly used to designate the efficiency of the entire turbine power system. As shown in the expression below, it is generally defined as the ratio of the "electrical power produced by the wind turbine" (Pout in the formula below) divided by the "wind power into the turbine" (Pin). Pin is sometimes also called "available wind power". But I don't really like that expression because the total power in the wind is never really totally "available".
  • 40.
    The tip-speed ratio,X, or TSR for wind turbines is the ratio between the tangential speed of the tip of a blade and the actual speed of the
  • 52.
    Cost of windmill = 4 crores / MW
  • 53.
    Attempts to developand refine OTEC technology started in the 1880s. In 1881, Jacques Arsene d'Arsonval, a French physicist, proposed tapping the thermal energy of the ocean
  • 54.
    In 1935, Claudeconstructed a plant aboard a 10,000-ton cargo vessel moored off the coast of Brazil. Weather and waves destroyed it before it could generate net power.[5] (Net power is the amount of power generated after subtracting power needed to run the system). In 1956, French scientists designed a 3 MW plant for Abidjan, Ivory Coast. The plant was never completed, because new finds of large amounts of cheap petroleum made it uneconomical.[5] In 1962, J. Hilbert Anderson and James H. Anderson, Jr. focused on increasing component efficiency. They patented their new "closed cycle" design in 1967.[7] This design improved upon the original closed-cycle Rankine system, and included this in an outline for a plant that would produce power at lower cost than oil or coal. At the time, however, their research garnered little attention since coal and nuclear were considered the future of energy.[6] Japan is a major contributor to the development of OTEC technology.[8] Beginning in 1970 the Tokyo Electric Power Company successfully built and deployed a 100 kW closed-cycle OTEC plant on the island of Nauru.[8] The plant became operational on 14 October 1981, producing about 120 kW of electricity;
  • 55.
    Currently operating OTECplants[edit] In March 2013, Saga University with various Japanese industries completed the installation of a new OTEC plant. Okinawa Prefecture announced the start of the OTEC operation testing at Kume Island on April 15, 2013. The main aim is to prove the validity of computer models and demonstrate OTEC to the public. The testing and research will be conducted with the support of Saga University until the end of FY 2016. IHI Plant Construction Co. Ltd, Yokogawa Electric Corporation, and Xenesys Inc were entrusted with constructing the 100 kilowatt class plant within the grounds of the Okinawa Prefecture Deep Sea Water Research Center. The location was specifically chosen in order to utilize existing deep seawater and surface seawater intake pipes installed for the research center in 2000. The pipe is used for the intake of deep sea water for research, fishery, and agricultural use.[19] The plant consists of two 50 kW units in double Rankine configuration.[30] The OTEC facility and deep seawater research center are open to free public tours by appointment in English and Japanese.[31] Currently, this is one of only two fully operational OTEC plants in the world. This plant operates continuously when specific tests are not underway.
  • 56.
    In 2011, MakaiOcean Engineering completed a heat exchanger test facility at NELHA. Used to test a variety of heat exchange technologies for use in OTEC, Makai has received funding to install a 105 kW turbine.[32] Installation will make this facility the largest operational OTEC facility, though the record for largest power will remain with the Open Cycle plant also developed in Hawaii. In July 2014, DCNS group partnered with Akuo Energy announced NER 300 funding for their NEMO project. If successful, the 16MW gross 10MW net offshore plant will be the largest OTEC facility to date. DCNS plans to have NEMO operational by 2020.[33] An ocean thermal energy conversion power plant built by Makai Ocean Engineering went operational in Hawaii in August 2015 . The governor of Hawaii, David Ige, "flipped the switch" to activate the plant. This is the first true closed-cycle ocean Thermal Energy Conversion (OTEC) plant to be connected to a U.S. electrical grid . It is a demo plant capable of generating 105 kilowatts, enough to power about 120 homes.[34]
  • 57.
    The world's biggestoperational OTEC plant has an annual power generation capacity of 100kW, which is sufficient to power 120 homes in Hawaii. Image: courtesy of Makai Ocean Engineering. The OTEC plant is located within the Natural Energy Laboratory of Hawaii Authority (NELHA) in Kailua- Kona.
  • 67.
  • 72.
    Station Capacity (MW) Country Location Comm Annapolis Royal Generating Station 20Canada 44°45′07″N65 °30′40″W 1984 Jiangxia Tidal Power Station 3.2 China 28°20′34″N12 1°14′25″E 1980 Kislaya Guba Tidal Power Station 1.7 Russia 69°22′37″N 3 3°04′33″E 1968 Rance Tidal Power Station 240 France 48°37′05″N02 °01′24″W 1966 Sihwa Lake Tidal Power Station 254 South Korea 37°18′47″N12 6°36′46″E 2011
  • 73.
    Sihwa Lake Tidal Power Station 254South Korea 37°18′47″N12 6°36′46″E 2011 Strangford Lough SeaGe n (Decommiss ioned in 2016) 1.2 United Kingdom 54°22′04″N05° 32′40″W 2008 Uldolmok Tidal Power Station 1.5 South Korea 34°32′07″N12 6°14′06″E 2009 Eastern Scheldt Barrie r Tidal Power Plant 1.25 The Netherlands 51°36′19″N 03 °40′59″E 2015
  • 74.
    Proposed[edit] There are manystations in proposal at the moment. The following table lists tidal power stations that are only at a proposal stage Station Capacity (MW) Country Location Const Garorim Bay Tidal Power Station 520 South Korea Garorim Bay Incheon Tidal Power Station 818 or 1,320 South Korea 37°29′48″N 126°20′32″ E 2017 Severn Barrage 8,640 United Kingdom 51°21′30″N 03°06′00″ W Tugurskaya Tidal Power Plant 3,640 Russia Okhotsk Sea Mezenskaya Tidal Power Plant 24,000 Russia Mezen Bay Penzhinskaya Tidal Power Plant 87,100 Russia Penzhin Bay Skerries Tidal Stream Array 10.5 United Kingdom 53°26′N 04°36′W appr ox. Tidal Lagoon Swansea Bay 320 United Kingdom Swansea Bay 2015–2017 Dalupiri Blue Energy Project 2,200 Philippines 12°25′N 124°17′E Gulf of Kutch Project 50 India Gulf of Kutch 2012 Alderney tidal plant 300 Alderney 49°42′52″N 2°12′19″W 2020 The Gujarat government is all set to develop India’s first tidal energy plant. The state government has approved Rs 25 crore for setting up the 50 MW plant at the Gulf of Kutch. It will produce energy from the ocean tides.Y 2012
  • 112.
  • 119.
  • 120.
    THE PROMISE OFFUEL CELLS  “A score of nonutility companies are well advanced toward developing a powerful chemical fuel cell, which could sit in some hidden closet of every home silently ticking off electric power.”  Theodore Levitt, “Marketing Myopia,” Harvard Business Review, 1960 Theodore Levitt, “Marketing Myopia,” Harvard Business Review, 1960
  • 121.
  • 122.
    PARTS OF AFUEL CELL Anode  Negative post of the fuel cell.  Conducts the electrons that are freed from the hydrogen molecules so that they can be used in an external circuit.  Etched channels disperse hydrogen gas over the surface of catalyst.  Cathode  Positive post of the fuel cell  Etched channels distribute oxygen to the surface of the catalyst.  Conducts electrons back from the external circuit to the catalyst  Recombine with the hydrogen ions and oxygen to form water.  Electrolyte  Proton exchange membrane.  Specially treated material, only conducts positively charged ions.  Membrane blocks electrons.  Catalyst  Special material that facilitates reaction of oxygen and hydrogen  Usually platinum powder very thinly coated onto carbon paper or cloth.  Rough & porous maximizes surface area exposed to hydrogen or oxygen  The platinum-coated side of the catalyst faces the PEM.
  • 123.
    FUEL CELL OPERATION Pressurized hydrogen gas (H2) enters cell on anode side.  Gas is forced through catalyst by pressure.  When H2 molecule comes contacts platinum catalyst, it splits into two H+ ions and two electrons (e-).  Electrons are conducted through the anode  Make their way through the external circuit (doing useful work such as turning a motor) and return to the cathode side of the fuel cell.  On the cathode side, oxygen gas (O2) is forced through the catalyst  Forms two oxygen atoms, each with a strong negative charge.  Negative charge attracts the two H+ ions through the membrane,  Combine with an oxygen atom and two electrons from the external circuit to form a water molecule (H2O).
  • 124.
  • 125.
    PEM FUEL CELLANIMATION Click on Diagram
  • 126.
  • 127.
    HYDROGEN FUEL CELLEFFICIENCY  40% efficiency converting methanol to hydrogen in reformer  80% of hydrogen energy content converted to electrical energy  80% efficiency for inverter/motor  Converts electrical to mechanical energy  Overall efficiency of 24-32%
  • 128.
    AUTO POWER EFFICIENCYCOMPARISON Technology System Efficiency Fuel Cell 24-32% Electric Battery 26% Gasoline Engine 20% http://www.howstuffworks.com/fuel-cell.htm/printable
  • 129.
    OTHER TYPES OFFUEL CELLS  Alkaline fuel cell (AFC)  This is one of the oldest designs. It has been used in the U.S. space program since the 1960s. The AFC is very susceptible to contamination, so it requires pure hydrogen and oxygen. It is also very expensive, so this type of fuel cell is unlikely to be commercialized.  Phosphoric-acid fuel cell (PAFC)  The phosphoric-acid fuel cell has potential for use in small stationary power- generation systems. It operates at a higher temperature than PEM fuel cells, so it has a longer warm-up time. This makes it unsuitable for use in cars.  Solid oxide fuel cell (SOFC)  These fuel cells are best suited for large-scale stationary power generators that could provide electricity for factories or towns. This type of fuel cell operates at very high temperatures (around 1,832 F, 1,000 C). This high temperature makes reliability a problem, but it also has an advantage: The steam produced by the fuel cell can be channeled into turbines to generate more electricity. This improves the overall efficiency of the system.  Molten carbonate fuel cell (MCFC)  These fuel cells are also best suited for large stationary power generators. They operate at 1,112 F (600 C), so they also generate steam that can be used to generate more power. They have a lower operating temperature than the SOFC, which means they don't need such exotic materials. This makes the design a little less expensive. http://www.howstuffworks.com/fuel-cell.htm/printable
  • 134.
    ADVANTAGES/DISADVANTAGES OF FUEL CELLS Advantages  Water is the only discharge (pure H2)  Disadvantages  CO2 discharged with methanol reform  Little more efficient than alternatives  Technology currently expensive  Many design issues still in progress  Hydrogen often created using “dirty” energy (e.g., coal)  Pure hydrogen is difficult to handle  Refilling stations, storage tanks, …
  • 135.
  • 136.
  • 137.
    FUEL CELL ENERGYEXCHANGE http://hyperphysics.phy-astr.gsu.edu/hbase/thermo/electrol.html
  • 138.
    PEM FUEL CELLSCHEMATIC