- The document discusses characterizing the surface chemistry of ferrihydrite by determining proton stability constants and binding site concentrations.
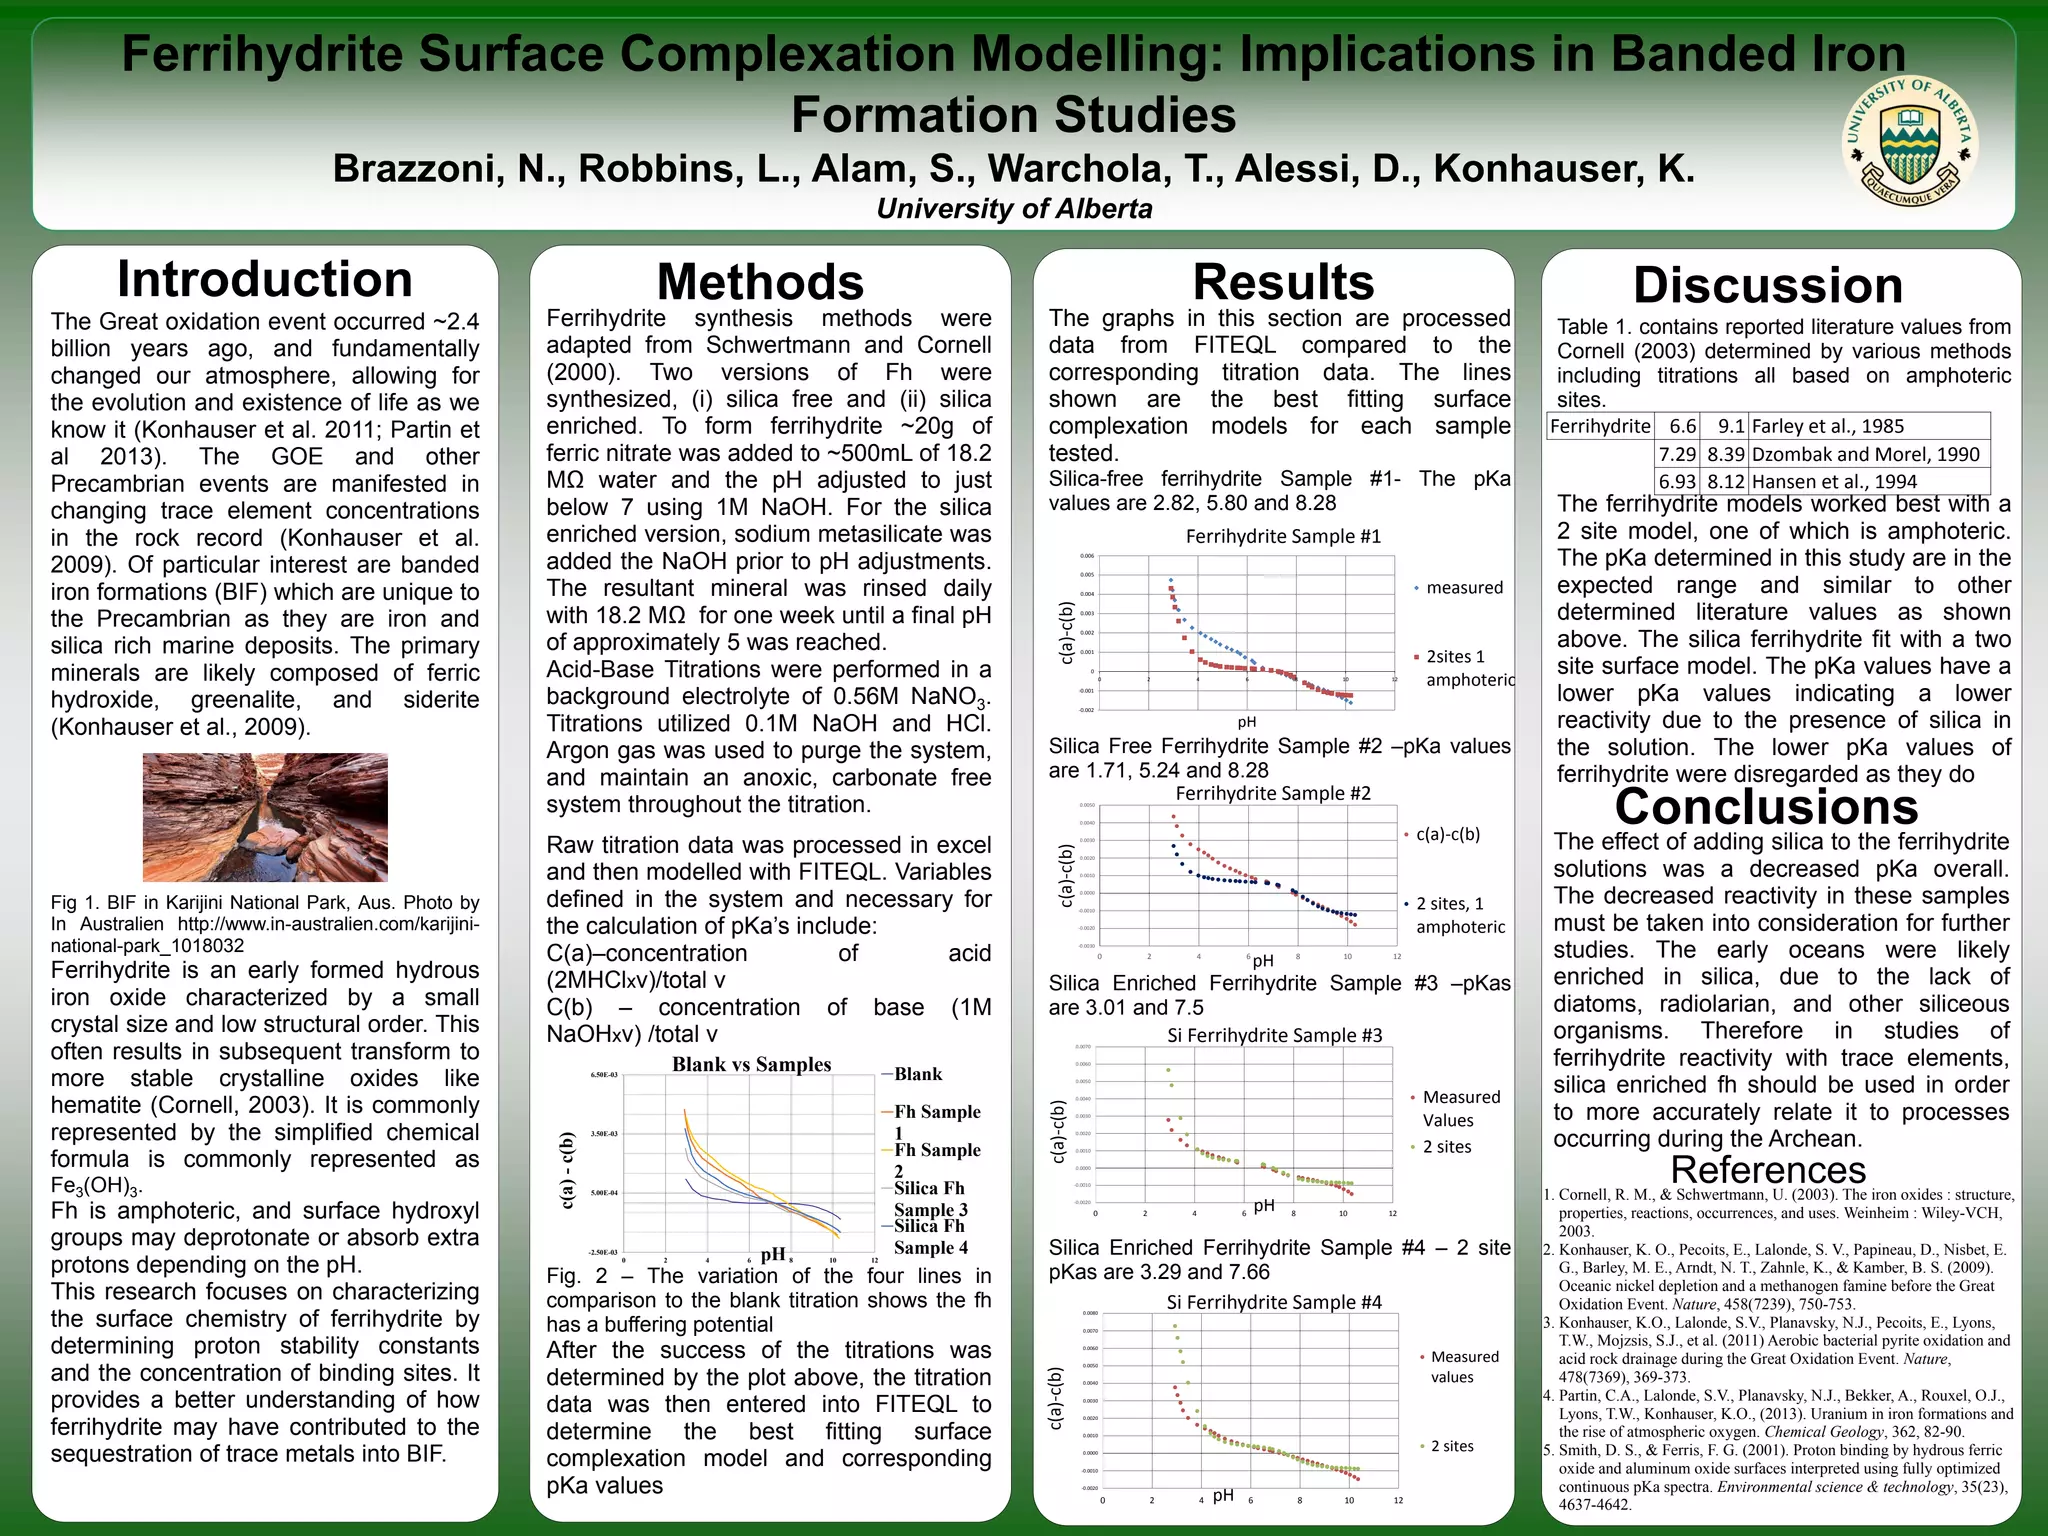
- Ferrihydrite and silica-enriched ferrihydrite were synthesized and subjected to acid-base titrations to determine proton stability constants (pKa values).
- The pKa values determined from modeling the titration data ranged from 1.71 to 8.28 for ferrihydrite and were lower (3.01 to 7.66) for silica-enriched ferrihydrite, indicating lower reactivity in the presence of silica.
- The study provides insights into how ferrihydrite may have contributed to trace metal sequestration