Downloaded 72 times
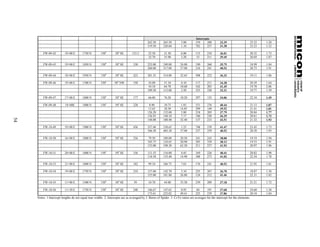
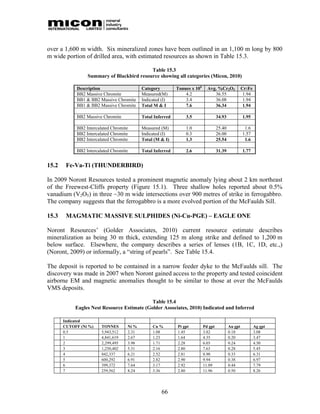
![Serpentinization [hydration] of the dunite produces excess iron which forms magnetite, thus
the altered olivine-rich, portion of the sill produces very strong total magnetic and highly
variable vertical magnetic gradient anomalies. Locally, magnetite aggregates in the altered
dunite to form narrow, highly conductive veinlets which produce a weak, diffuse but
persistent airborne EM anomaly in the footwall of the Big Daddy, Black Creek and Black
Thor/Black Label deposits.
Although the matrix of the massive chromitite is also pervasively altered to serpentine, talc
and chlorite it lacks significant amounts of magnetite and is non-conductive, but, due to high
density of chromite, has a high specific gravity that is measurable on the ground as a gravity
anomaly.
1.6.2 Status of Exploration
Exploration completed to date is sufficient to define an indicated chromite resource.
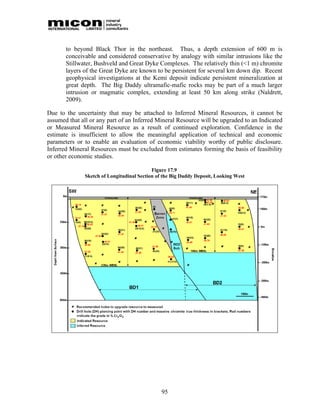
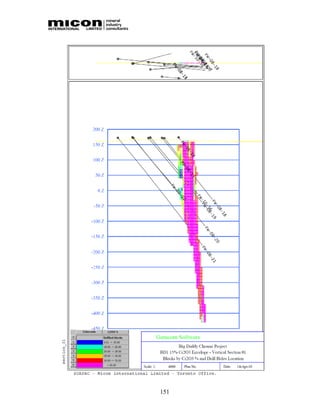
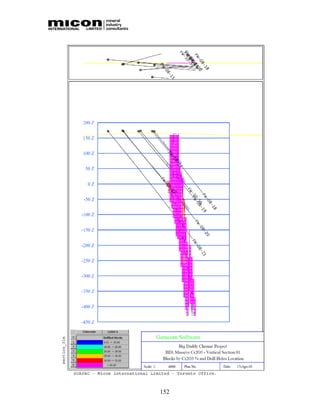
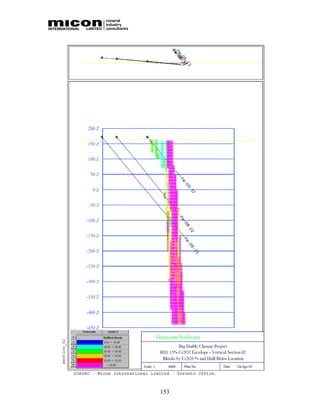
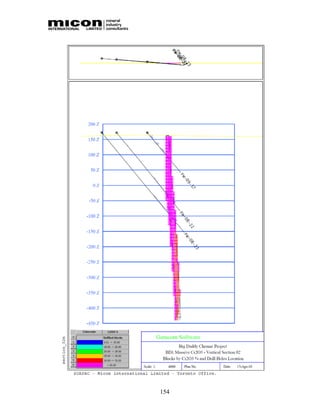
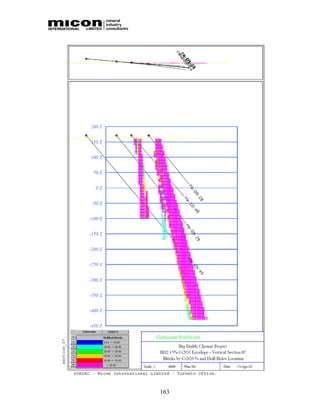
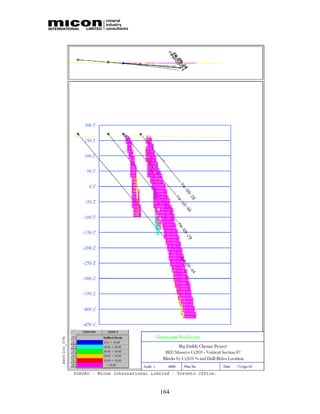
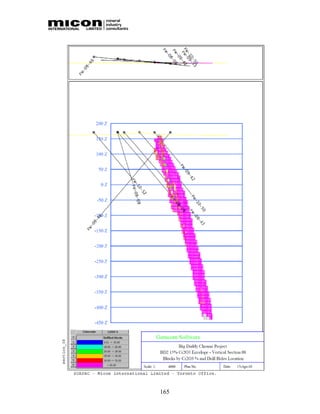
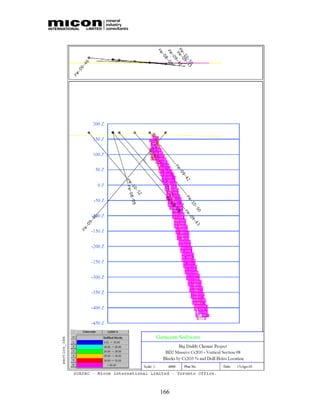
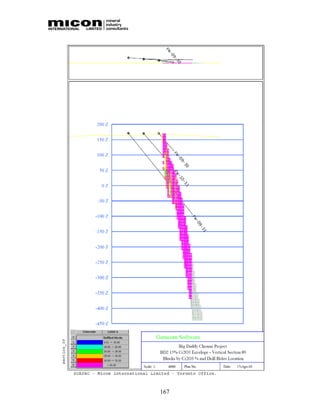
Substantial widths of massive chromite mineralization extend from the sub-outcrop, 3 to 10
m below surface, to the deepest intersection 365 m below surface. The deposit has been
tested on 100 m sections between 900 E and 2100 E, a distance of 1,200 m.
The deposit remains open along strike and down dip. However, both gravity and magnetic
anomalies diminish to the southwest near section 900 E and appear to be terminated along
the creek to the northeast beyond section 2100E. Additional drilling and extension of gravity
and magnetic coverage to the south property boundary are required. Drilling northeast of
section 2100 E was not possible due to swampy conditions; however, geophysical data
suggest that the chromite horizon is faulted 600 m left laterally (between sections 2100E and
2200E), becoming the Black Creek deposit on the north property boundary.
1.6.3 Exploration Results
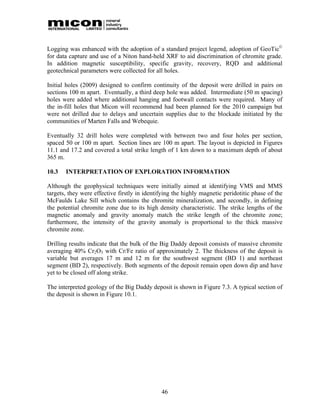
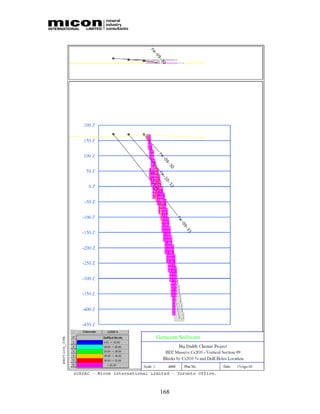
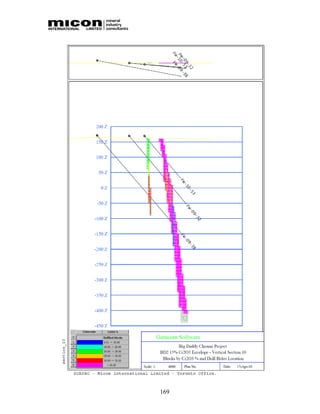
Drilling results indicate that the bulk of the Big Daddy deposit consists of massive chromite
averaging 40% Cr2O3 with Cr:Fe ratio of approximately 2. The thickness of the deposit is
variable but averages 17 m and 12 m for the southwest segment (BD 1) and northeast
segment (BD 2), respectively. Both segments of the deposit are open down dip.
1.7 MINERAL RESOURCES
The Big Daddy resource estimate has been conducted using geological modelling,
conventional statistics, geostatistics, creation of interpolation parameters, block modelling,
resource classification based on both geological, geostatistical and mineralization continuity
and finally, block model validation.
The resource estimate was completed using Surpac Version 6.1.3 and is based on two
scenarios.
8](https://image.slidesharecdn.com/ni-43-101-2010-100616064720-phpapp02/85/MICON-NI-43-101-Technical-Resource-Report-18-320.jpg)
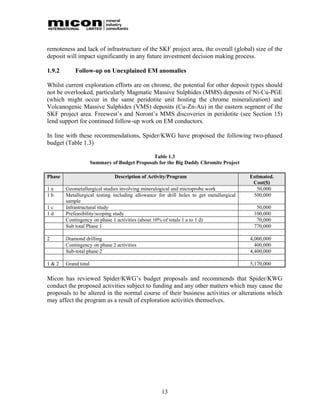
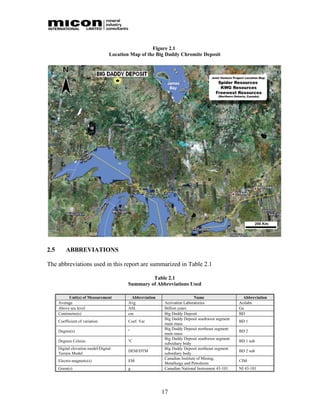
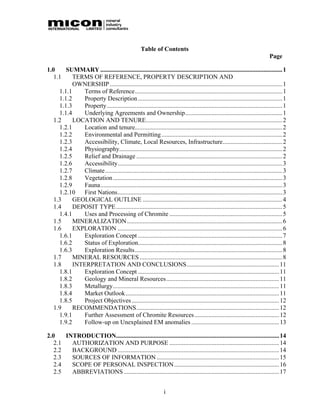
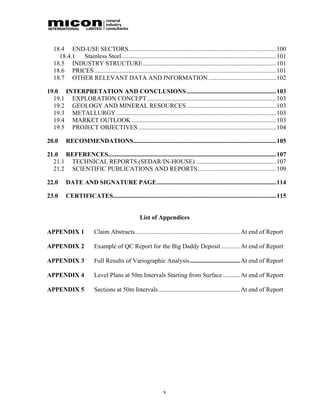
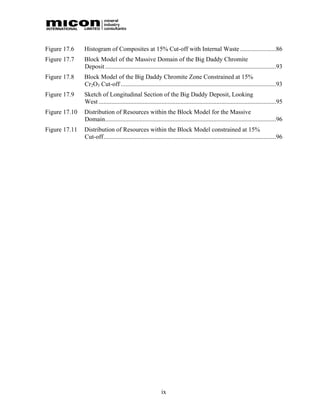
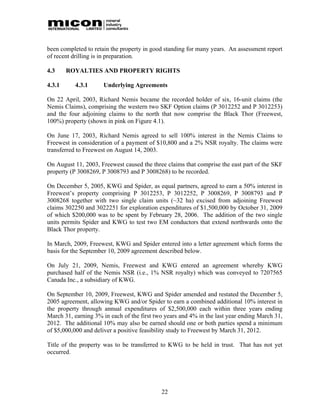
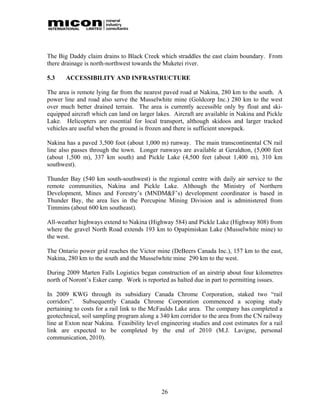
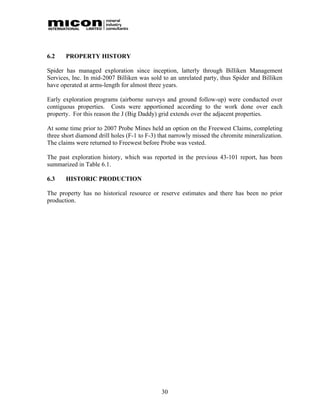
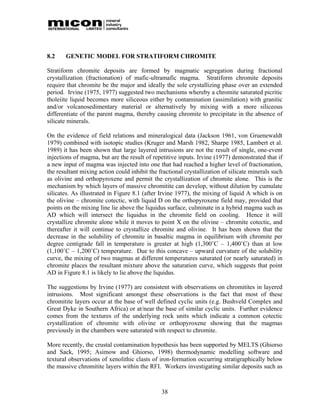
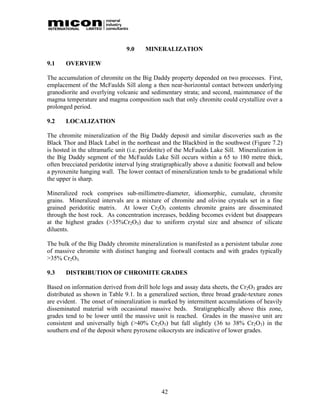
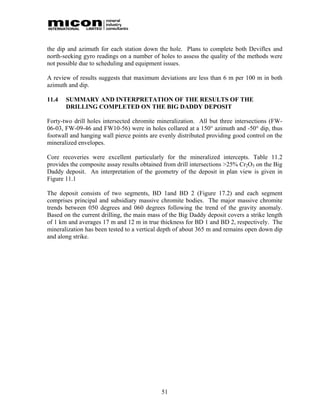
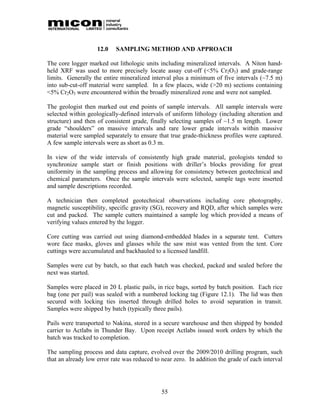
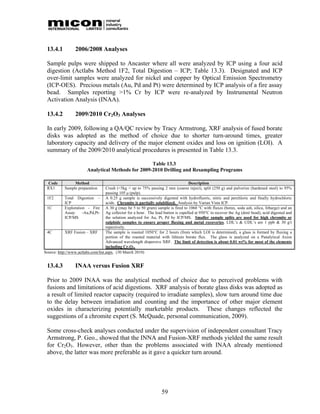
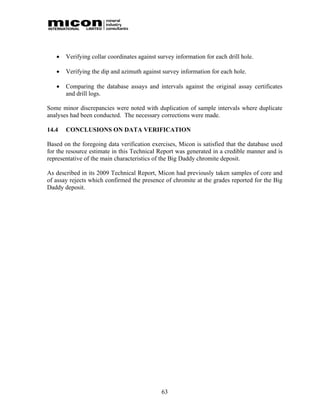
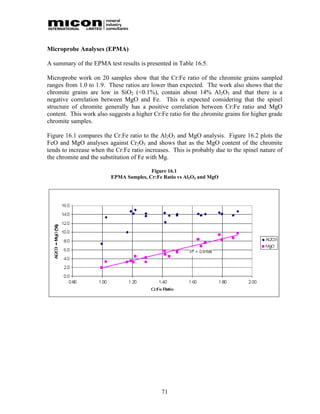
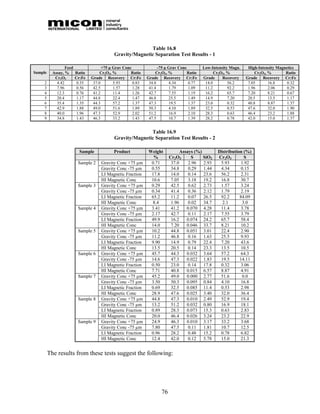
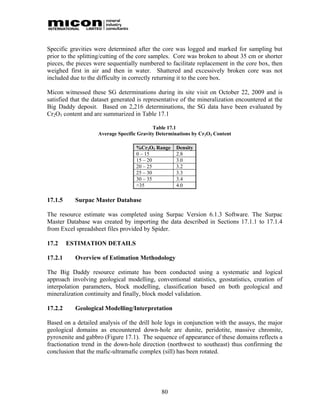
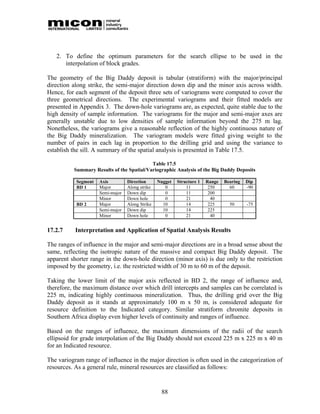
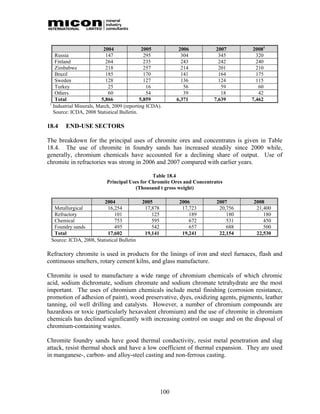
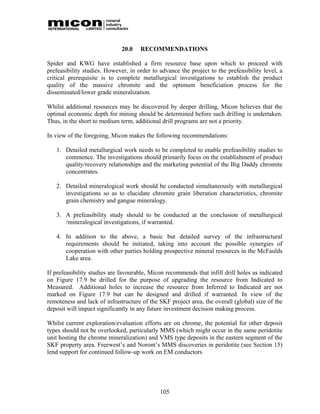
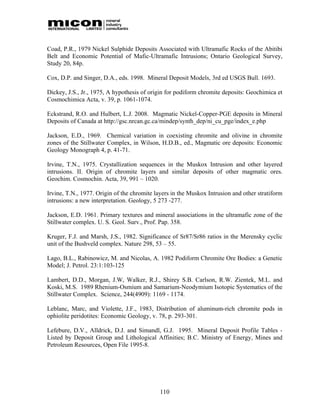
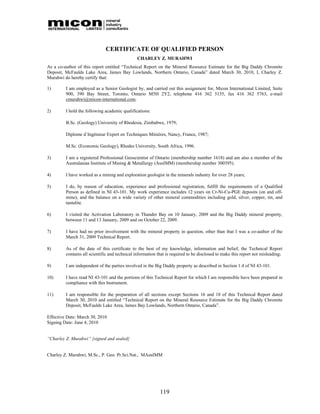
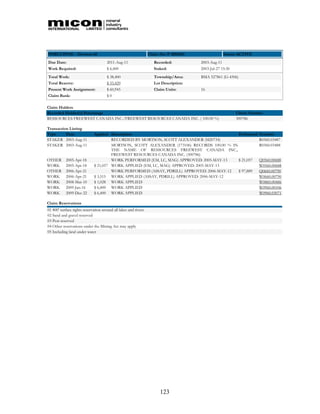
![Area Work Total Total Present Work NSR
Claim No Units (ha)1 Due Date Recorded Req’d Work Reserve Assigned
P 3008268 16 243 2011-Aug-11 2003-Aug-11 $6,400 $38,400 $20,203 $24,000 0%
76 1,209 $182,400 $205,966 $115,731
P 3012250 2 1 163 2011-Apr-22 2003-Apr-22 $6,400 $38,400 $10,560 $0 2%
P 3012251 2 1 163 2011-Apr-22 2003-Apr-22 $6,400 $38,400 $10,560 $0 2%
32 $76,800 $21,120
78 1,241
1 – Measured based on uncorrected, hand-held GPS-derived locations of claim [corner] posts.
2 - Assessment work is for entire claim which must be maintained to retain the optioned portions.
3 – Nominal areas based on descriptions of the optioned parcels and locations of relevant claim [corner] posts
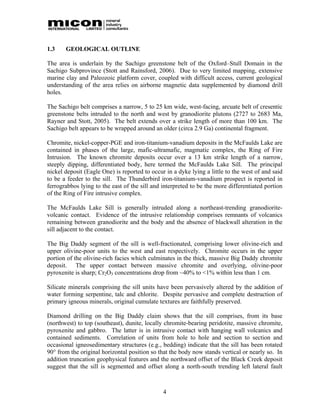
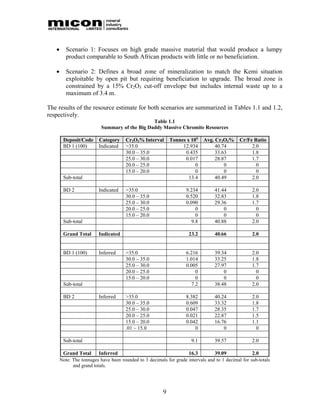
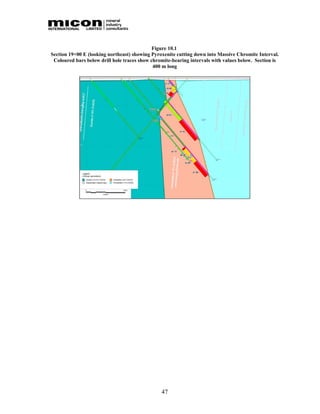
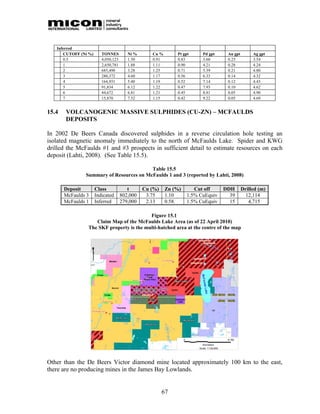
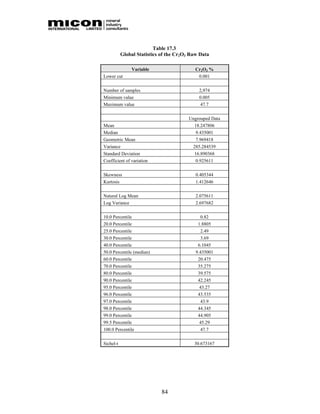
Figure 4.1
SKF Project Claim Map. SKF Option claims are shown in green. Claim locations are “as staked” based
on GPS-derived locations of claim posts
4.2 COSTS OF MAINTENANCE
In Ontario, mining rights are acquired by staking out and recording claims in a manner
prescribed in the Mining Act (R.S.O. 1990, Chapter M. 14 Section 38 (1)). Claim holders are
required to submit proof of permitted exploration expenditures at a rate of $400 per claim
unit annually starting prior to the second anniversary of recording until the claims are taken
to lease. The annual maintenance costs for 78 units are $31,200. Sufficient eligible work has
21](https://image.slidesharecdn.com/ni-43-101-2010-100616064720-phpapp02/85/MICON-NI-43-101-Technical-Resource-Report-31-320.jpg)
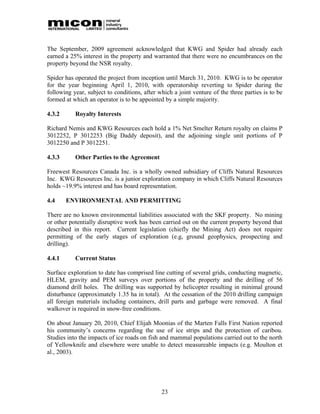
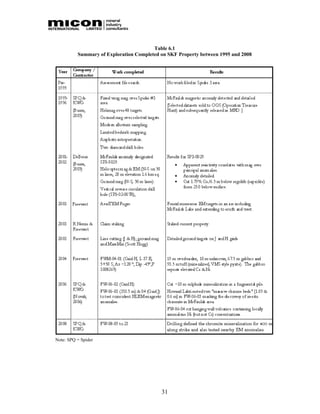
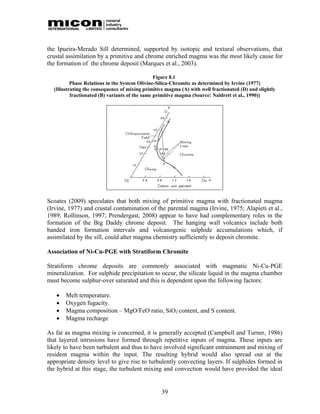
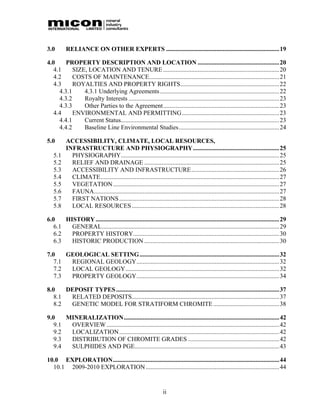
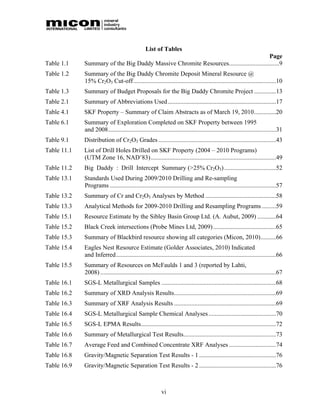
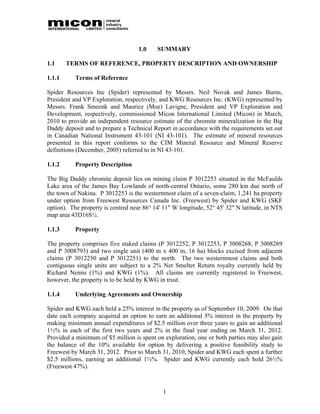
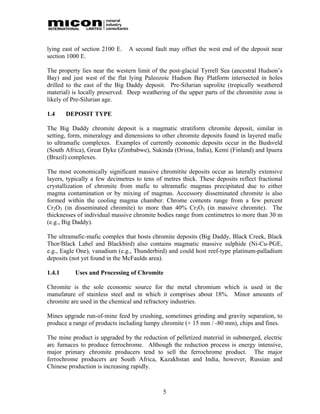
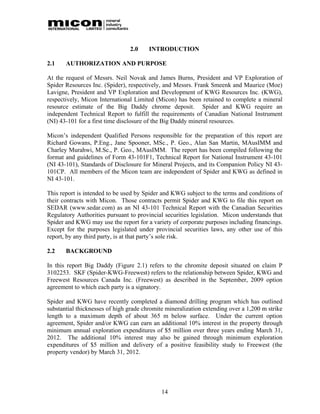
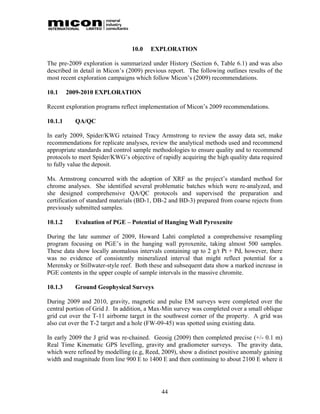
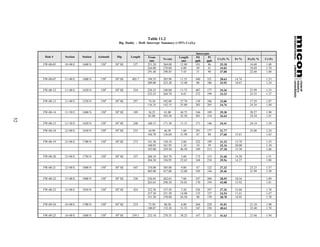
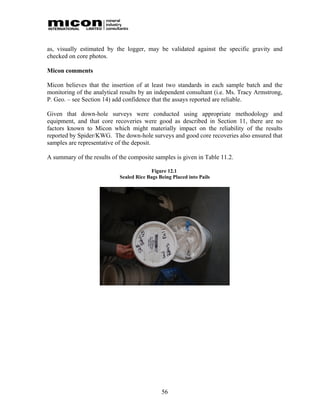
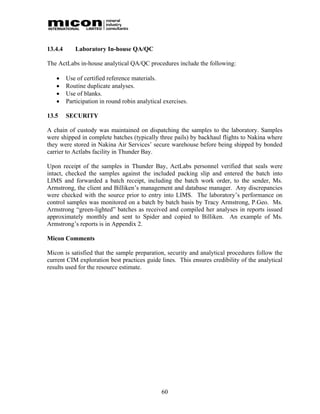
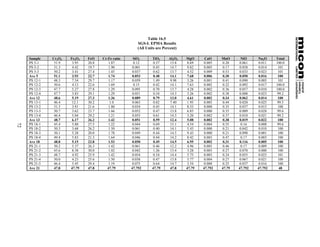
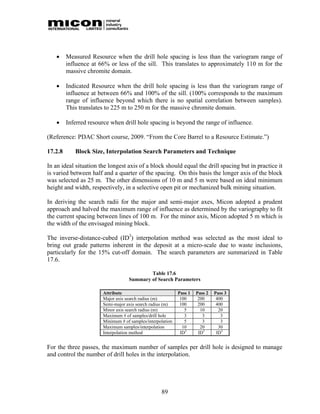
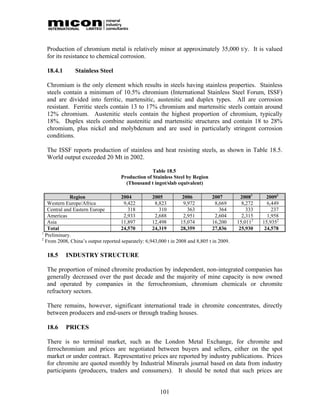
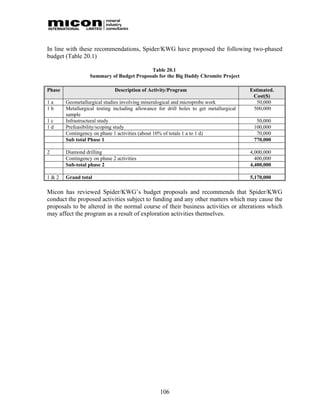
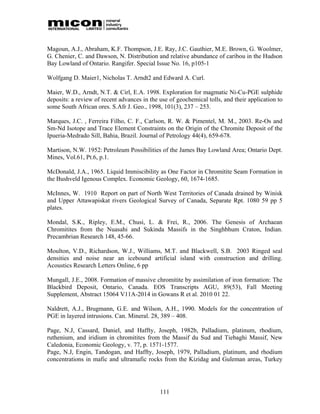
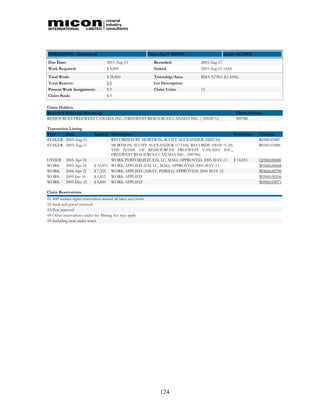
![Table 9.1
Distribution of Cr2O3 Grades
Mineralization Type %Cr2O3 Remarks
Massive 30 – 50 Dominant type
Banded 20 – 30 Rare type. Individual bands may contain up to 40% Cr2O3
Semi-massive 20 – 30 Very minor type
Heavily disseminated 10 – 20 Locally common
Disseminated 1 – 10 Locally common [Background values]
9.4 SULPHIDES AND PGE
Massive sulphides have not been encountered in the chromite-rich zones. However, local
sulphide disseminations have been noted within and immediately above the massive chromite
layers. The identifiable sulphides are pyrrhotite, chalcopyrite, pyrite and rarely pentlandite.
A small (<10 cm diameter) sulphide-rich accumulation from hole FW-09-33 reported a
massive, secondary Fe-Cu-Ni-sulphide assemblage (godevskite, Ni9S8 and mackinawite,
(Fe,Ni)9S8 with minor chalcopyrite, chromite and trace millerite (Kjarsgaard, 2009), in a fault
or shear zone. This assemblage is typical of low-temperature, hydrothermally emplaced
nickel-iron sulphides.
43](https://image.slidesharecdn.com/ni-43-101-2010-100616064720-phpapp02/85/MICON-NI-43-101-Technical-Resource-Report-53-320.jpg)
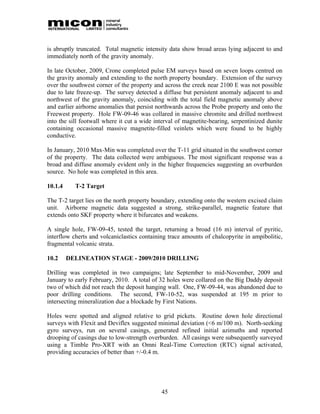
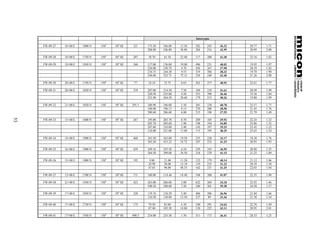
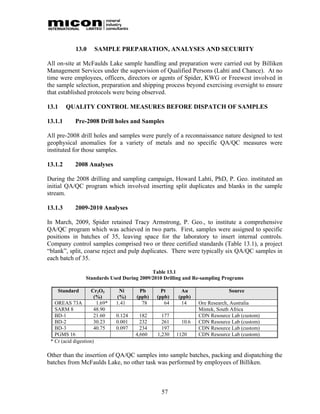
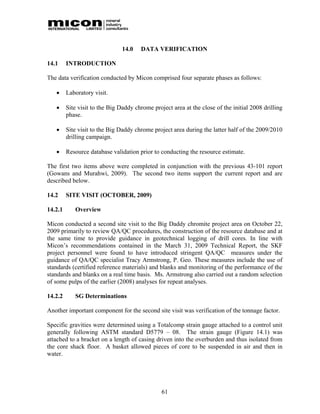
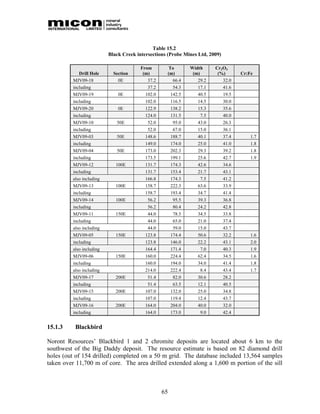
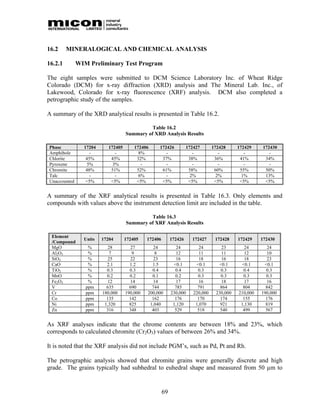
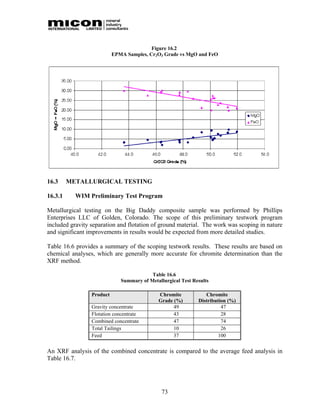
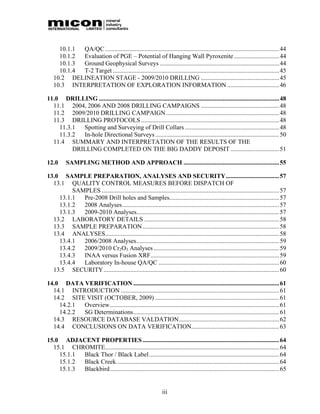
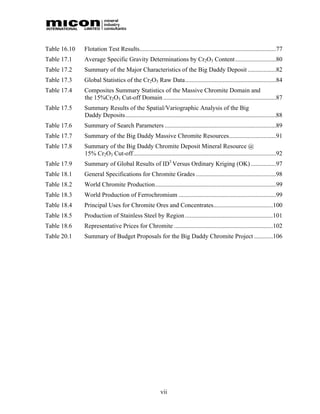
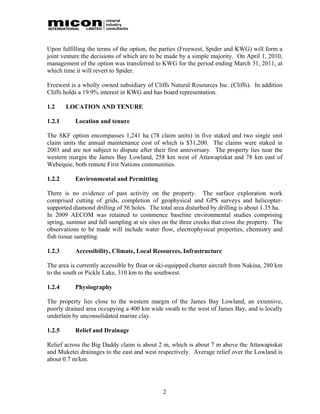
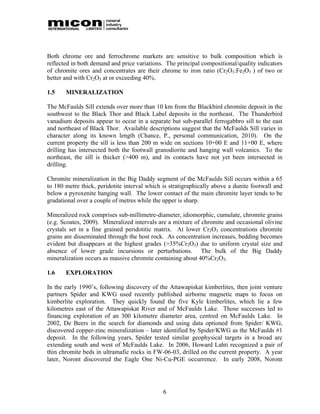
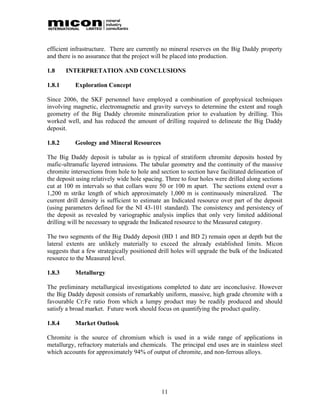
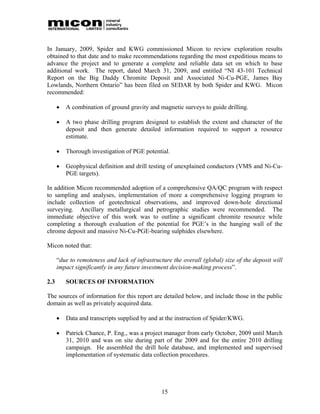
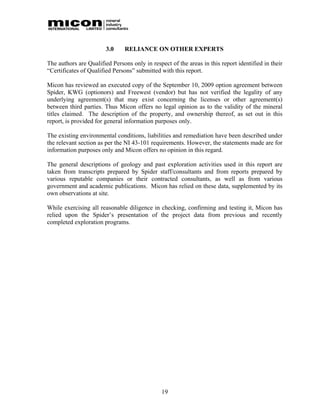
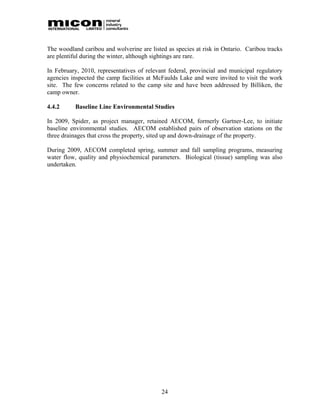
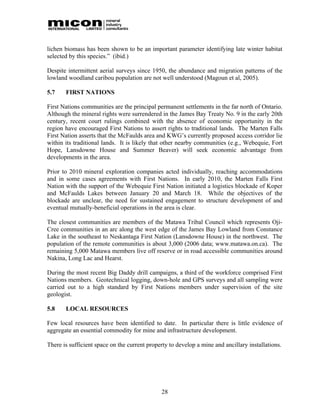
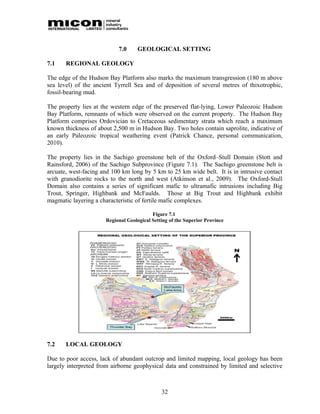
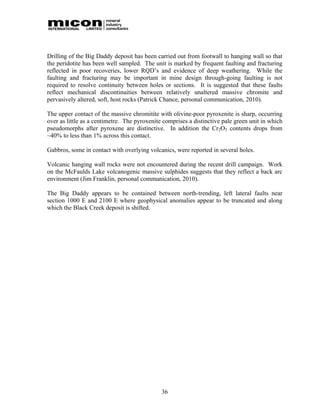
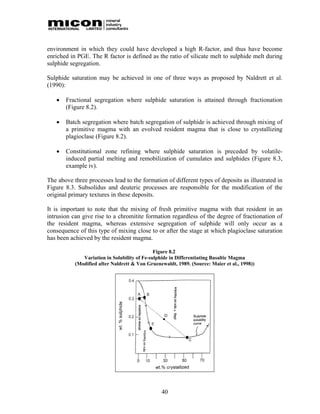
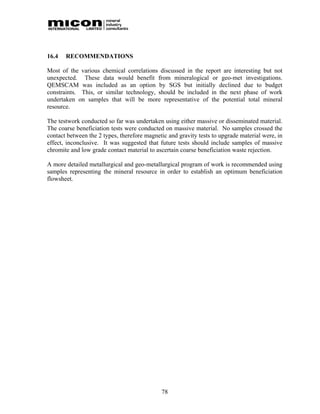
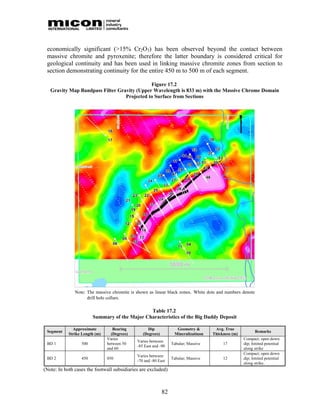
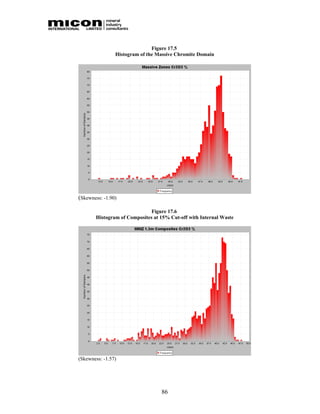
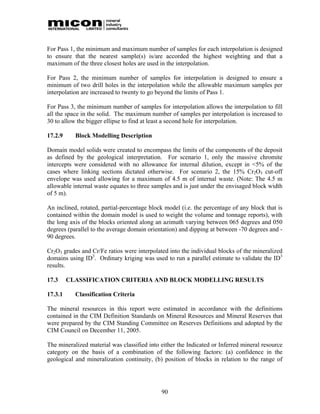
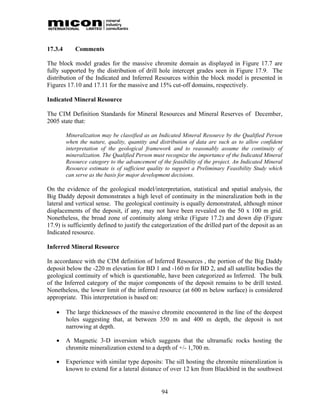
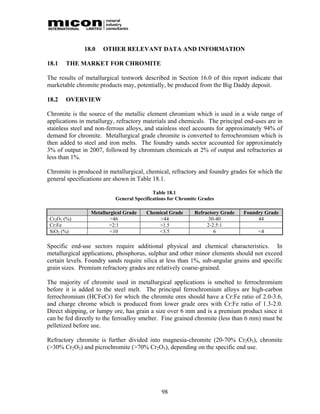
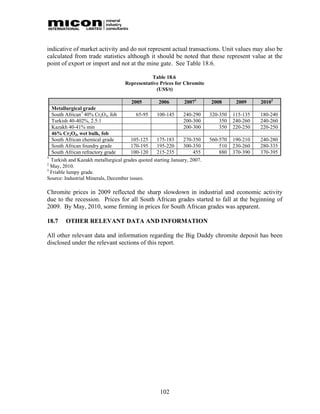
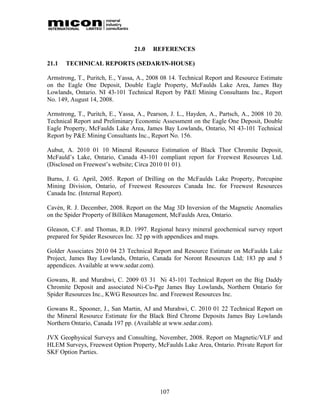
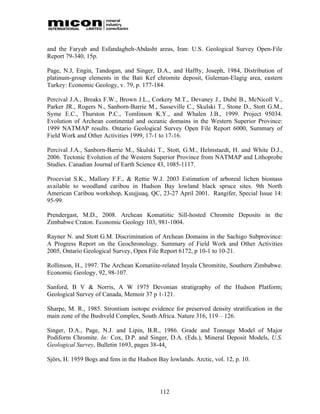
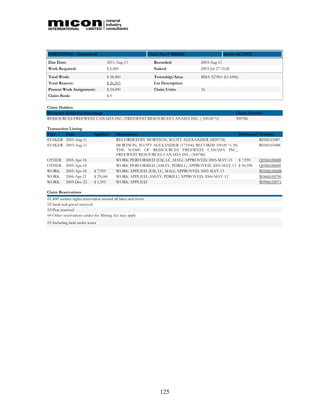
![ To try and recover non-liberated chromite from the coarse gravity separation tailings,
they were stage-ground to pass a 75 µm screen and combined with the original -75
µm fraction.
Shaking table separation followed by the Mozley mineral separator or superpanner
was used to produce a gravity concentrate from the -75 µm material.
A sub-sample from the fine tailings was tested for chromite recovery by wet high-
intensity magnetic separation [WHIMS].
It is noted that prior to each gravity separation, the magnetic iron minerals were
removed by low-intensity magnetic separation [LIMS].
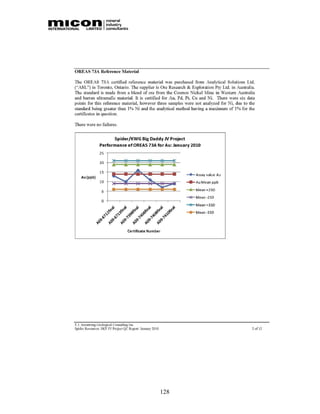
Figure 16.3
SGS Gravity and Magnetic Separation Test Flowsheet
Feed -20 mesh (850 micron)
850 x 300
300 x 75
C
M M T
C T
M
300 µm screen
Conc
Conc
Stage grind to -75µm
8 F
C In the Laboratory Rod
F Mill
C
-300µm T
2 SP
Tail T
1
3
75 µm screen SP M
Conc SP
Conc 4 75 µm screen
+75µm
-75µm 9 SP
Tail
-75µm
-75 M
C
M T 10
Conc 11
F Non-
C Mag
Tail Splitter Mag
SP
5 T
Conc
12 13 14
SP 6 SP
Mids 7
Tail
The results from the gravity/magnetic separation tests are summarized in Table 16.8 and
Table 16.9.
75](https://image.slidesharecdn.com/ni-43-101-2010-100616064720-phpapp02/85/MICON-NI-43-101-Technical-Resource-Report-85-320.jpg)

![Kjarsgaard, I. 2009 12 Petrography of a Polished Section from the McFaulds property,
Northern Ontario; DDH FW-09-33 for Dr. James Franklin. 6 pp
Lahti, H. R., April, 2008. Technical Report on the McFaulds Lake Project, Porcupine Mining
Division, James Bay Lowlands, Ontario, Canada, for UC Resources and Spider Resources
Inc.
Lahti, H. R., April, 2008. Final Report on Drill Results Spider/KWG/Freewest [SKF] Project
McFaulds Camp, Ontario. Claims 3012250, 30122252, 3012253, 3008268, 3008269 and
3008793. BMA 527861. Private Report for option parties.
Lahti, H.R. 2008 08 30 Updated Technical Report on the McFaulds Lake Project, James Bay
Lowland, Ontario, Canada 43-101 report for Spider & UC Resources, 96 pp
McBride, D. E., September, 1994. Report on the geological observations and their
significance, Spider Lake Project, Attawapiskat River, James Bay Lowlands. Unpublished
report for KWG Resources and Spider Resources Inc.
Naldrett, A.J., 2009. Report on visit to Spider-KWG and Freewest properties, September 16-
19, 2009.
Noront 2009 07 29 Noront Resources reports Thunderbird vanadium assay results; Press
release.
Noront 2010 03 09 Noront announces resource increase at Eagle's Nest deposit; Press
release.
Noront 2009 08 09 MD&A for year ended 30 April 2009
Novak, N., April 12, 2006. Spider Resource Inc. / KWG Resources Inc/ Freewest Resources
Inc., Option Agreement, West Property, Grids “H” and “J” on claims 3012250, 3012252,
3012253, 3008268, 3008269 and 3008793 (NTS 43D/16). Private Report for option parties.
Phillips Enterprises, LLC, Metallurgical Testing and Consulting Services, October 2, 2008.
Beneficiation Report.
Probe Mines 2009 08 26 Intersects High-Grade Chromite in the New Black Creek Discovery;
Press Release.
Probe Mines 2009 11 24 Phase II Drilling Results Yield More High-Grade Chromite for the
Black Creek Discovery; Press Release.
Reed, L.E. 2009 09 Notes on the Ground Magnetometer and Gravity Surveying, Grid J,
McFaulds Lake Area, Greig Lake, 42D16, Northwest Ontario 11 pp
108](https://image.slidesharecdn.com/ni-43-101-2010-100616064720-phpapp02/85/MICON-NI-43-101-Technical-Resource-Report-118-320.jpg)


The document is a technical report on the mineral resource estimate for the Big Daddy chromite deposit located in the McFaulds Lake area of northern Ontario, Canada. It covers various aspects including property description, geological outline, mineralization, exploration results, and market outlook, with a focus on the evaluation of chromite resources. The report includes recommendations for further assessment and development of the project.


