Dipmeter Data, Borehole Image Logs and Interpretation
The document discusses dipmeter data and borehole image logs, detailing their importance, sources, and applications in assessing subsurface geology. It covers the types of measurements captured, methods for image interpretation, and various products derived from the data such as plots and output files. Additionally, the document emphasizes the significance of understanding natural and un-natural fractures, bedding, and stress features for geological analysis.
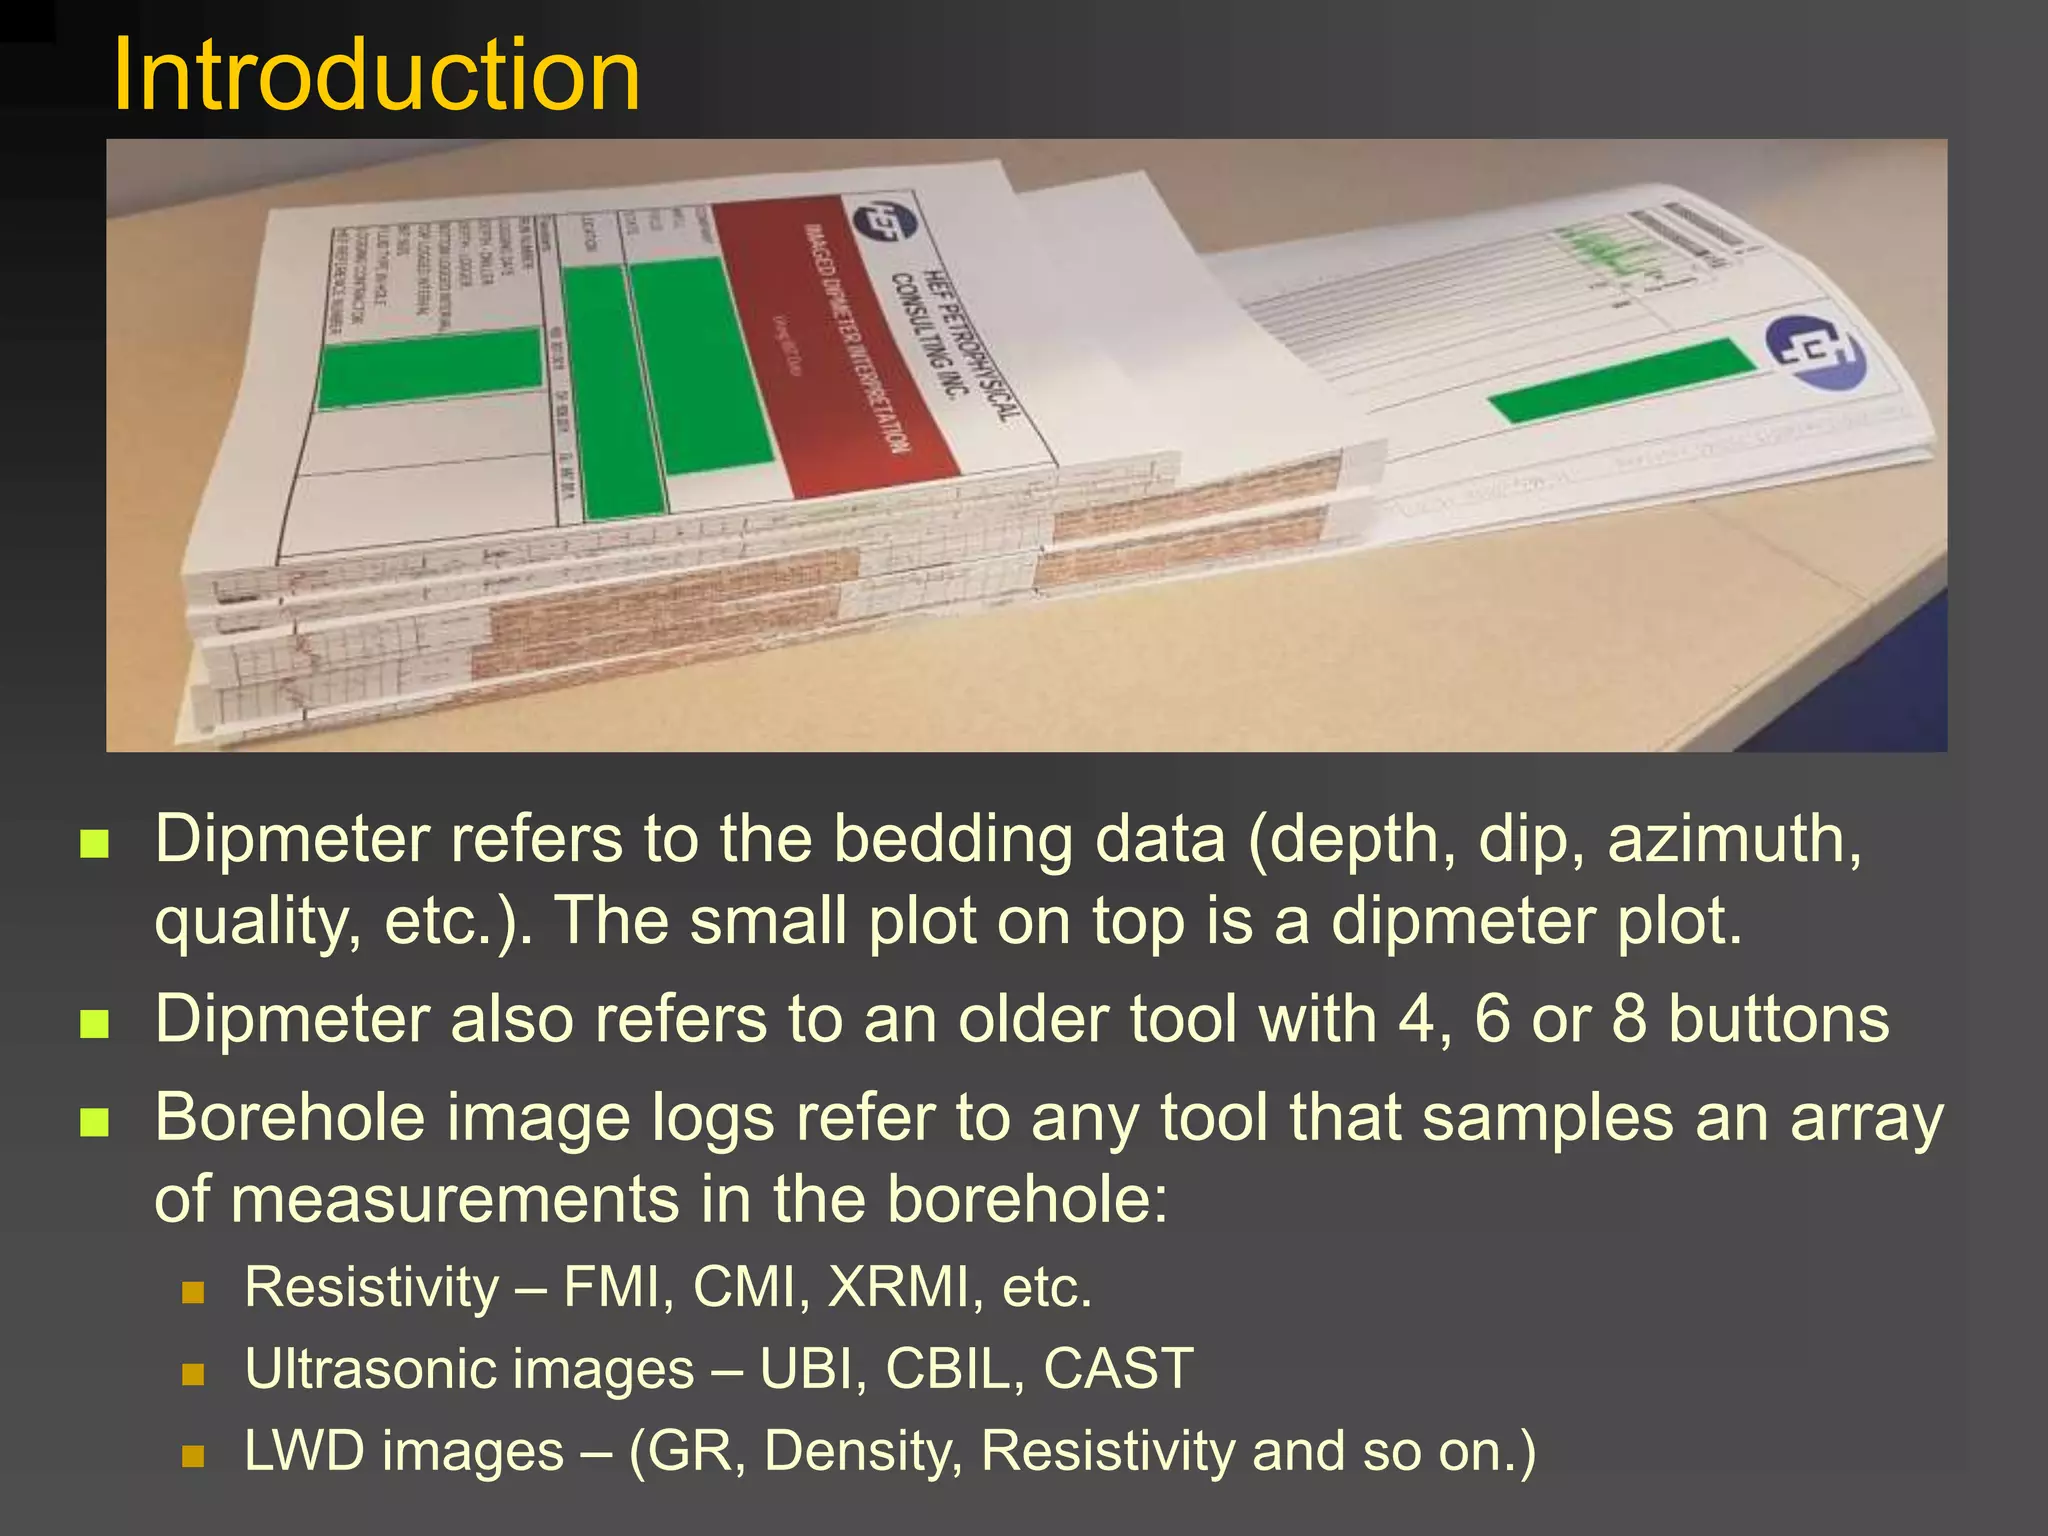
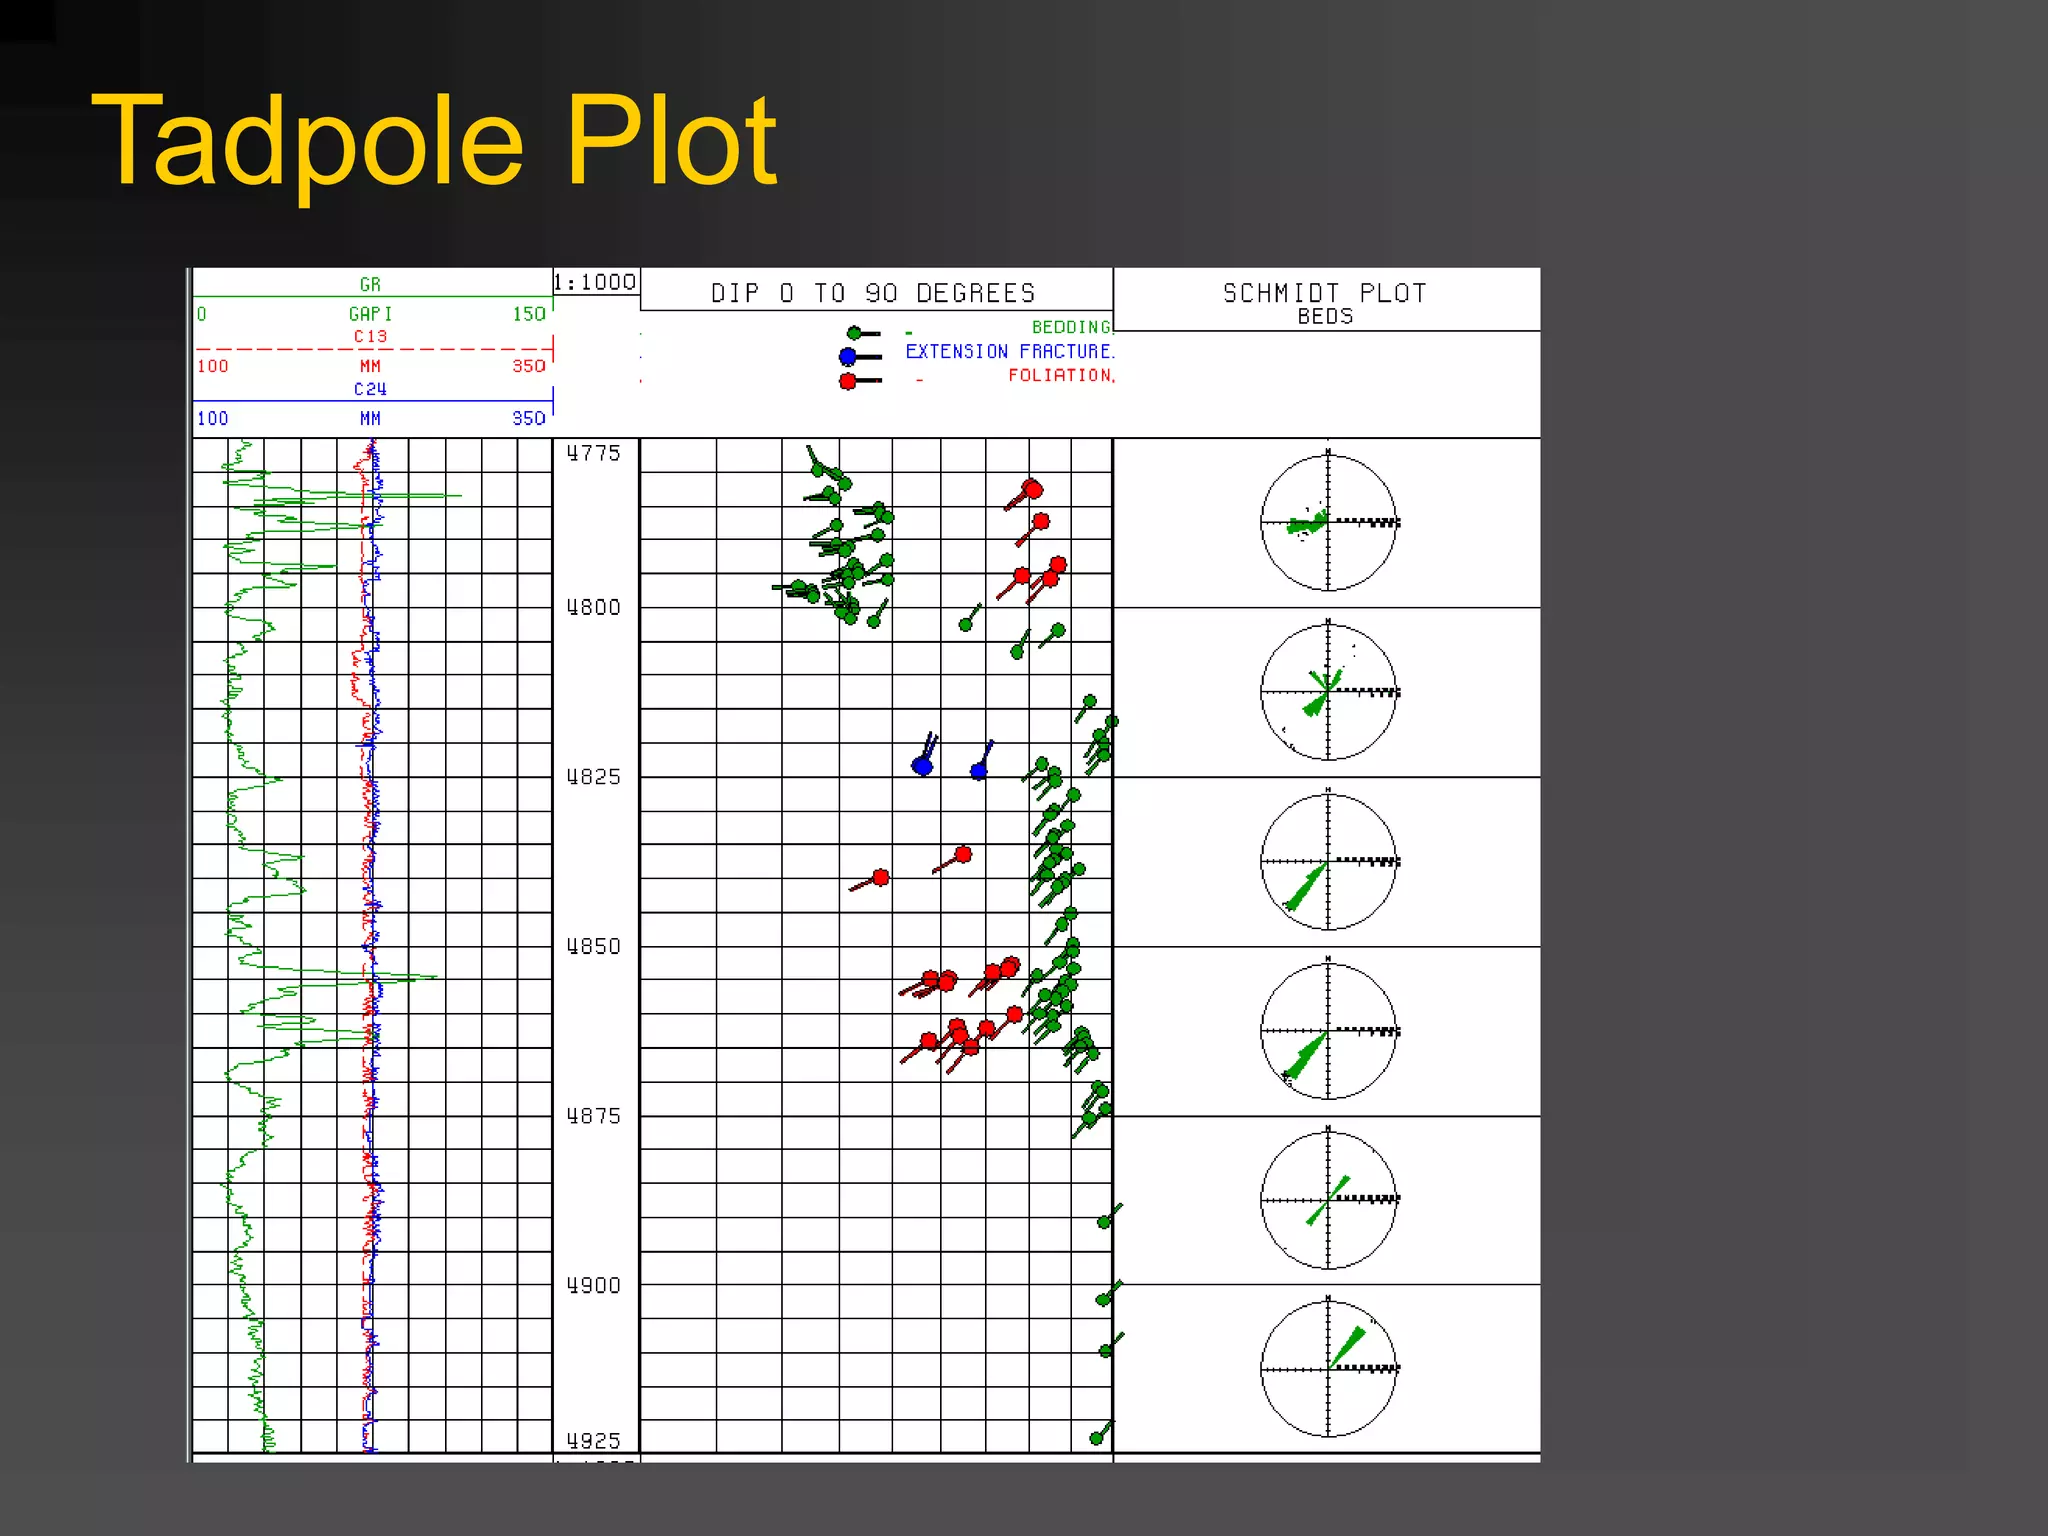
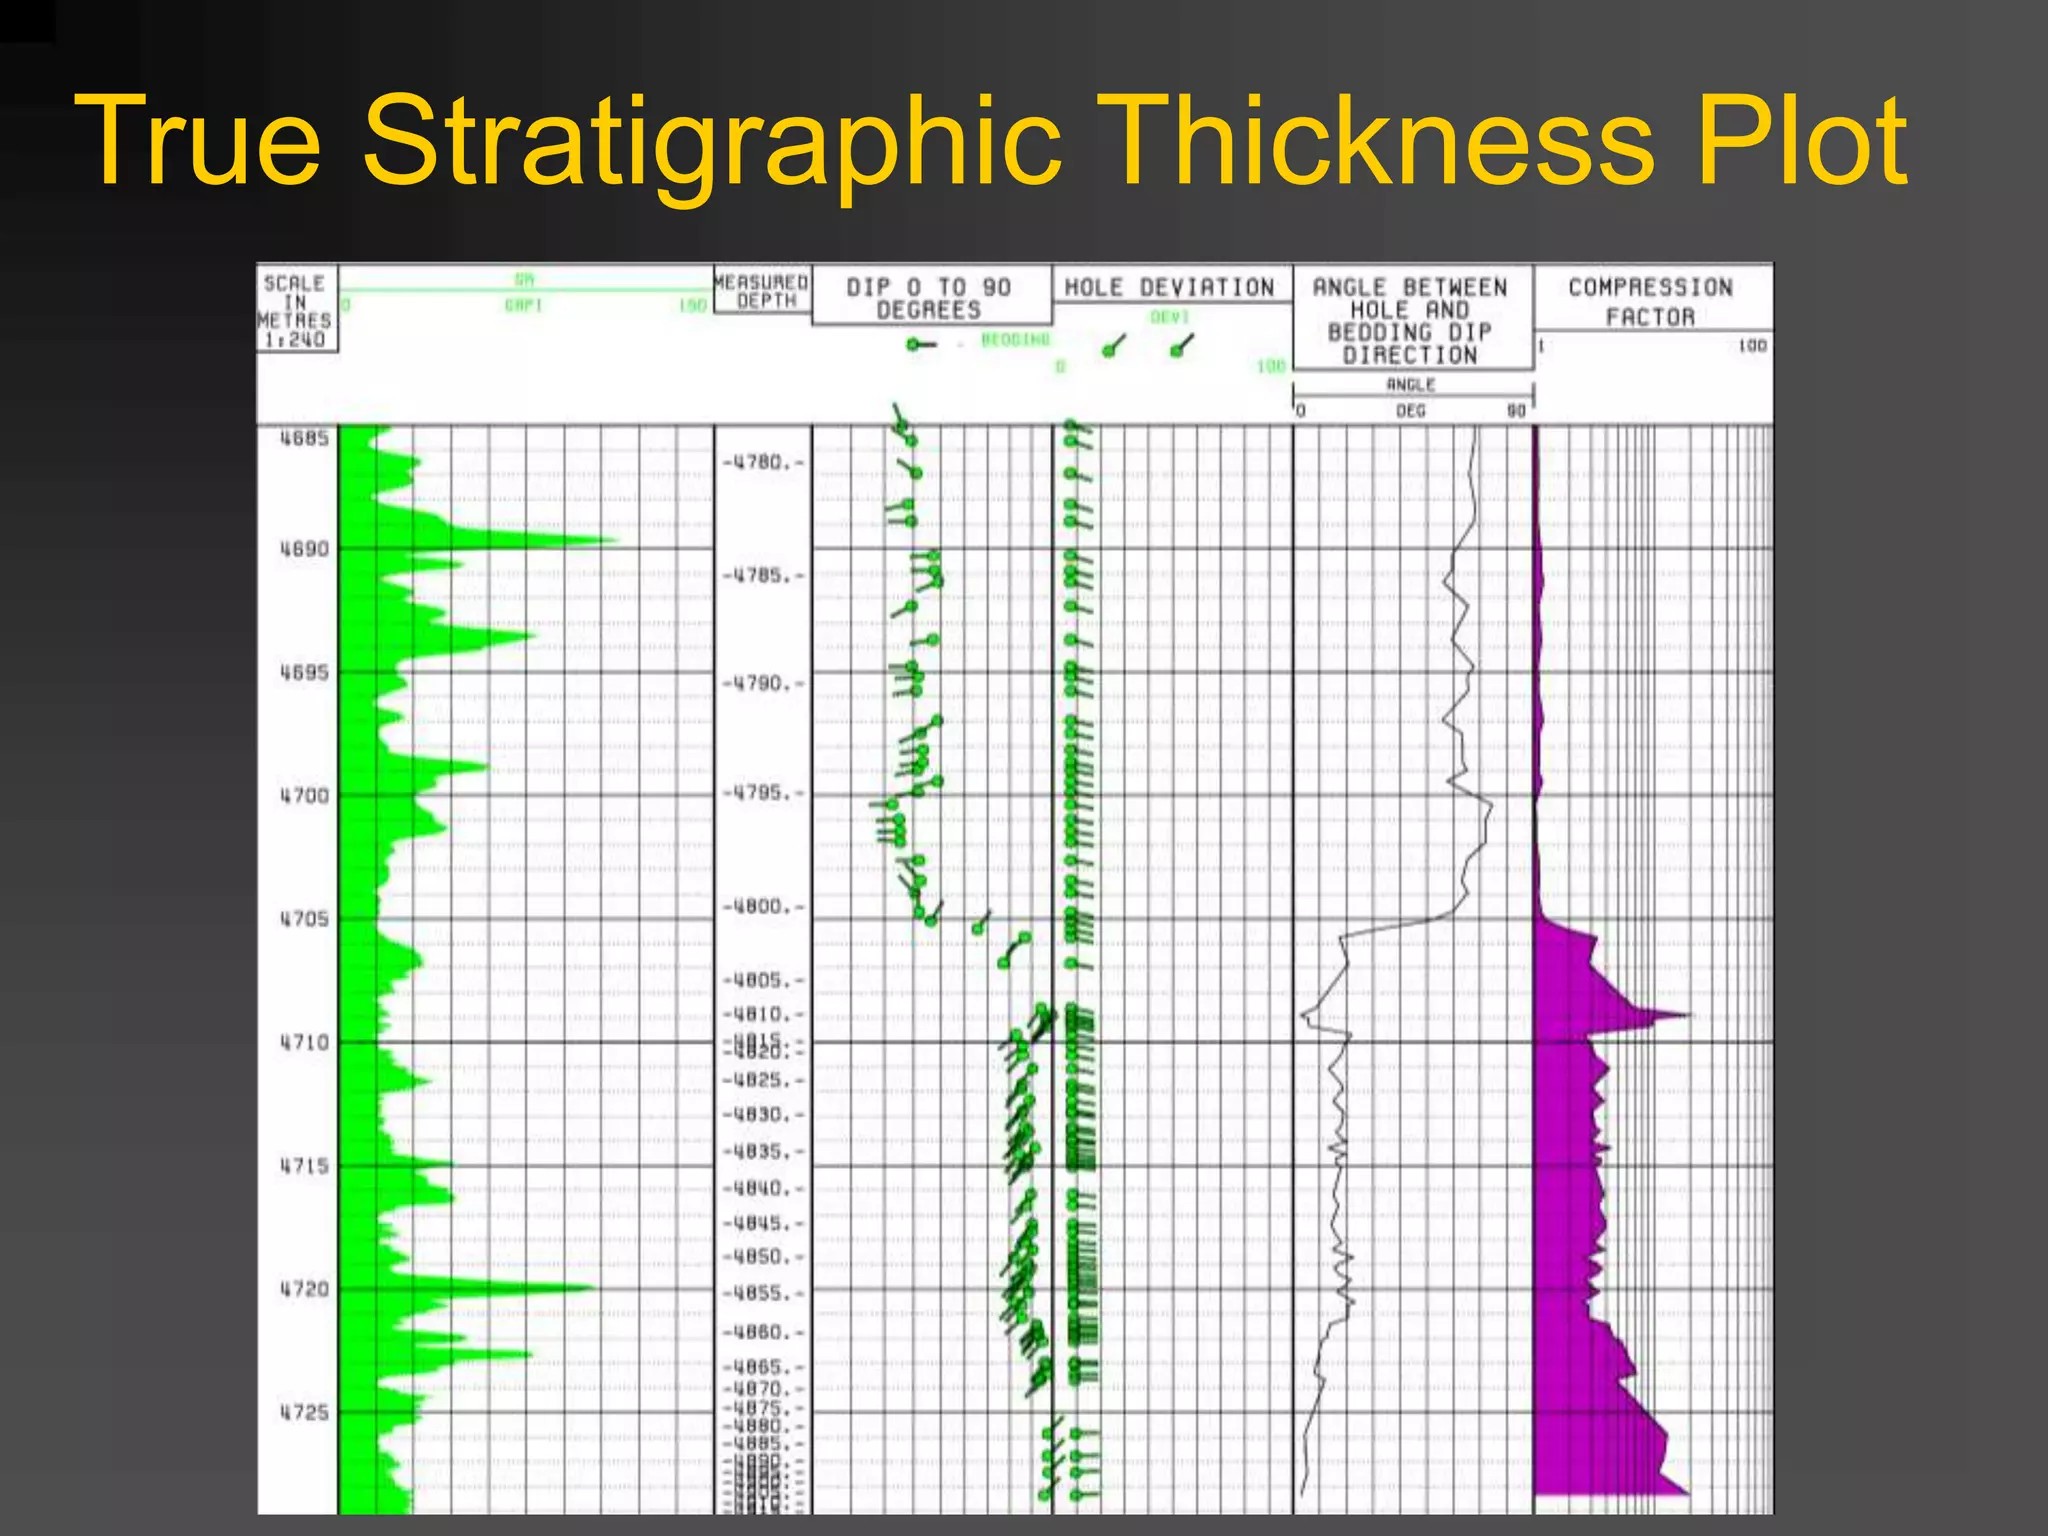
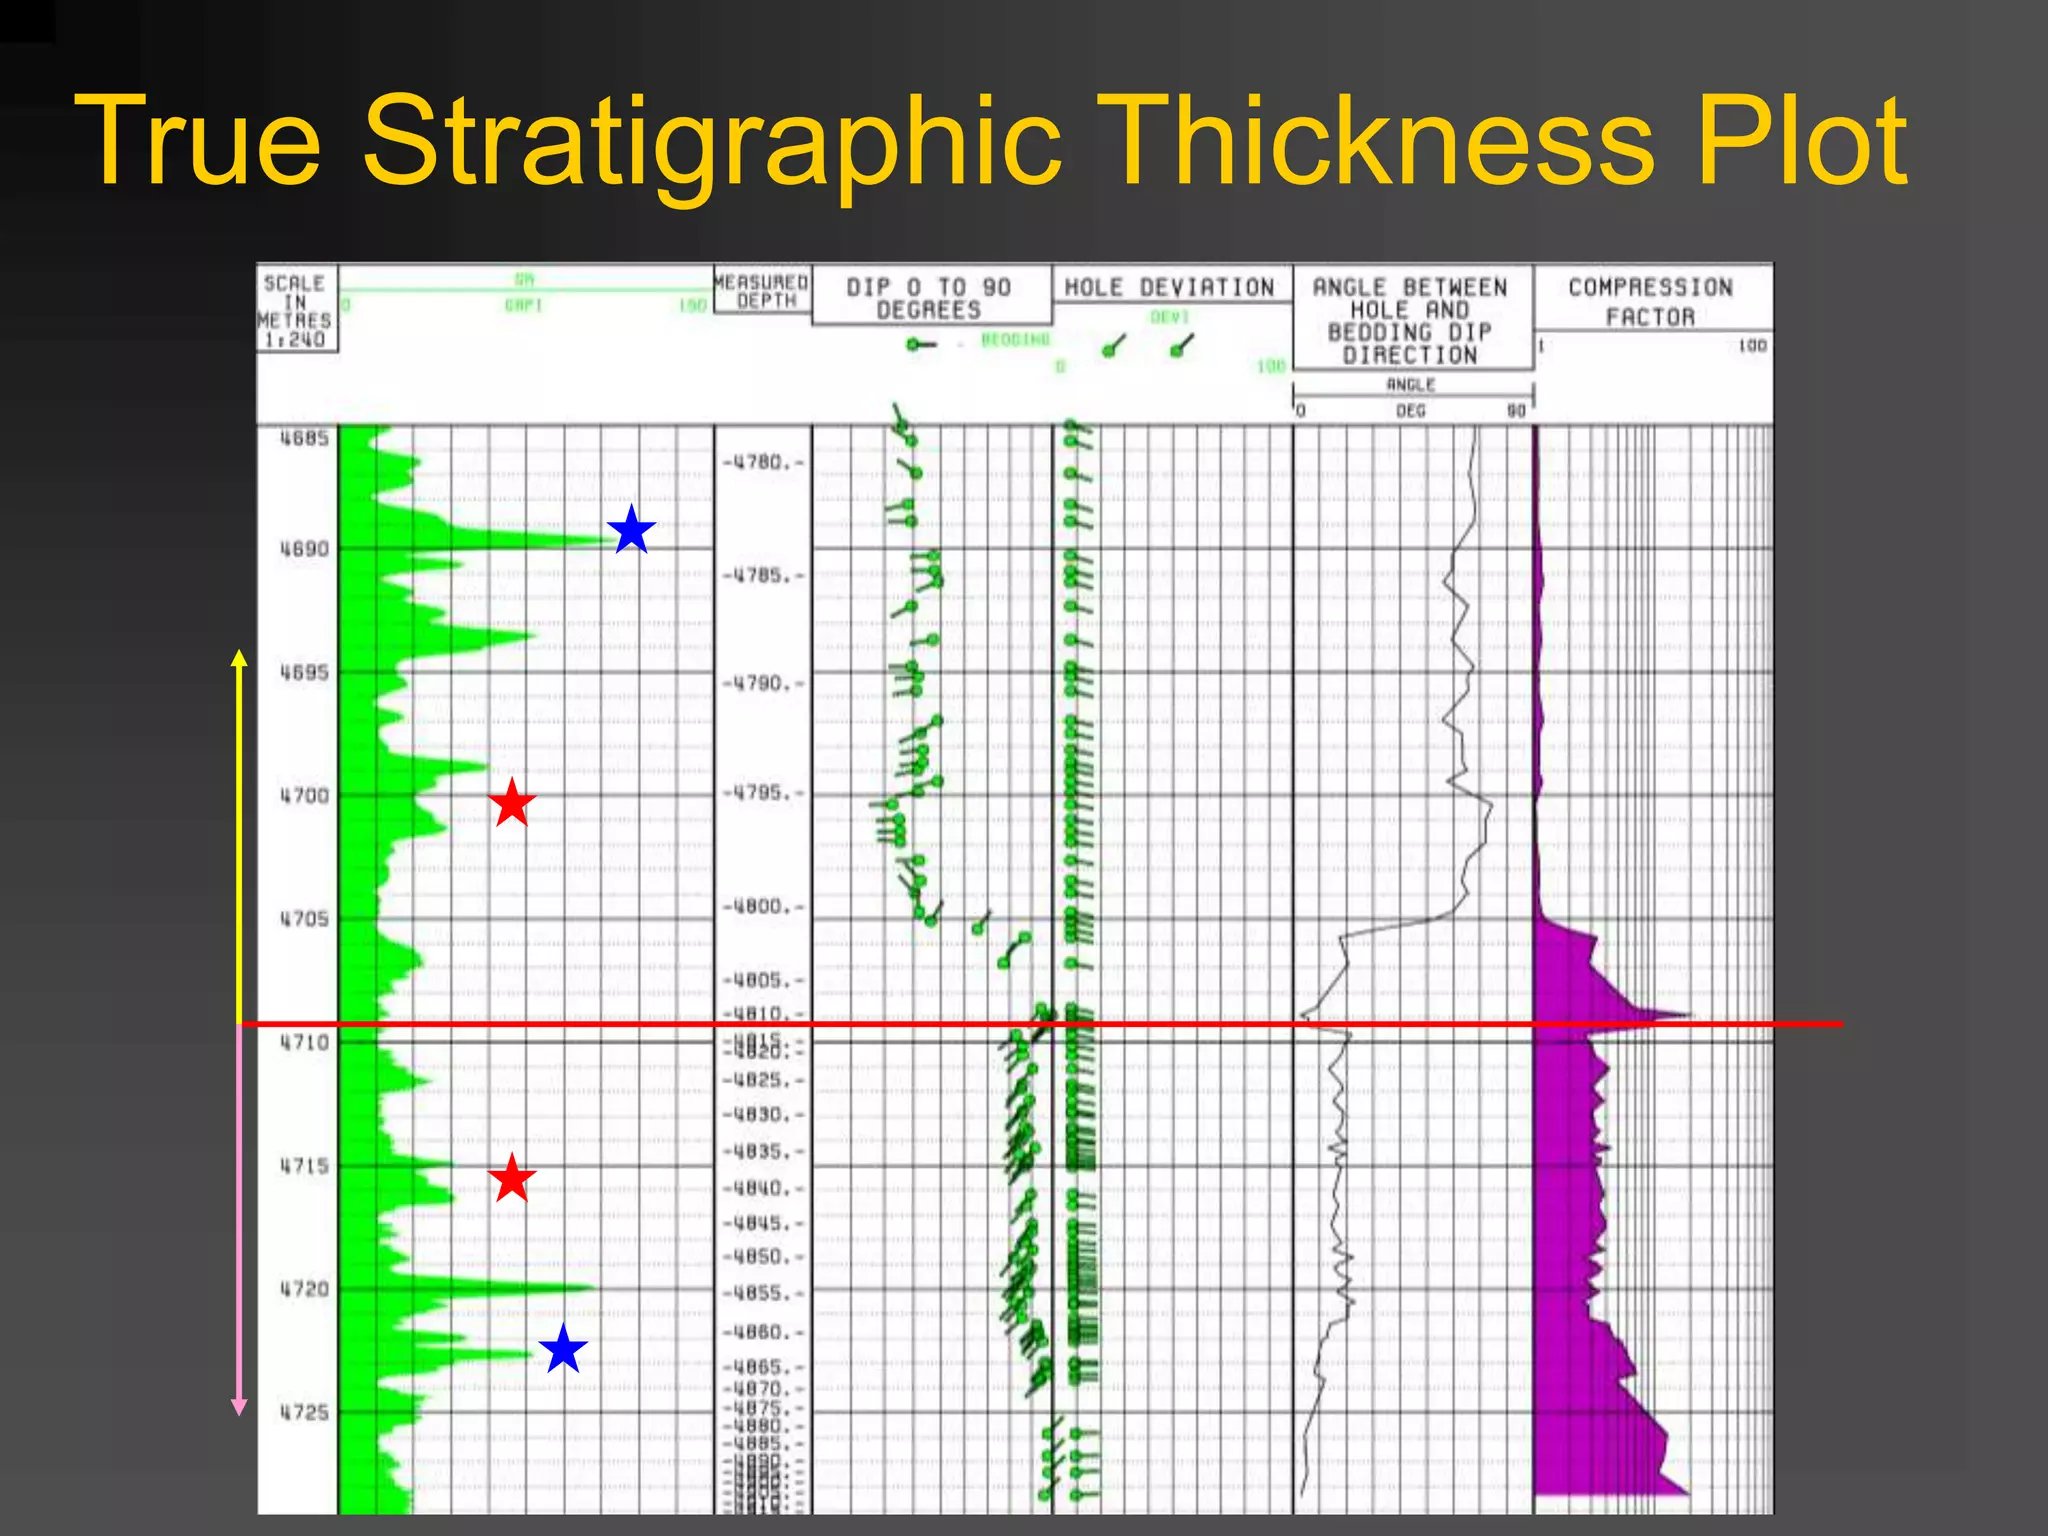
Dipmeter refersto the bedding data (depth, dip, azimuth,
quality, etc.). The small plot on top is a dipmeter plot.
Dipmeter also refers to an older tool with 4, 6 or 8 buttons
Borehole image logs refer to any tool that samples an array
of measurements in the borehole:
Resistivity – FMI, CMI, XRMI, etc.
Ultrasonic images – UBI, CBIL, CAST
LWD images – (GR, Density, Resistivity and so on.)
Introduction
3.
Data comesfrom the logging truck typically via satellite or
FTP transmission:
File types such as DLIS, TIF, LIS, XTF, AFF, LAS, CSV
Large files, often 100’s of MB
Data is also found in digital archives:
Corporate archives as digital or paper well files
Government archives (BCOGC), as scans, paper logs, and digital
Service company archives (HEF for example has more than 10,000
wells in our Recall Database dating back to the early 90’s)
Log data vendor archives as rasters, etc.
Digitized data such as ASCII bed dip files from above sources
Data can also be sourced from physical media:
Magnetic tapes, CD/DVD, scanning old paper prints and so on…
Introduction – input data sources
4.
Outline
Basics ofborehole image interpretation
Bedding and structural dip analysis
Natural fractures
Stress features
5.
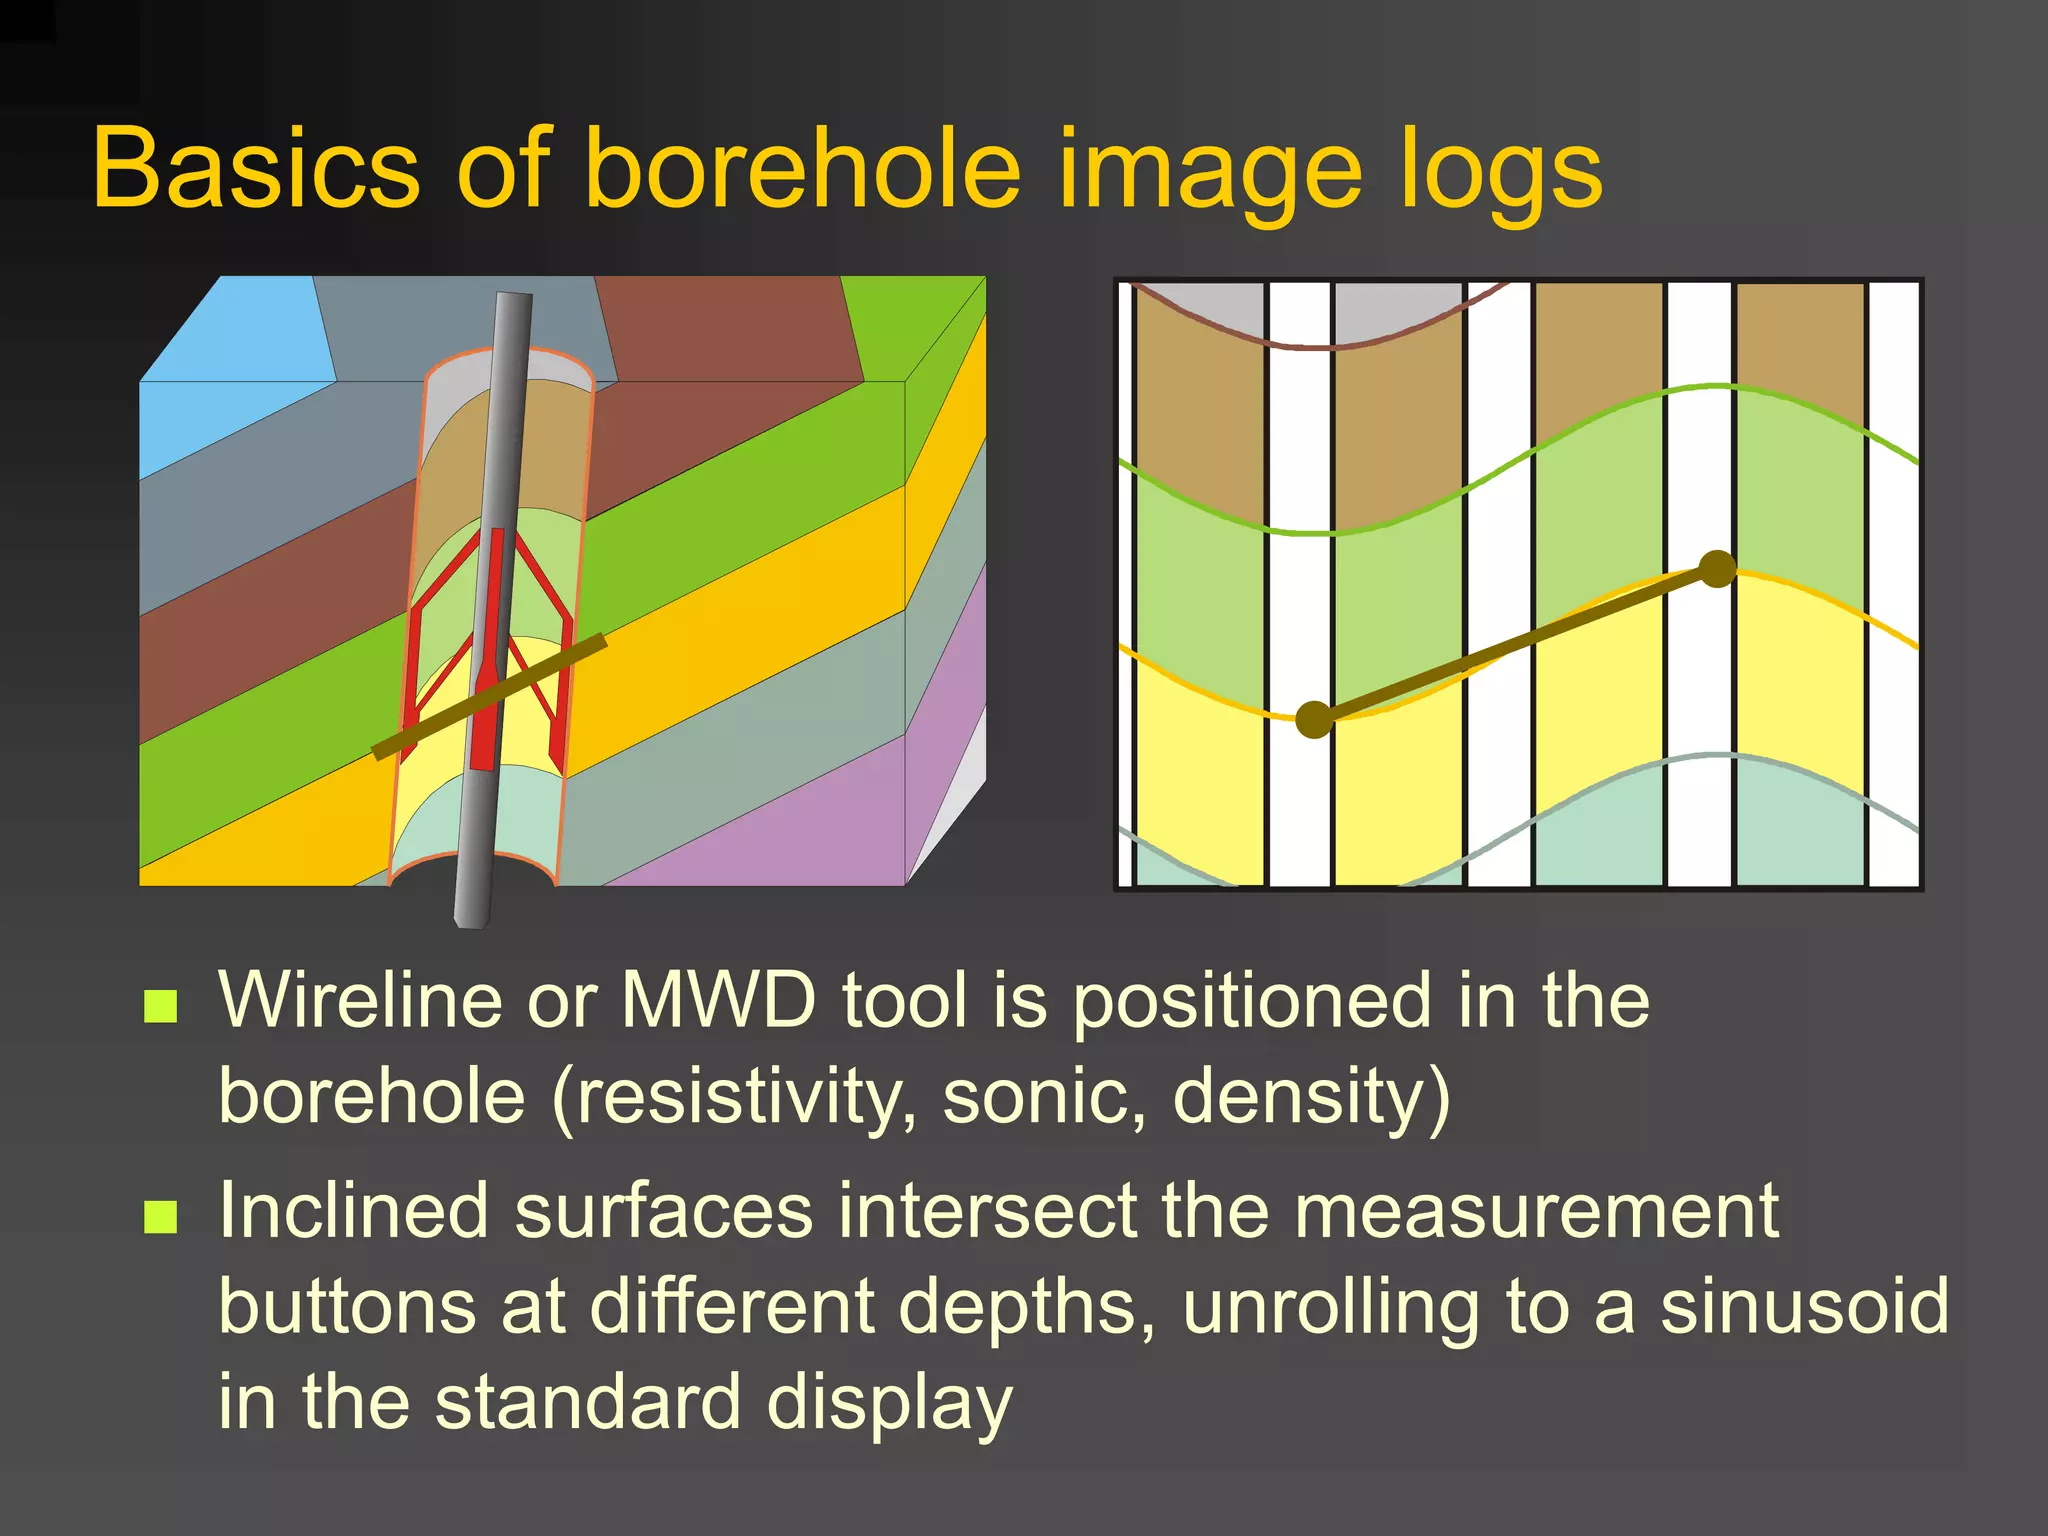
Basics of boreholeimage logs
Wireline or MWD tool is positioned in the
borehole (resistivity, sonic, density, gr)
Inclined surfaces intersect the measurement
buttons at different depths, unrolling to a sinusoid
in the standard display
6.
Basics of boreholeimage logs
Wireline or MWD tool is positioned in the
borehole (resistivity, sonic, density)
Inclined surfaces intersect the measurement
buttons at different depths, unrolling to a sinusoid
in the standard display
7.
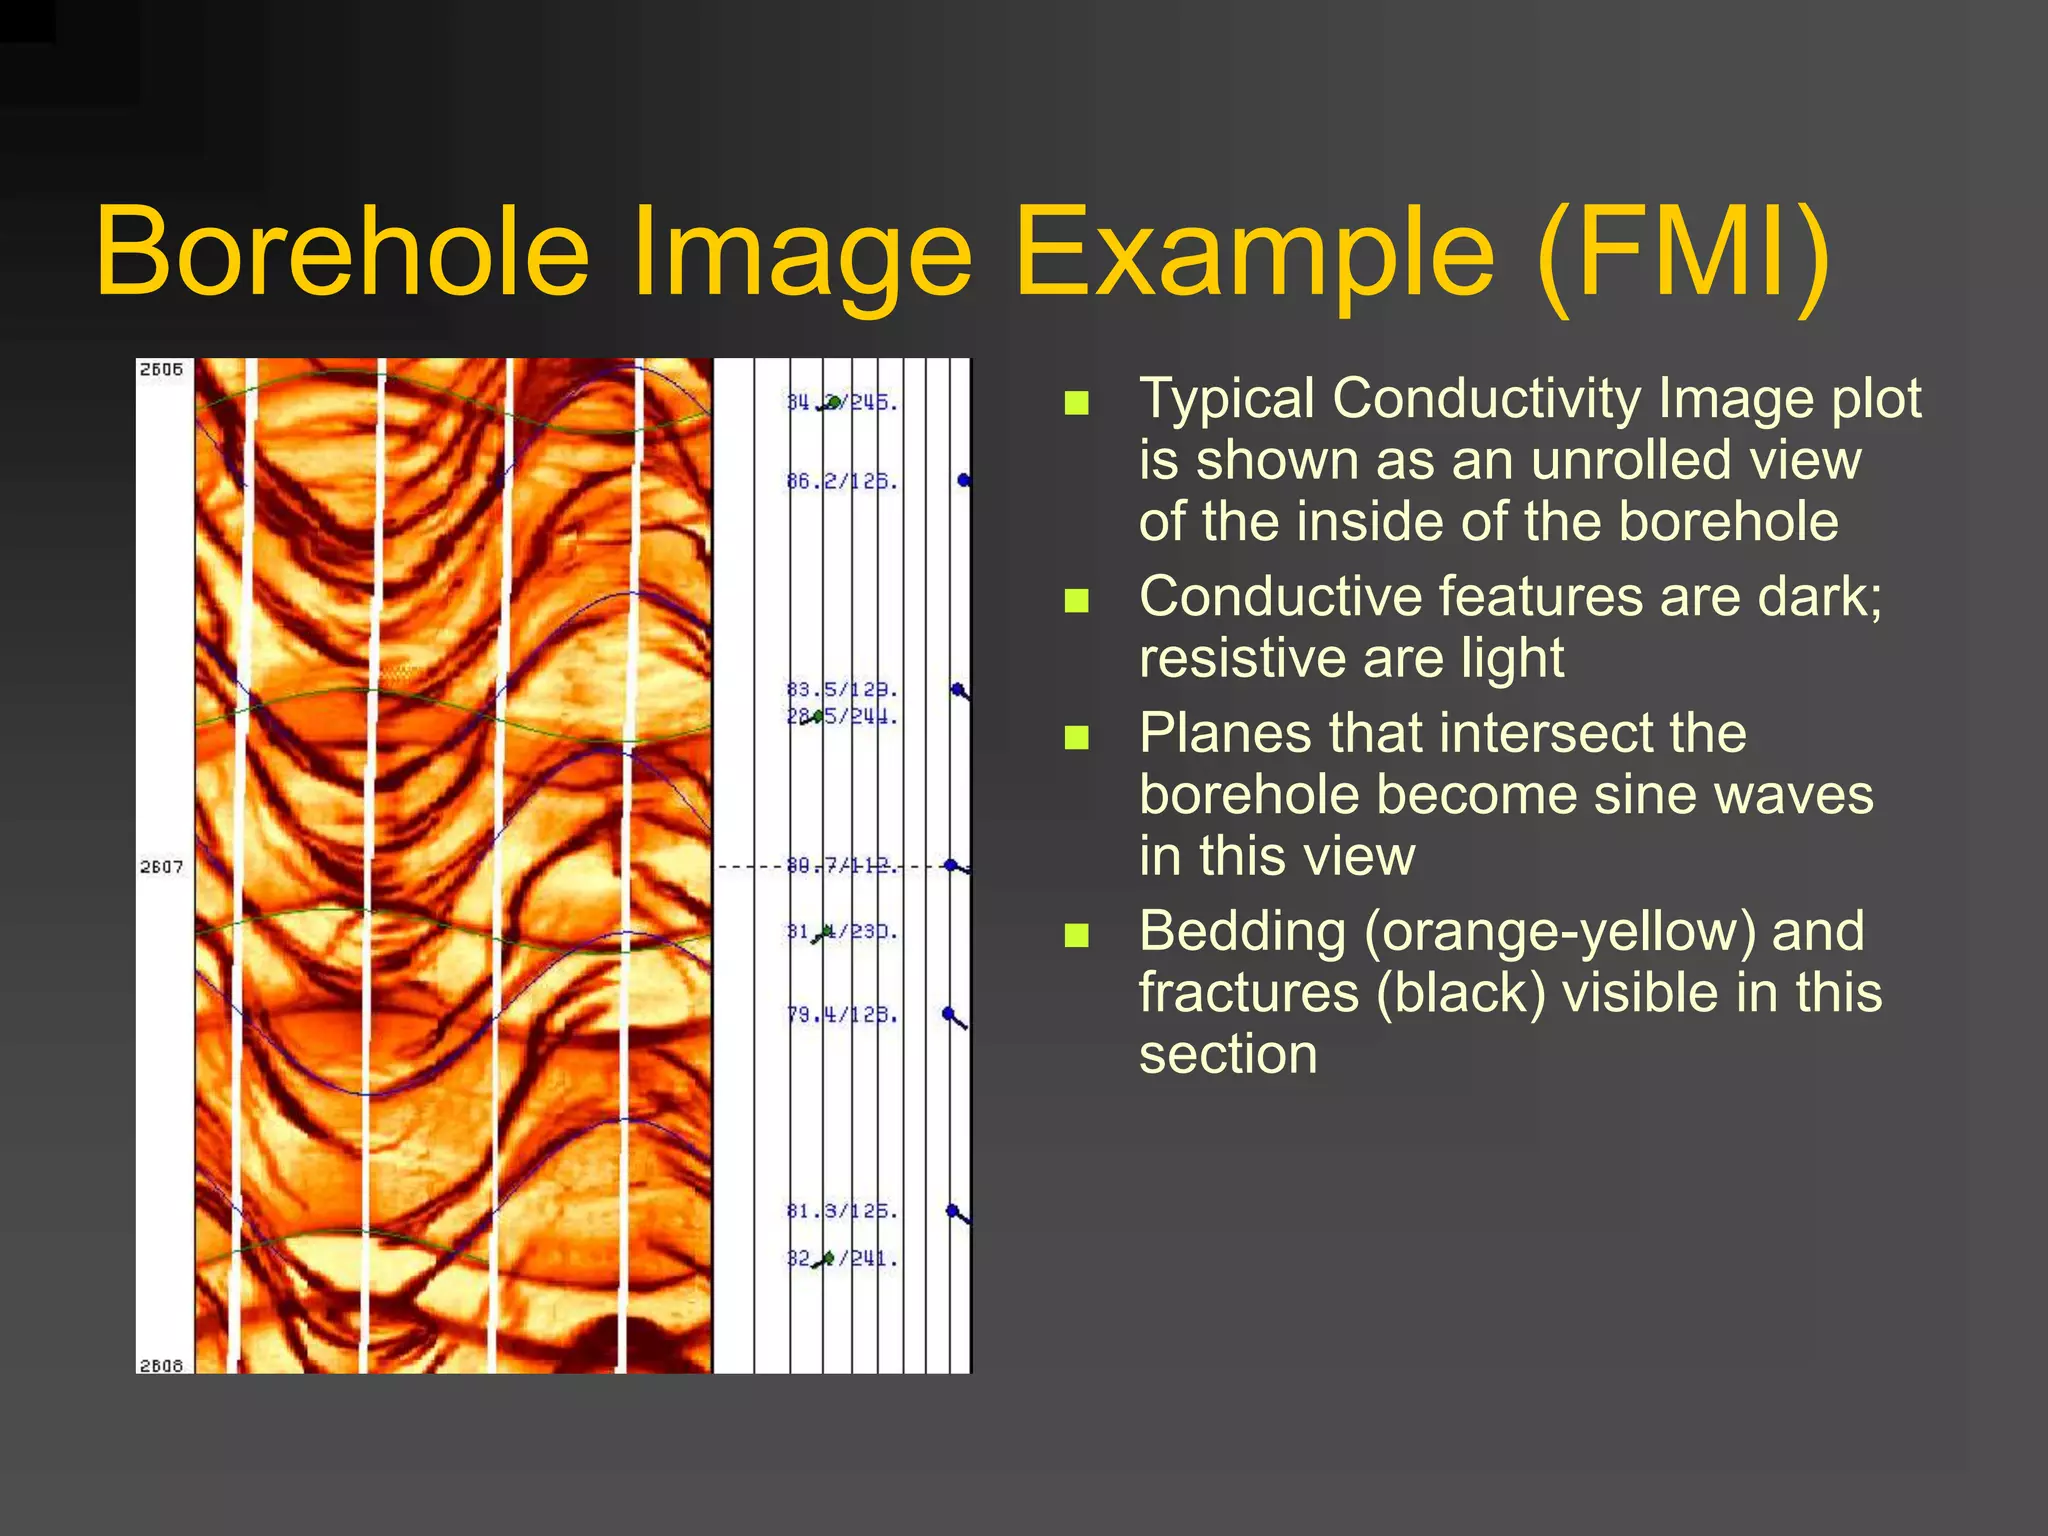
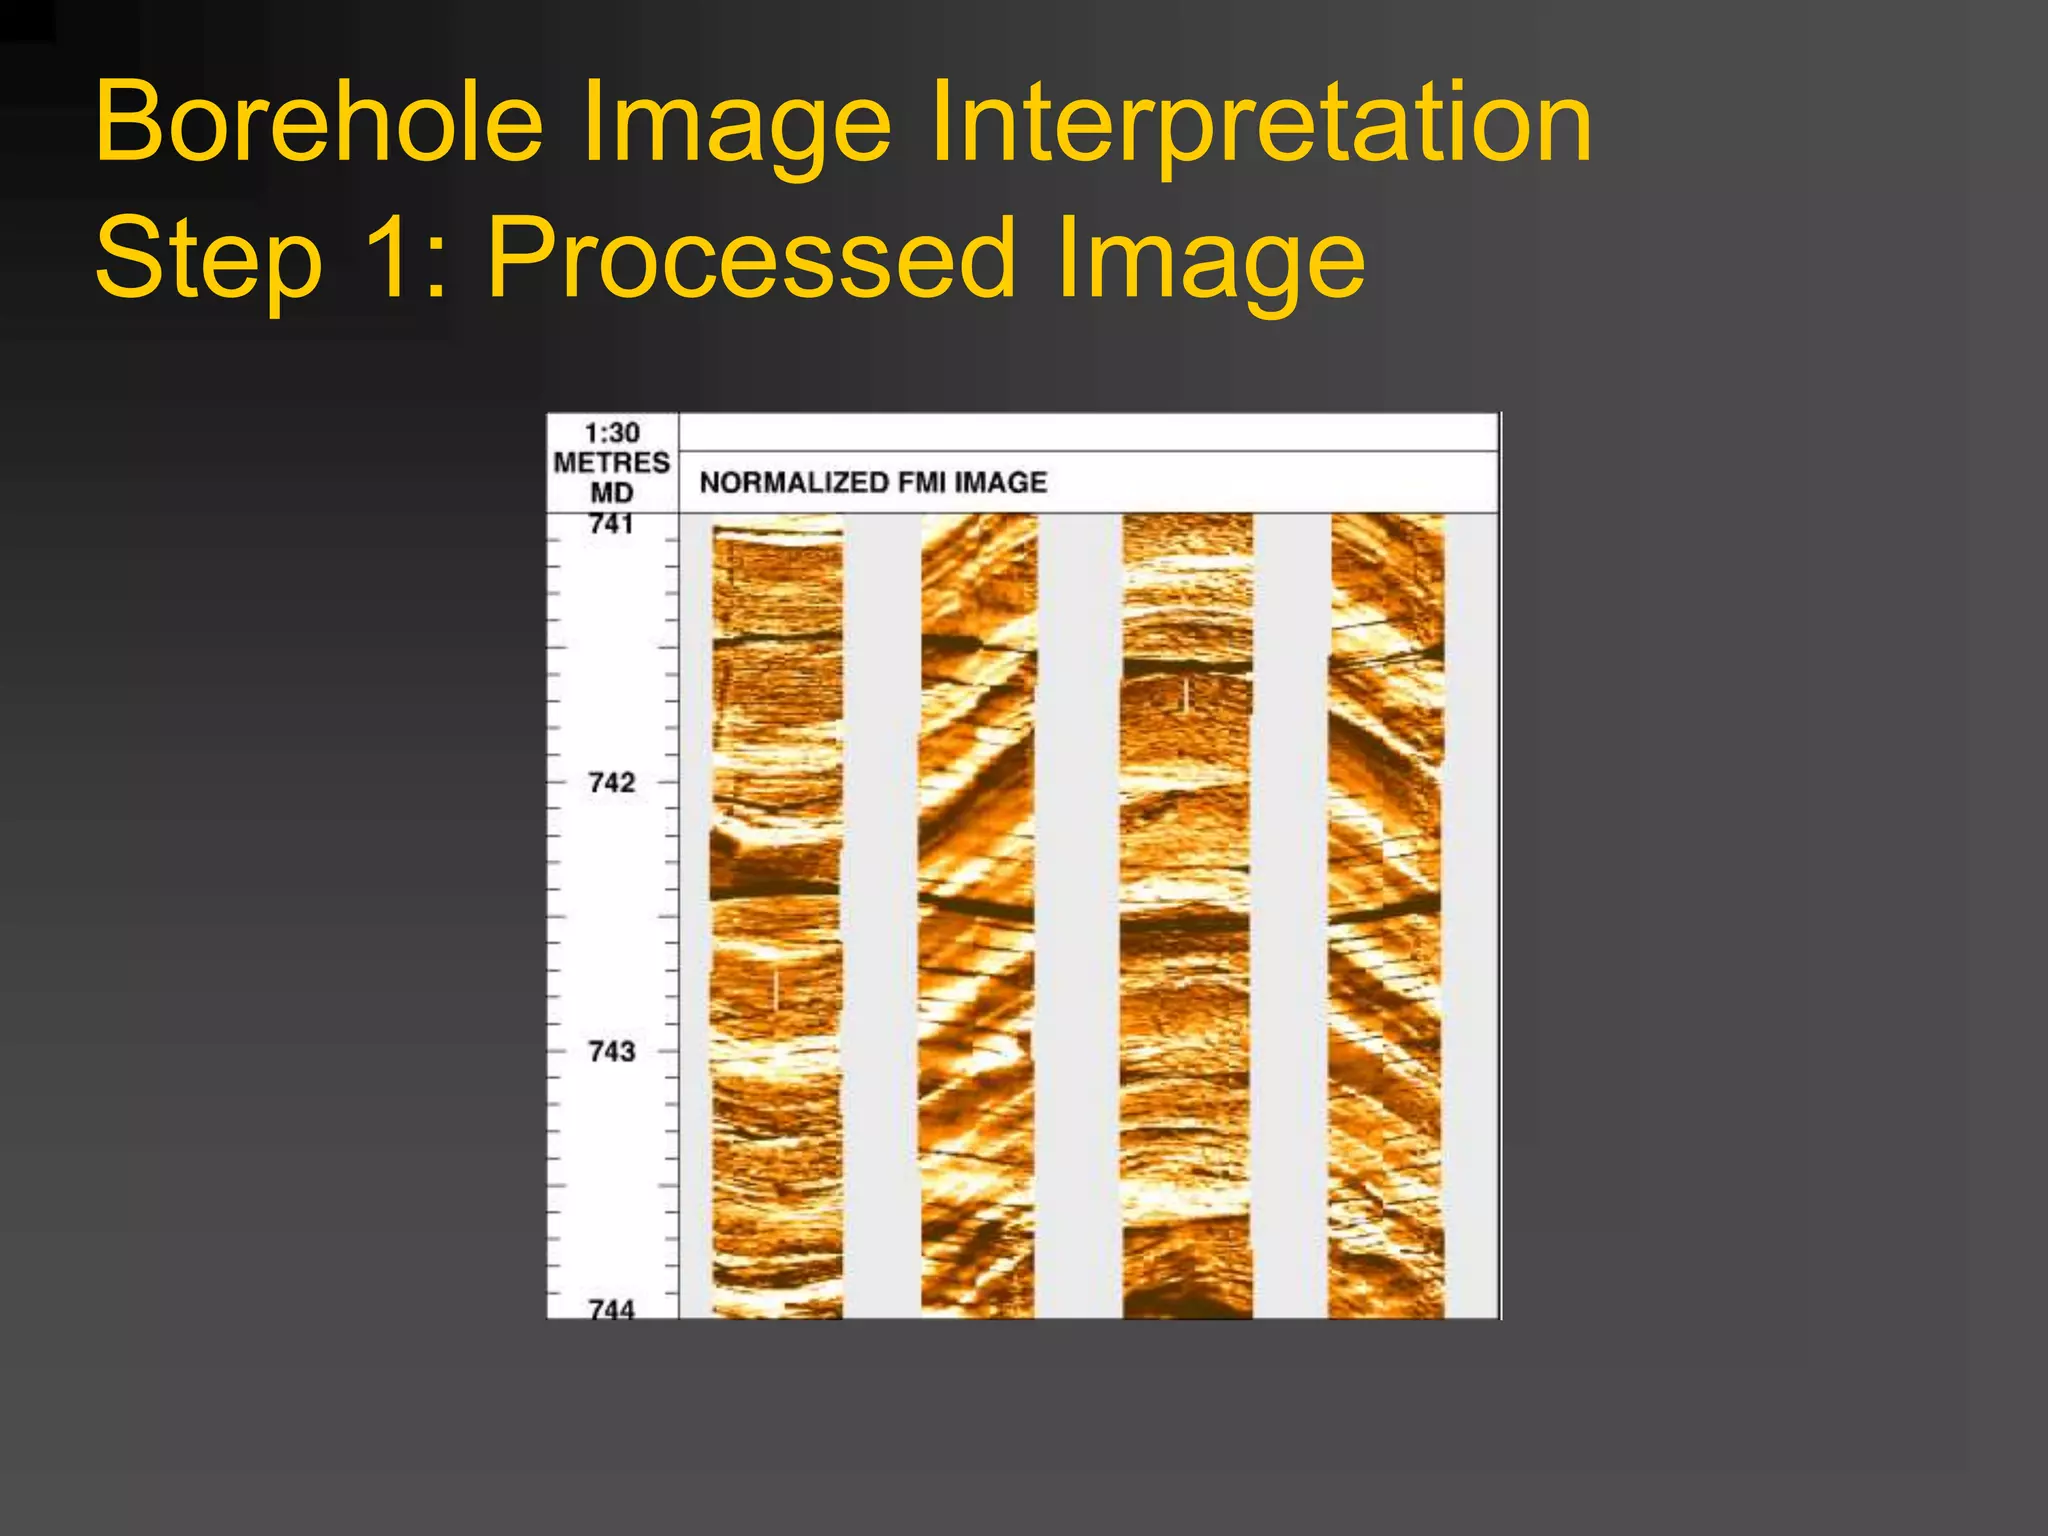
Typical ConductivityImage plot
is shown as an unrolled view
of the inside of the borehole
Conductive features are dark;
resistive are light
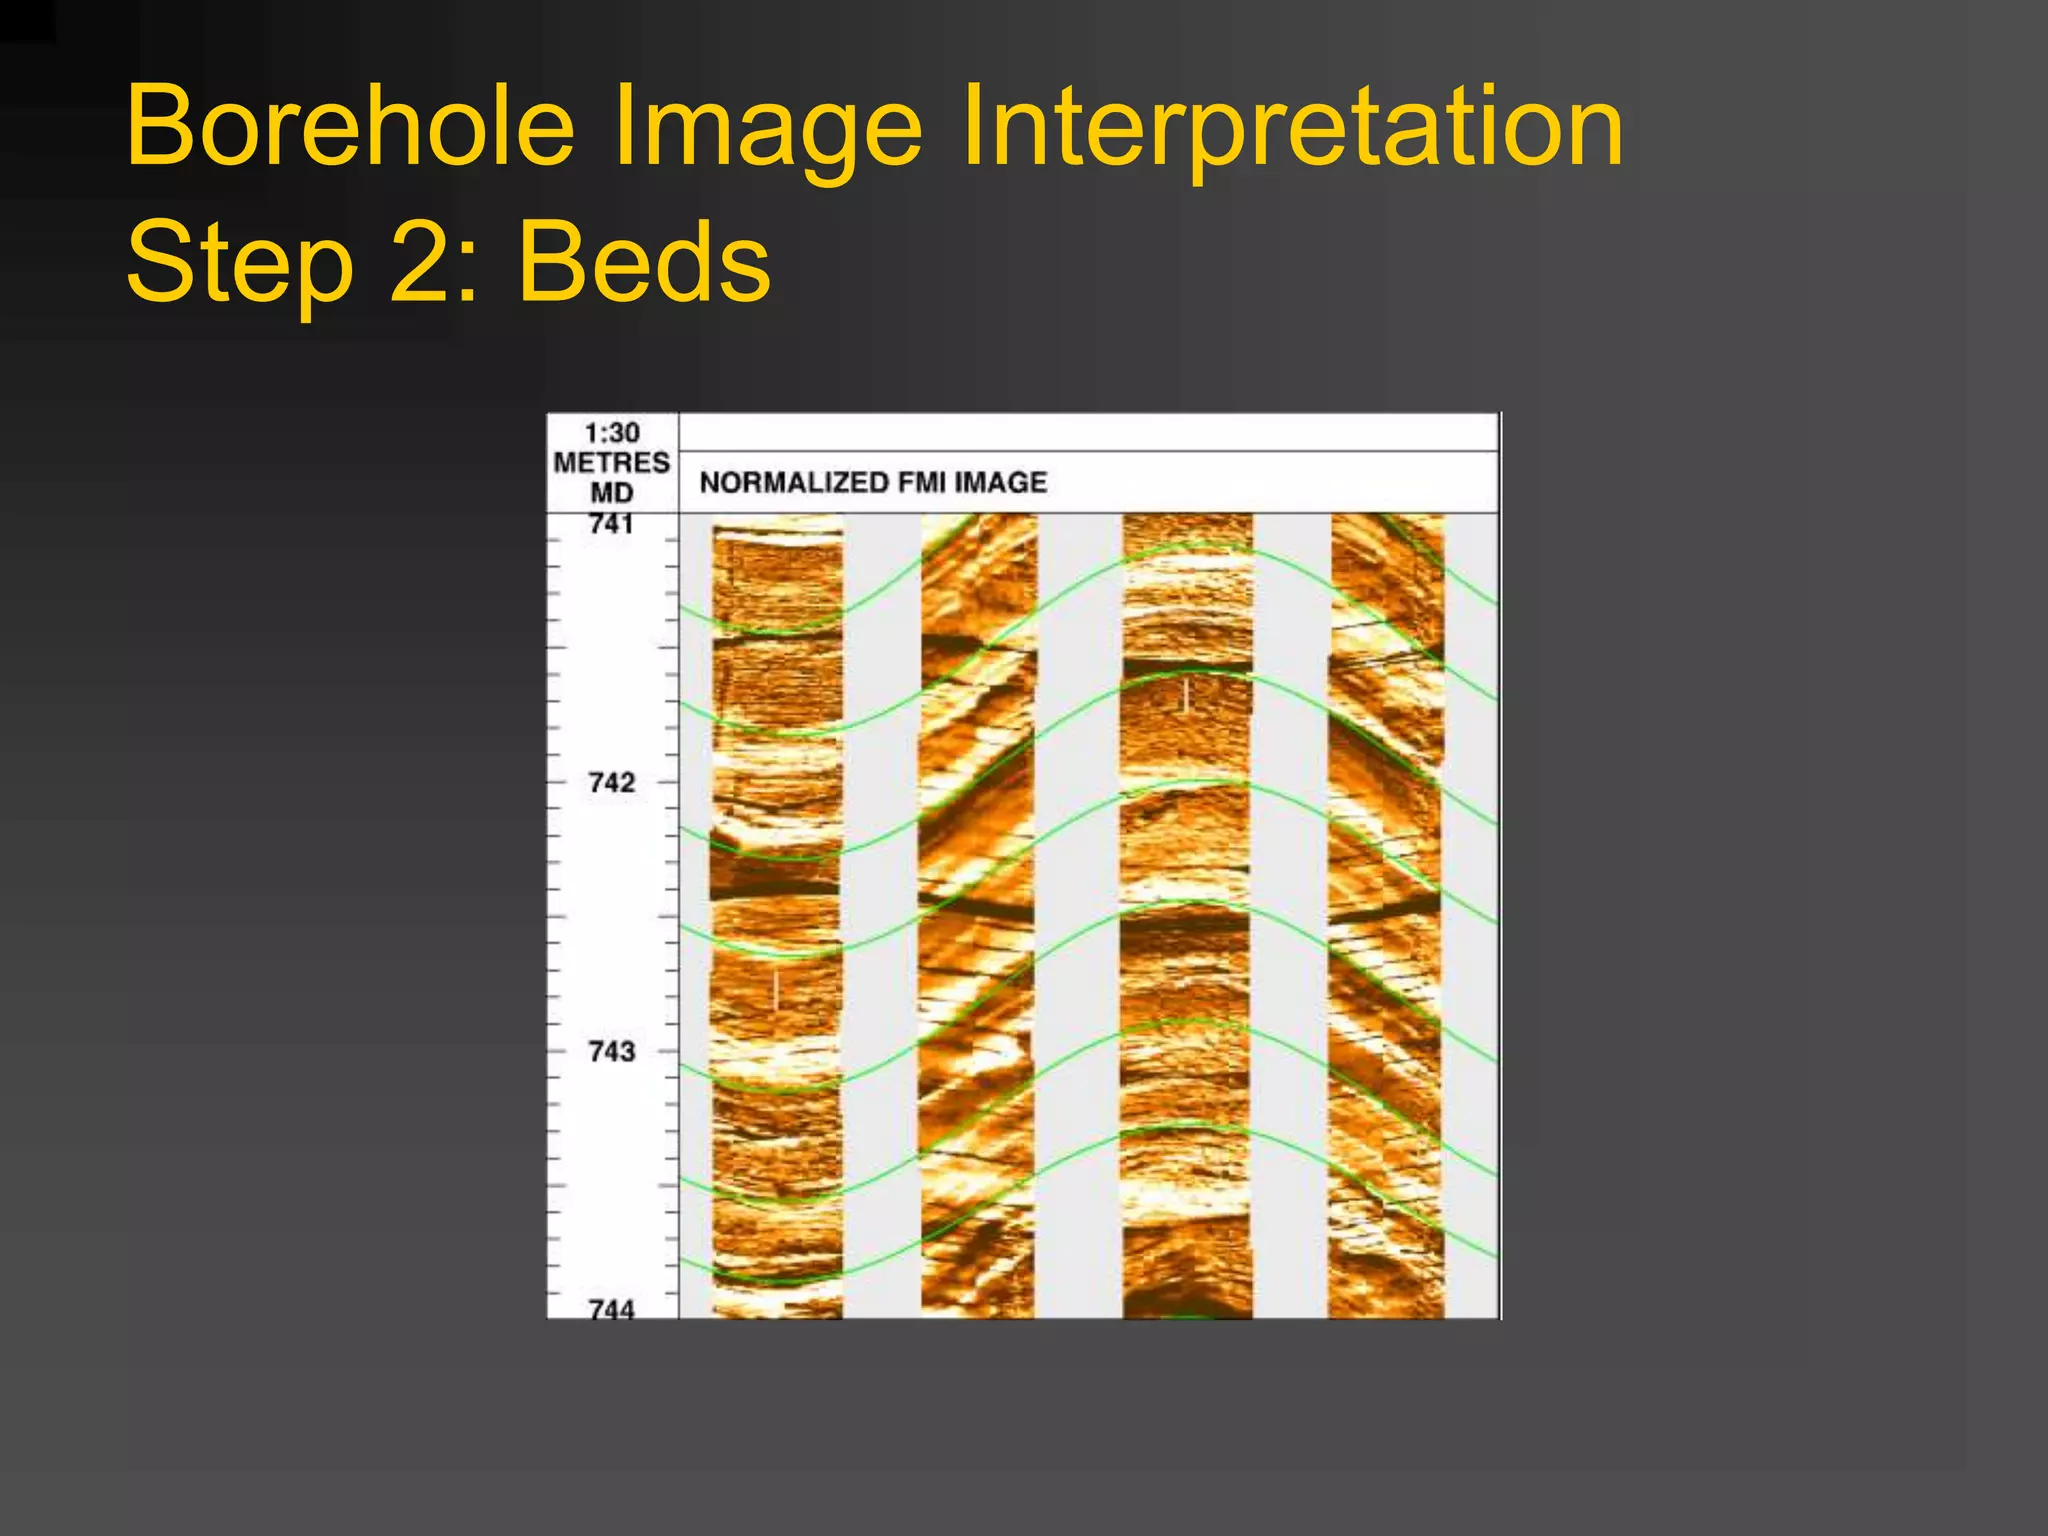
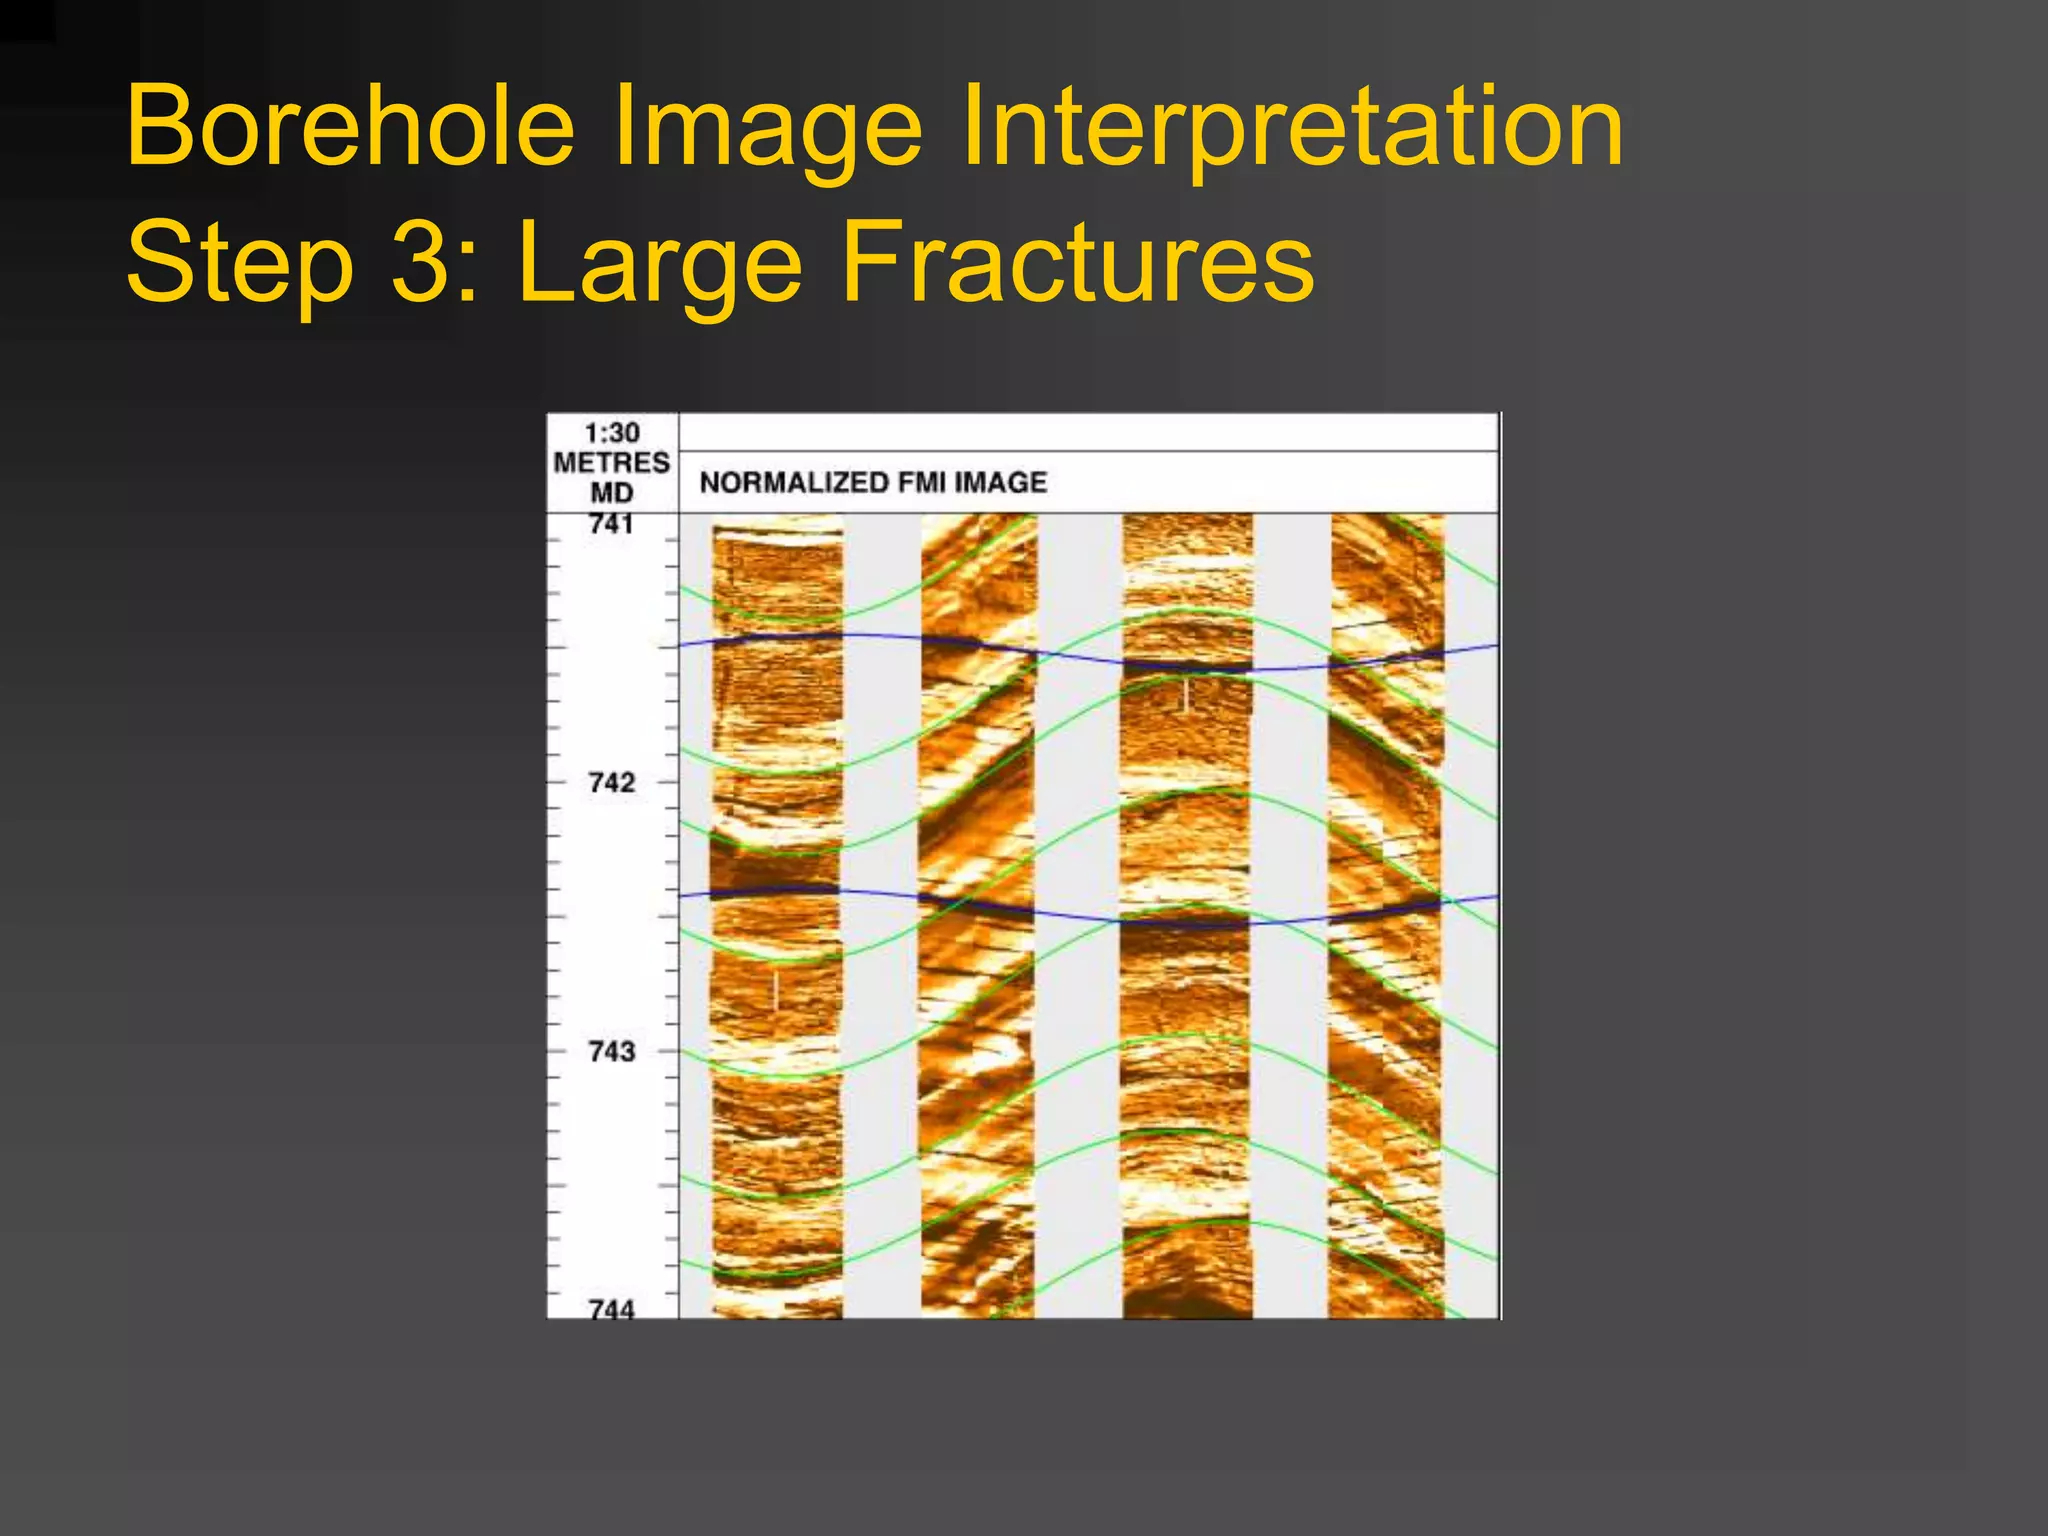
Planes that intersect the
borehole become sine waves
in this view
Bedding (orange-yellow) and
fractures (black) visible in this
section
Borehole Image Example (FMI)
8.
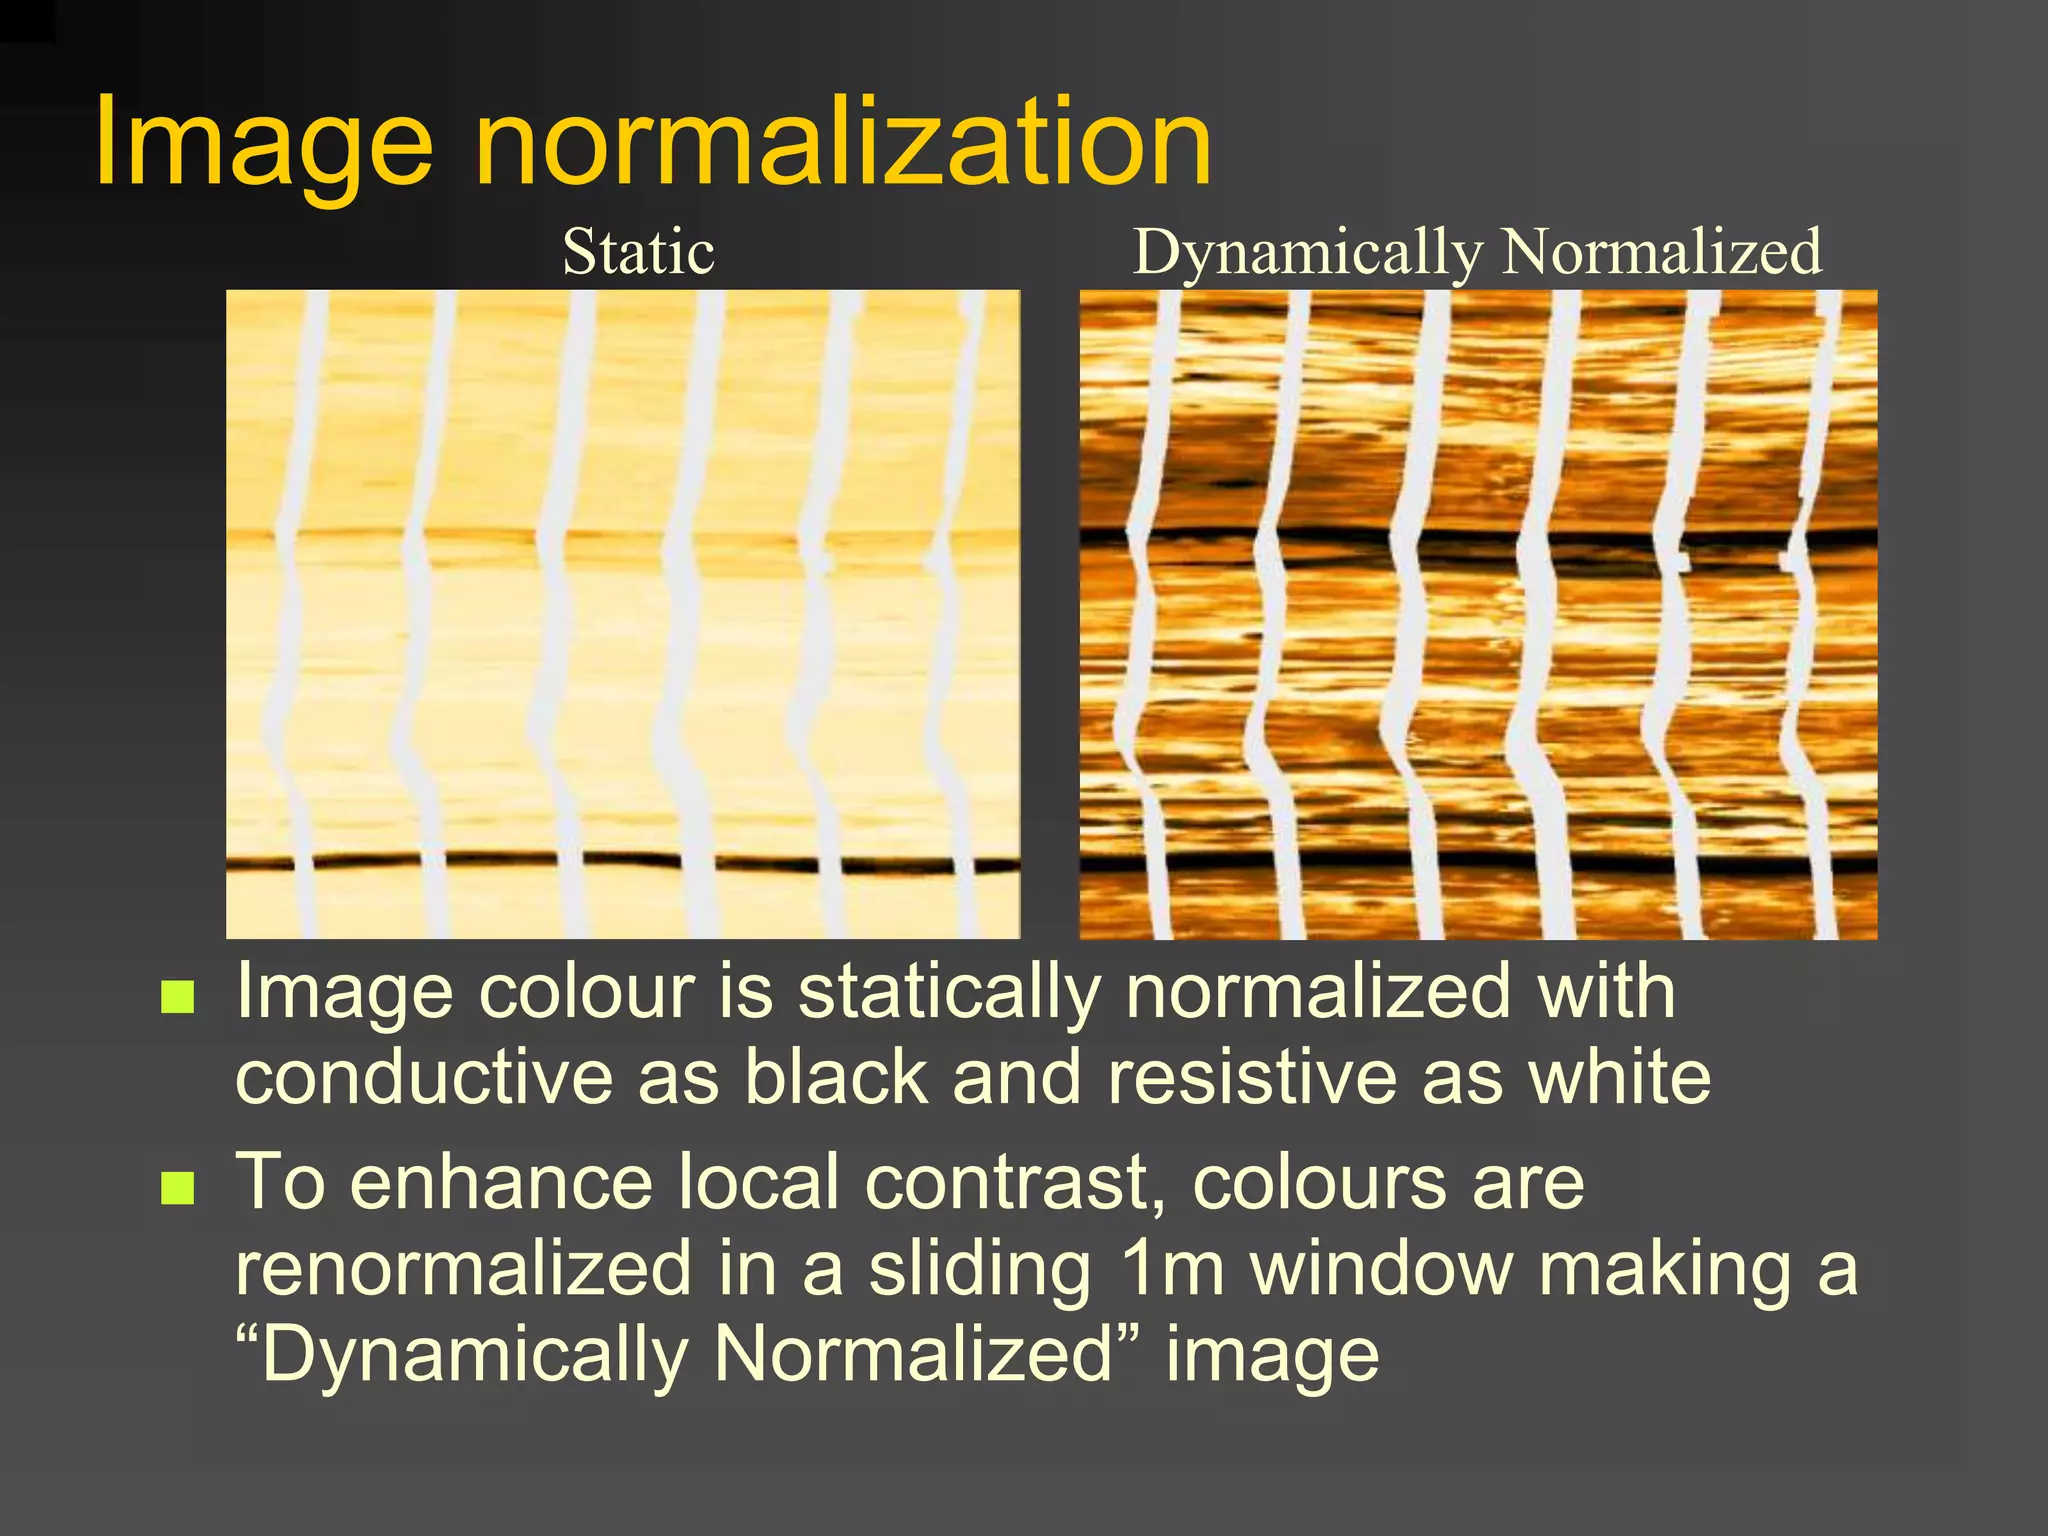
Image normalization
Imagecolour is statically normalized with
conductive as black and resistive as white
To enhance local contrast, colours are
renormalized in a sliding 1m window making a
“Dynamically Normalized” image
Dynamically NormalizedStatic
9.
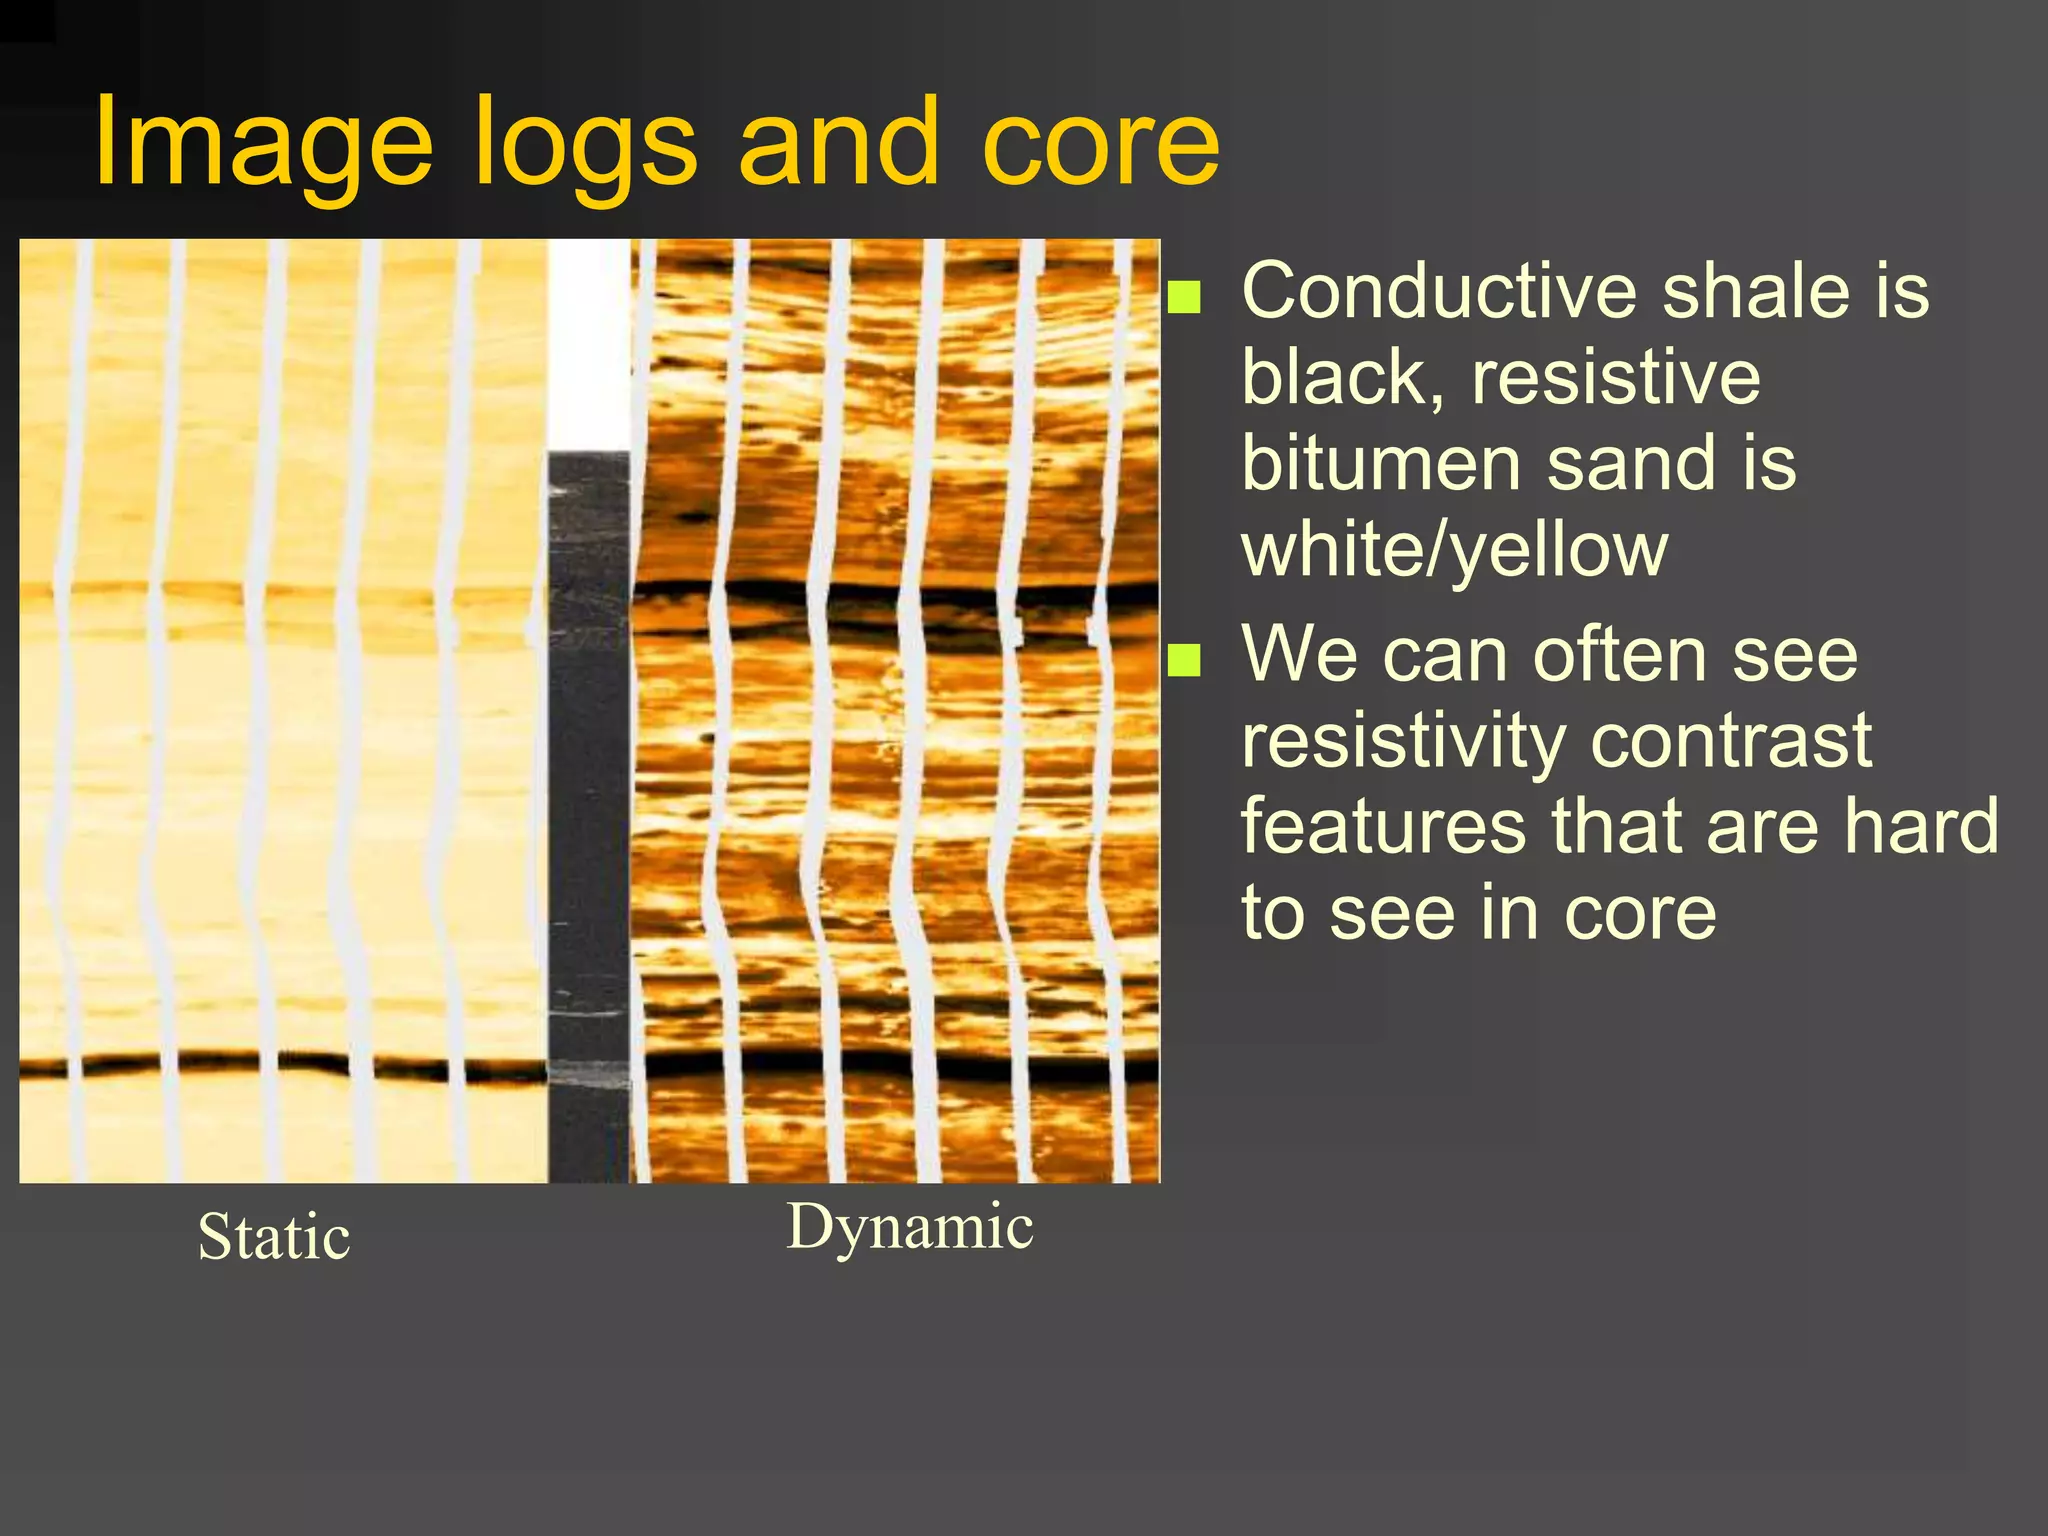
Image logs andcore
Conductive shale is
black, resistive
bitumen sand is
white/yellow
We can often see
resistivity contrast
features that are hard
to see in core
DynamicStatic
10.
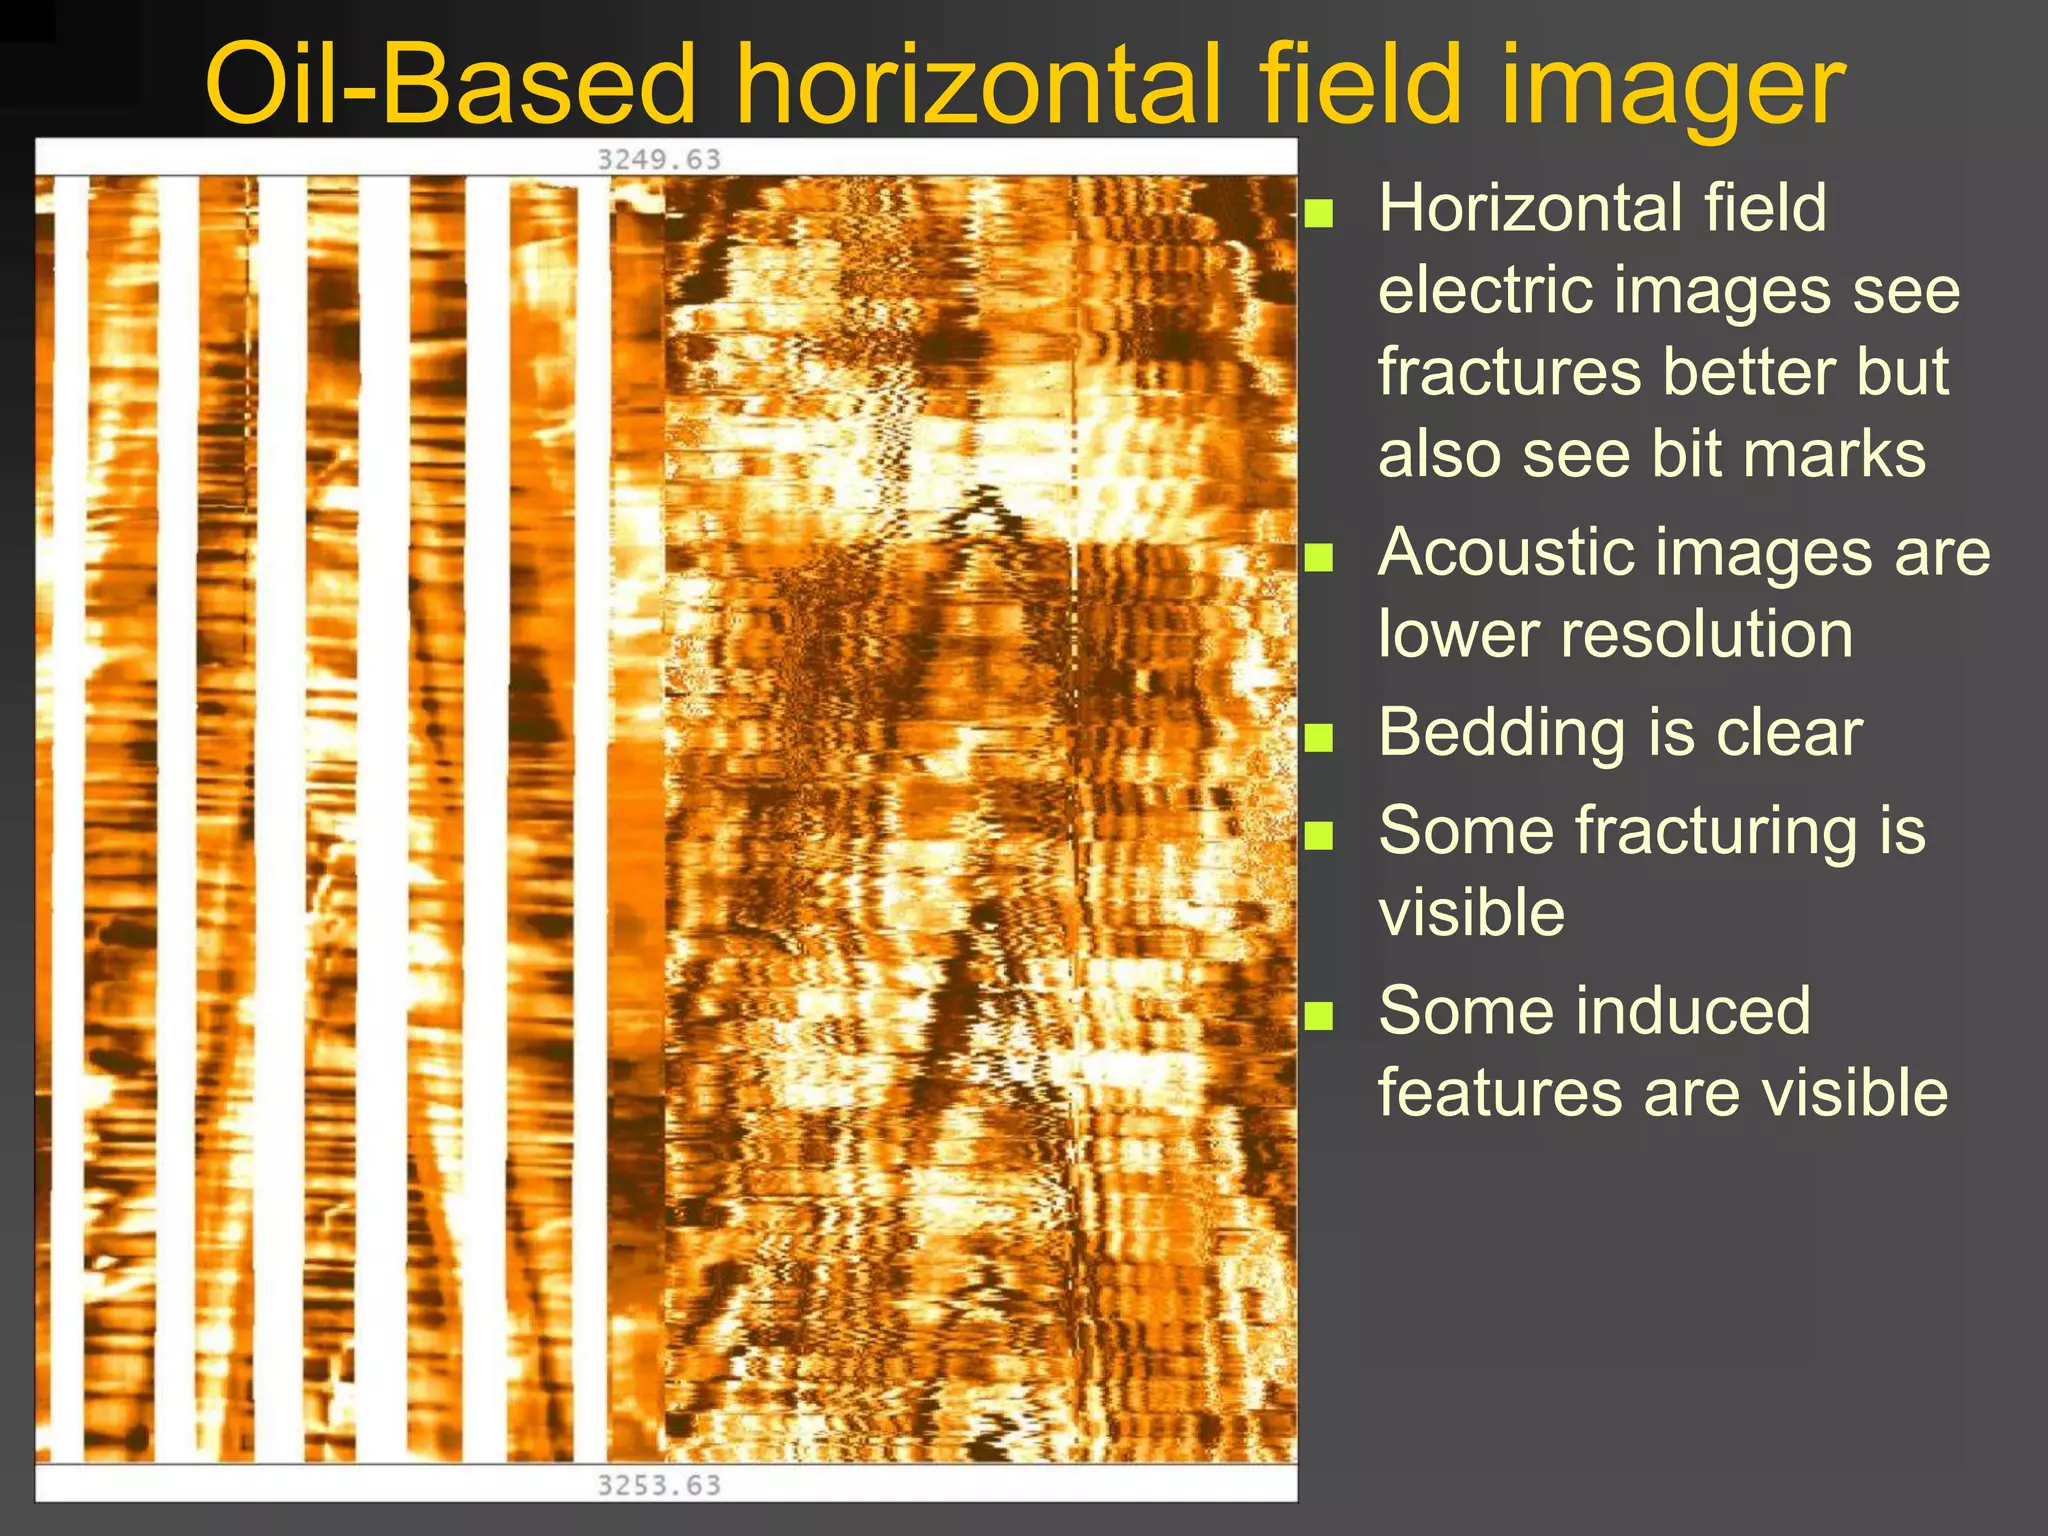
Oil-Based horizontal fieldimager
Horizontal field
electric images see
fractures better but
also see bit marks
Acoustic images are
lower resolution
Bedding is clear
Some fracturing is
visible
Some induced
features are visible
“Basics” products
Plotof the interpreted image at various scales
(Paper / PDF / TIFF)
Output of the interpreted image in DLIS
Output/backup of the interpreted image in DB
format like Recall or Geoframe, etc.
Output of the interpreted features (Beds,
fractures, etc.) in LAS
17.
Outline
Basics ofborehole image interpretation
Bedding and structural dip analysis
Natural fractures
Stress features
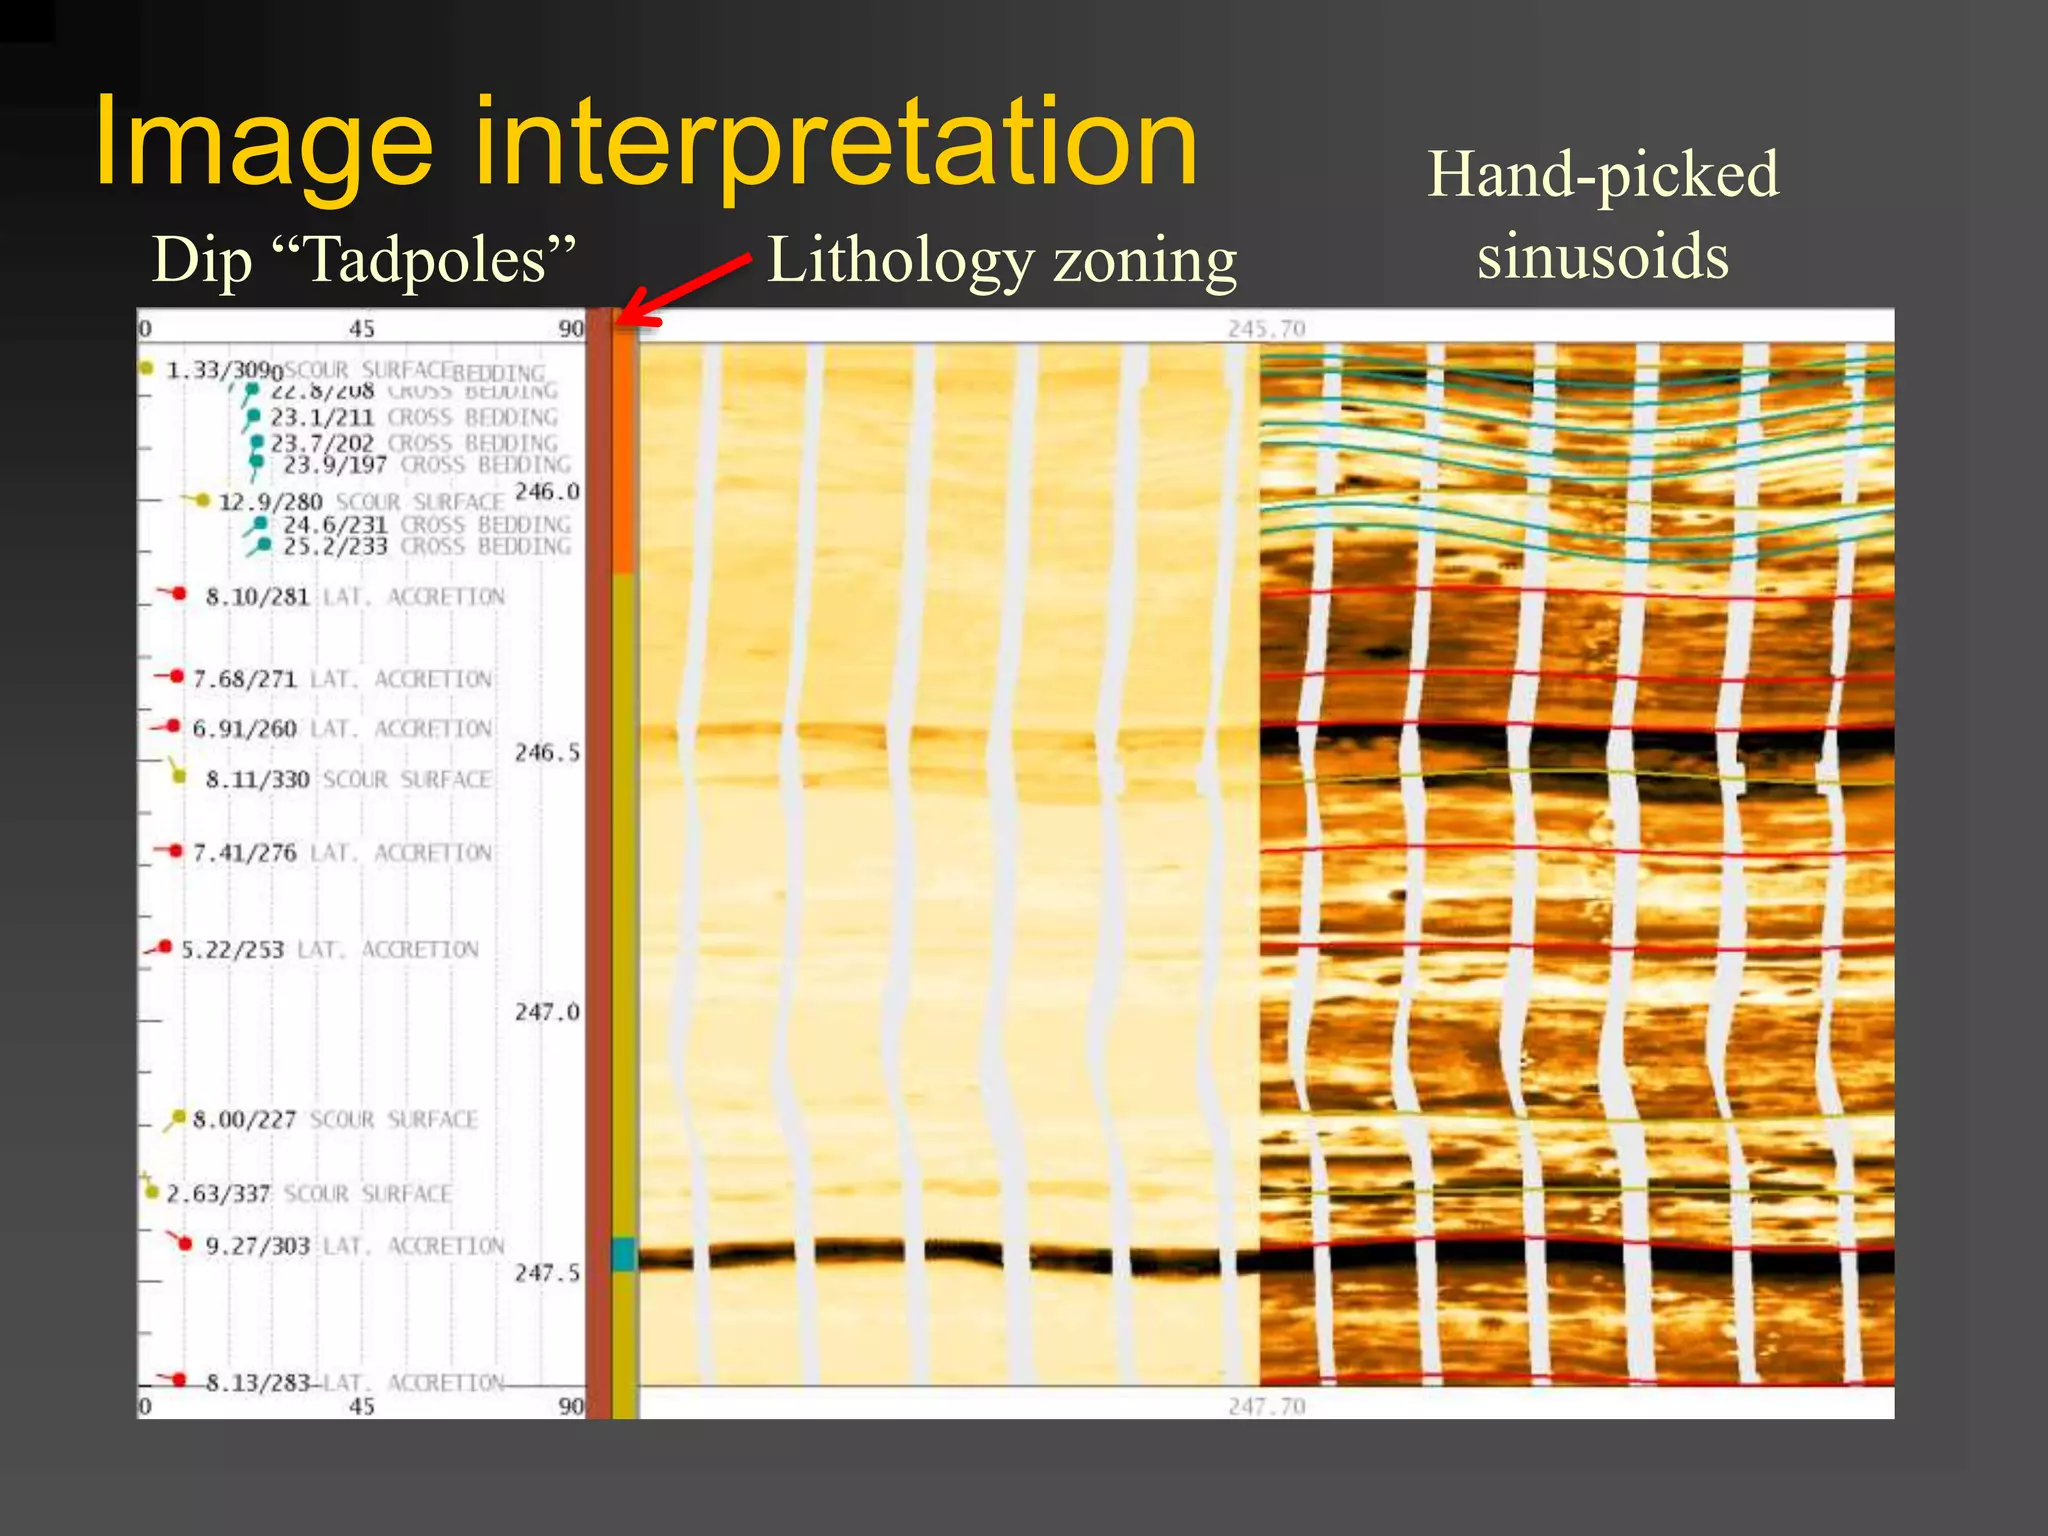
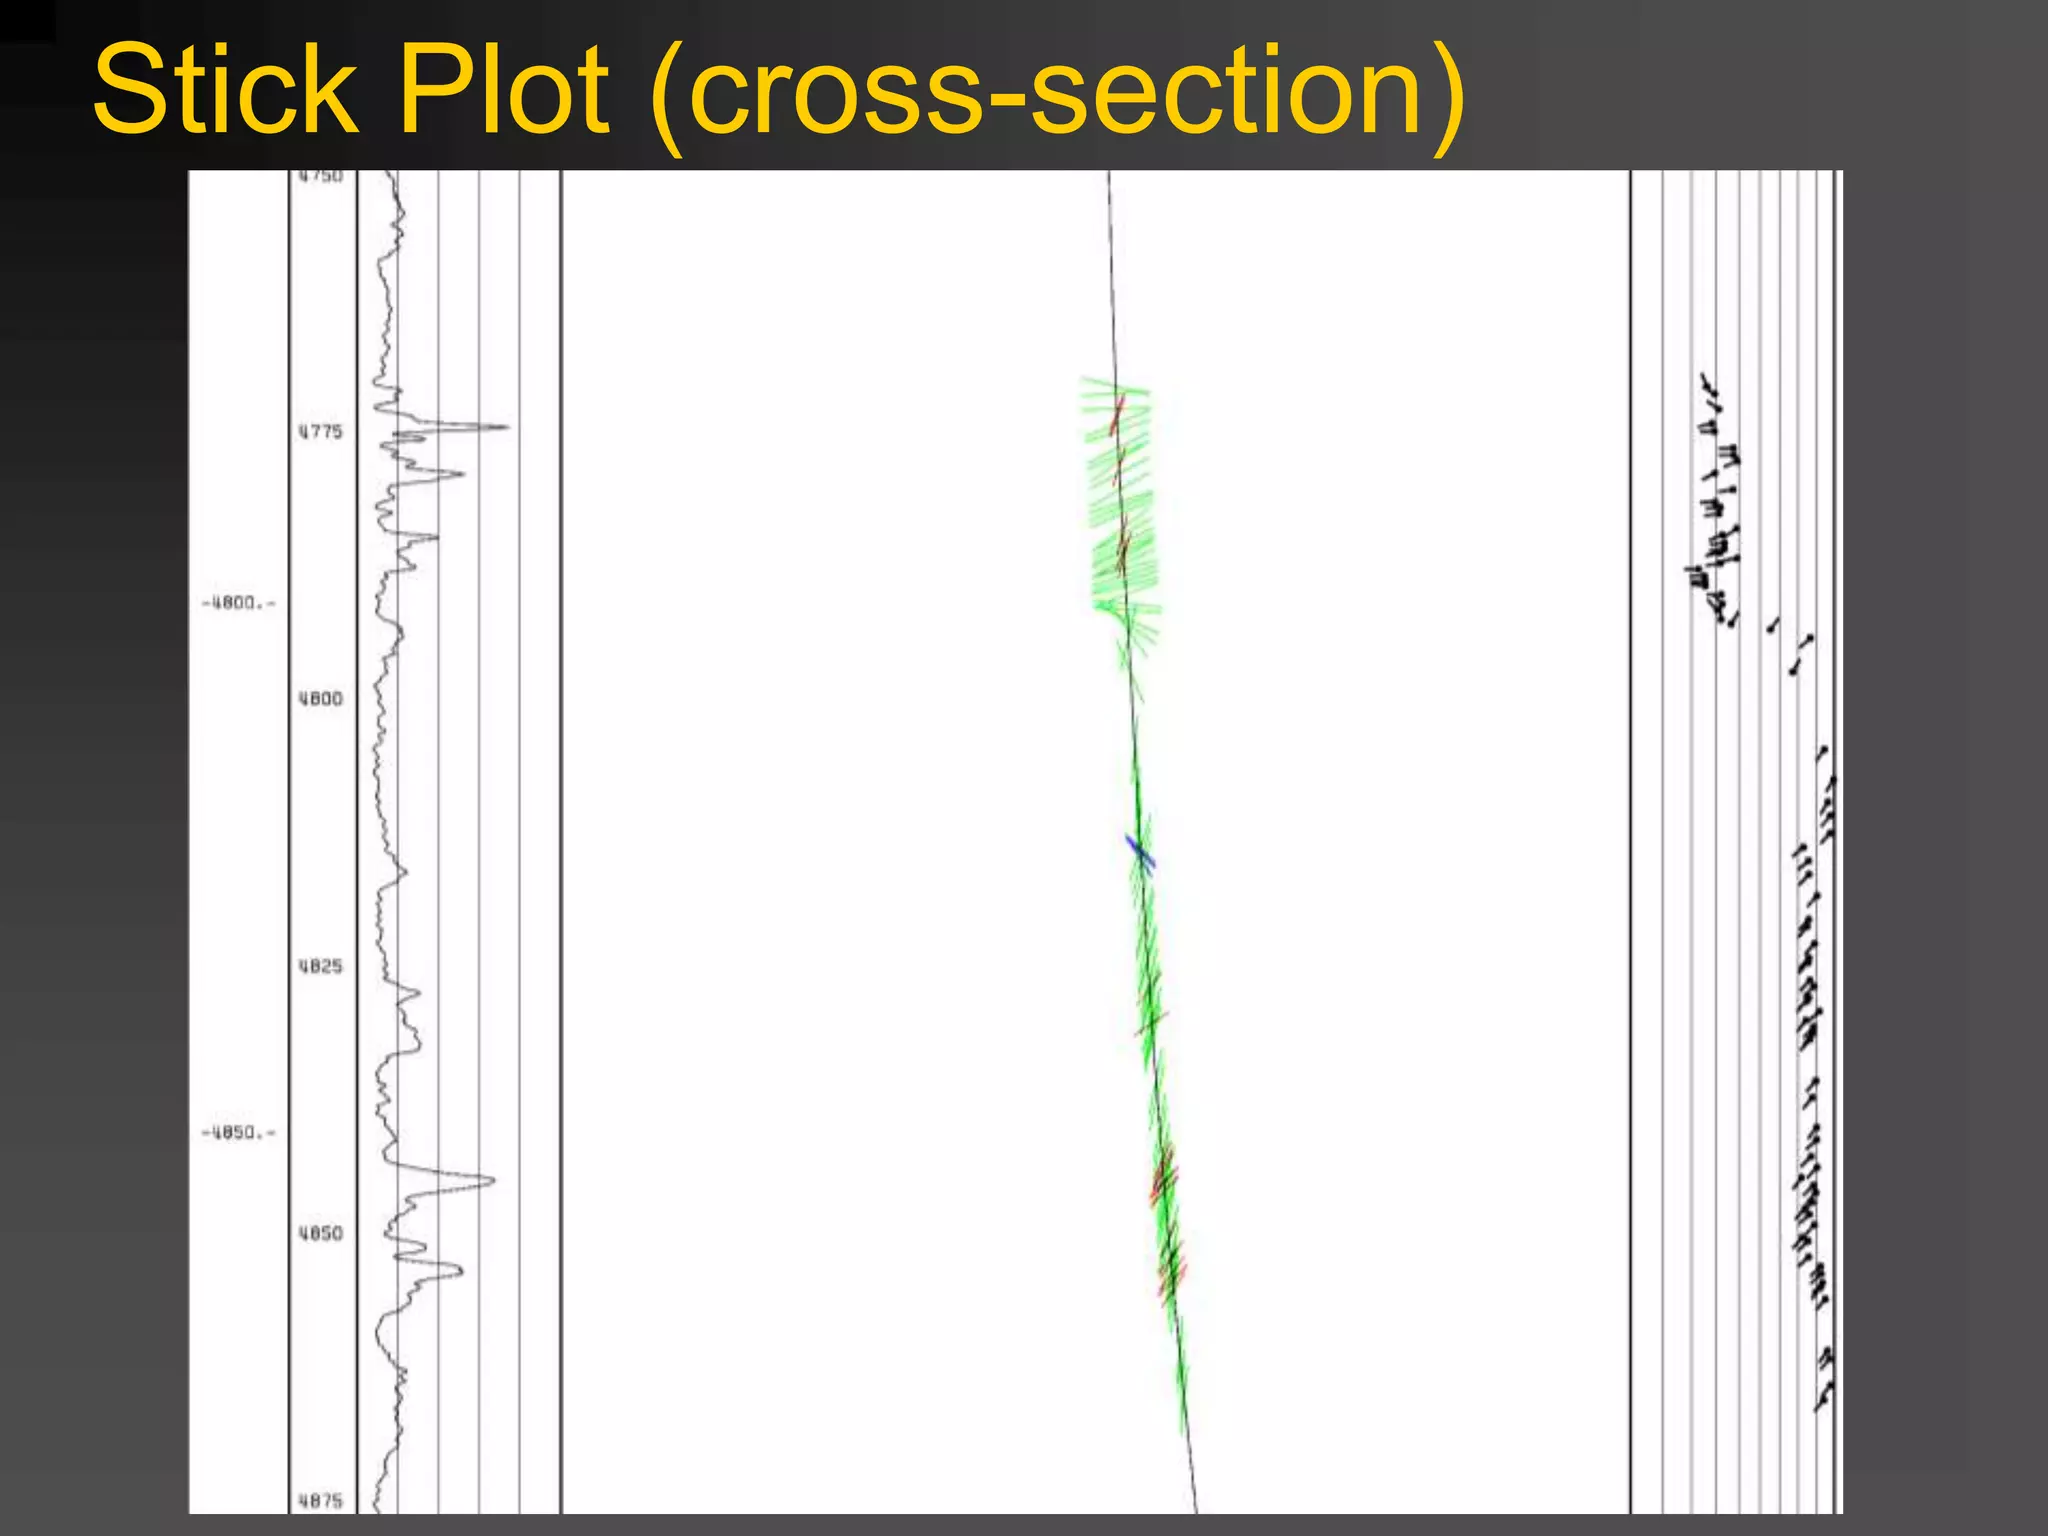
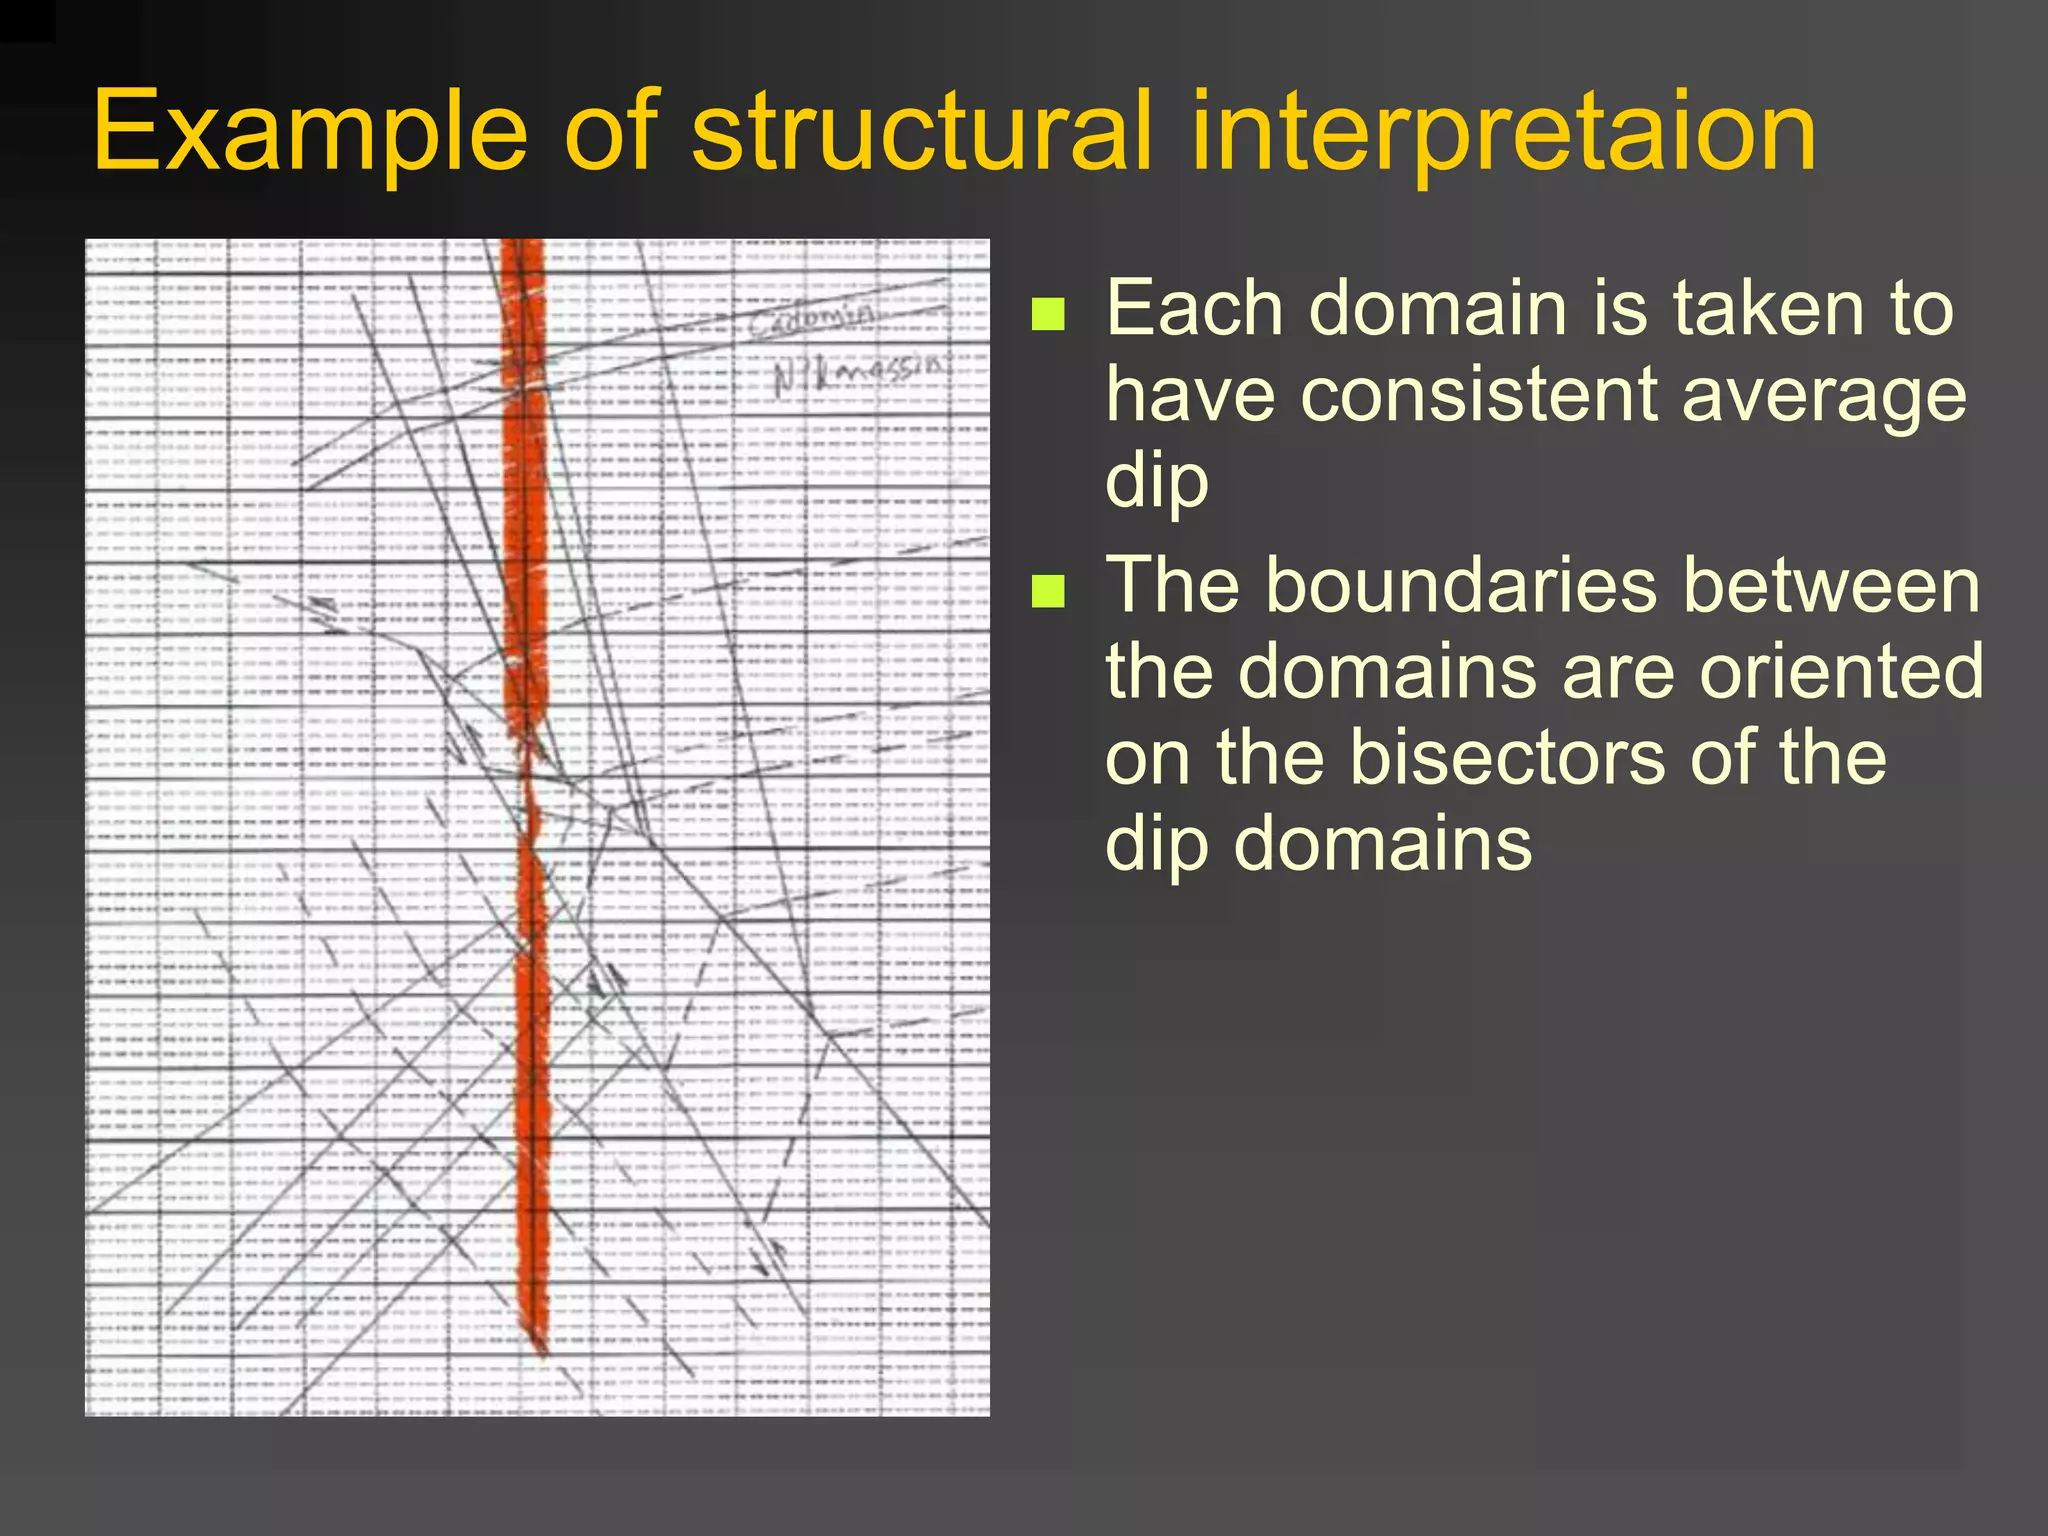
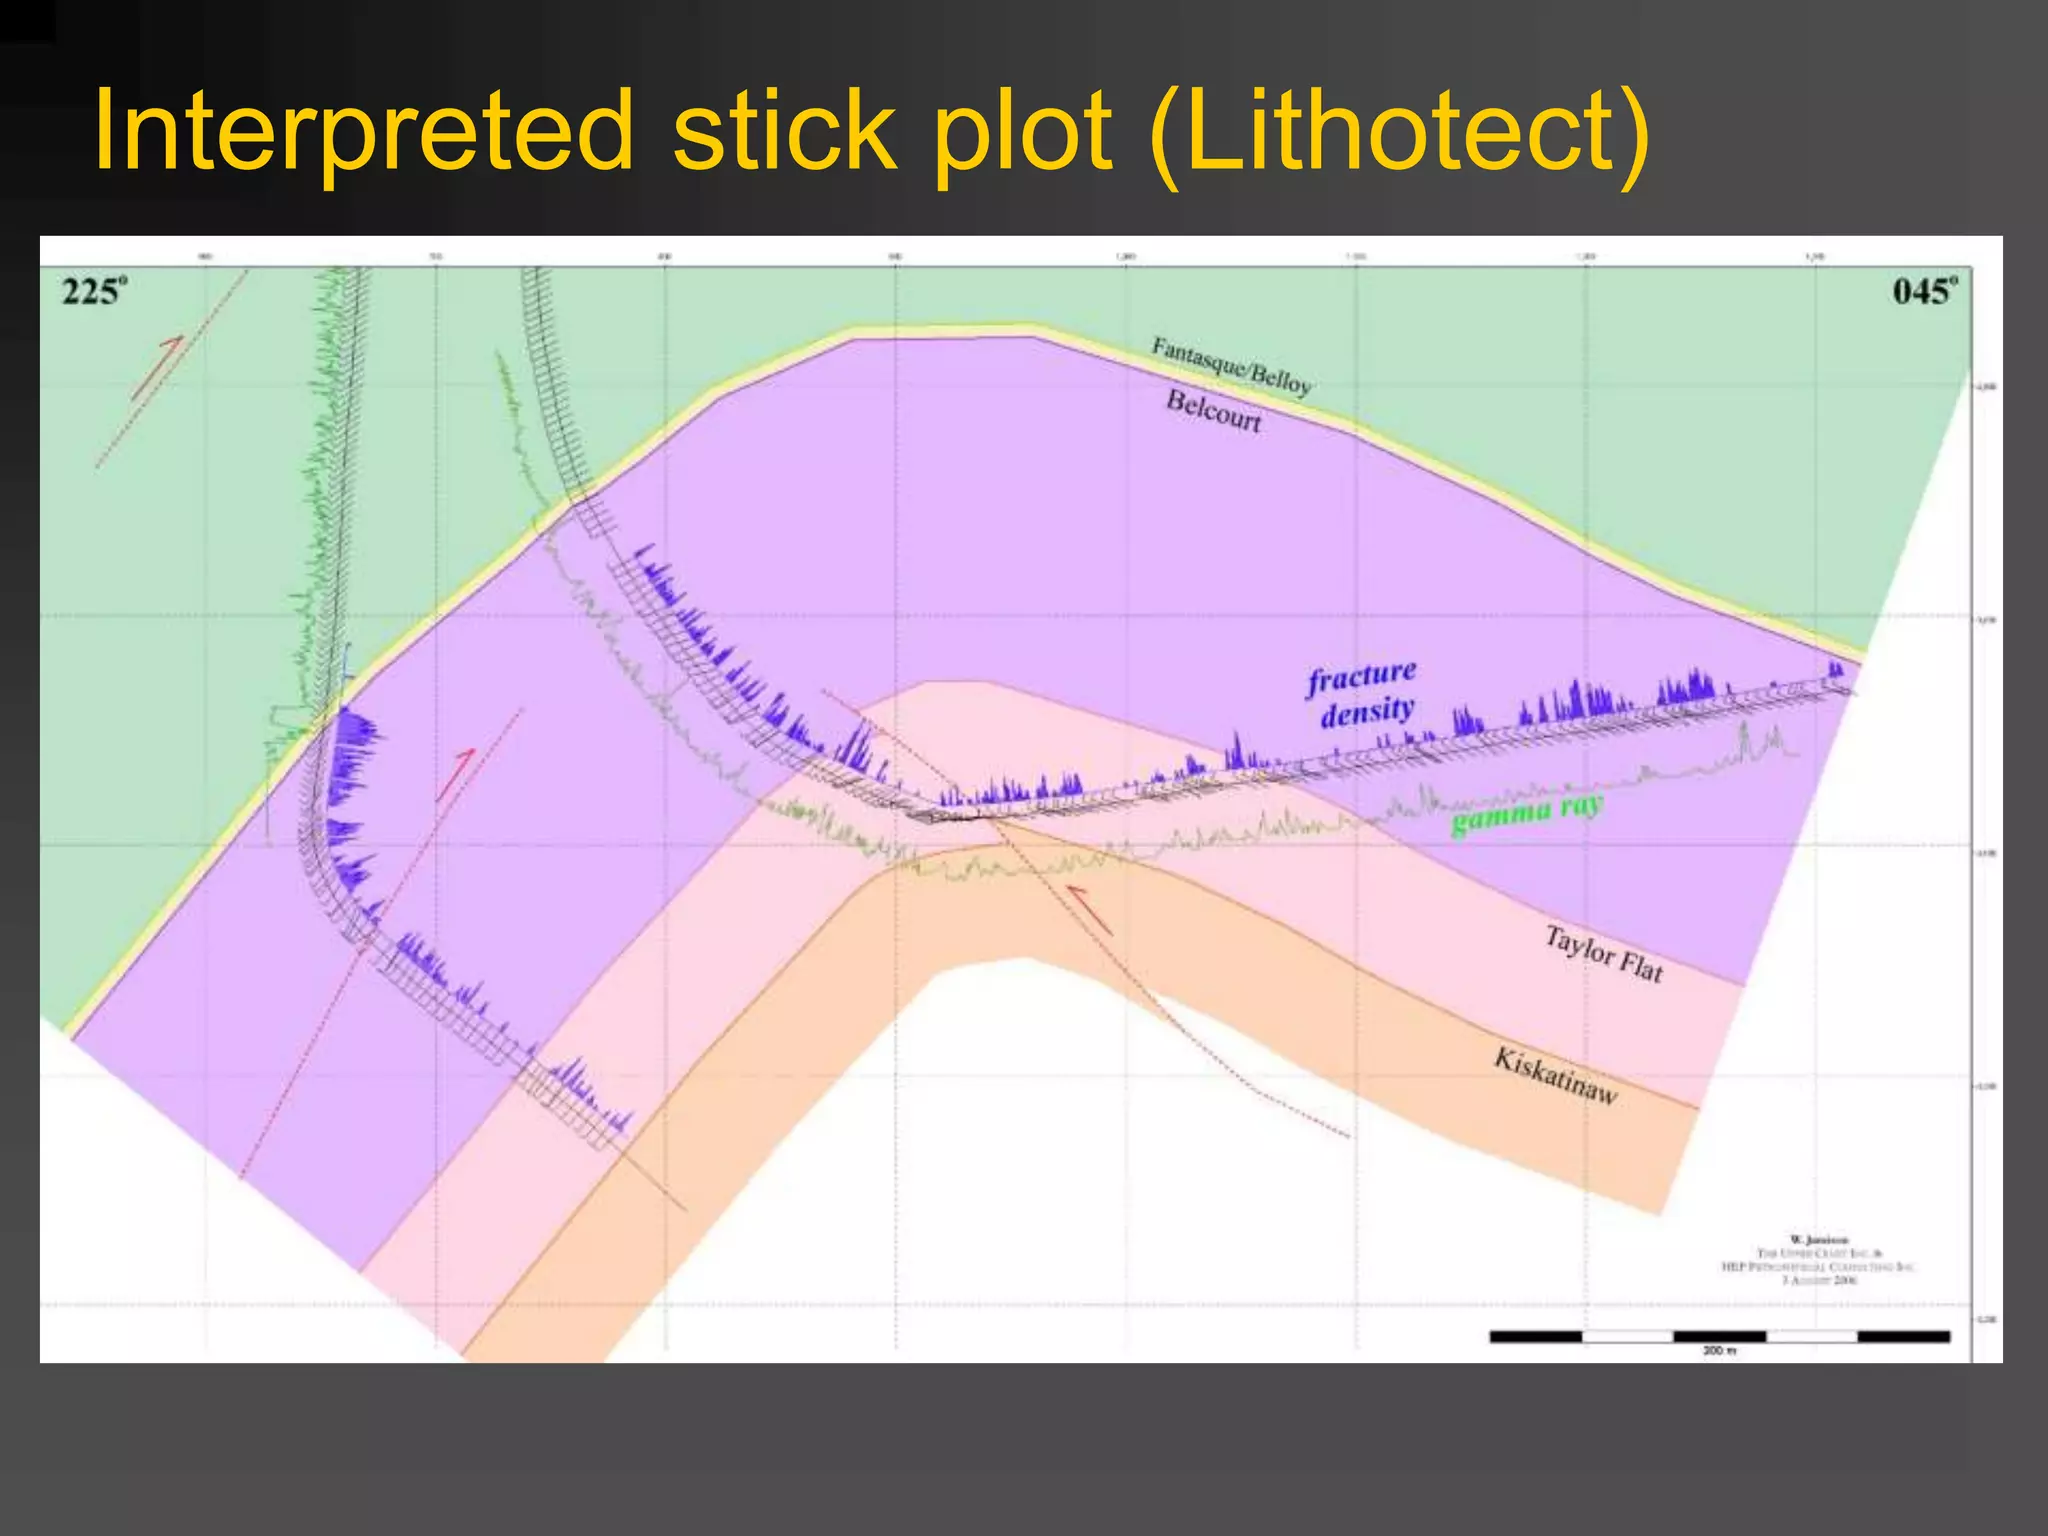
Example of structuralinterpretaion
Each domain is taken to
have consistent average
dip
The boundaries between
the domains are oriented
on the bisectors of the
dip domains
27.
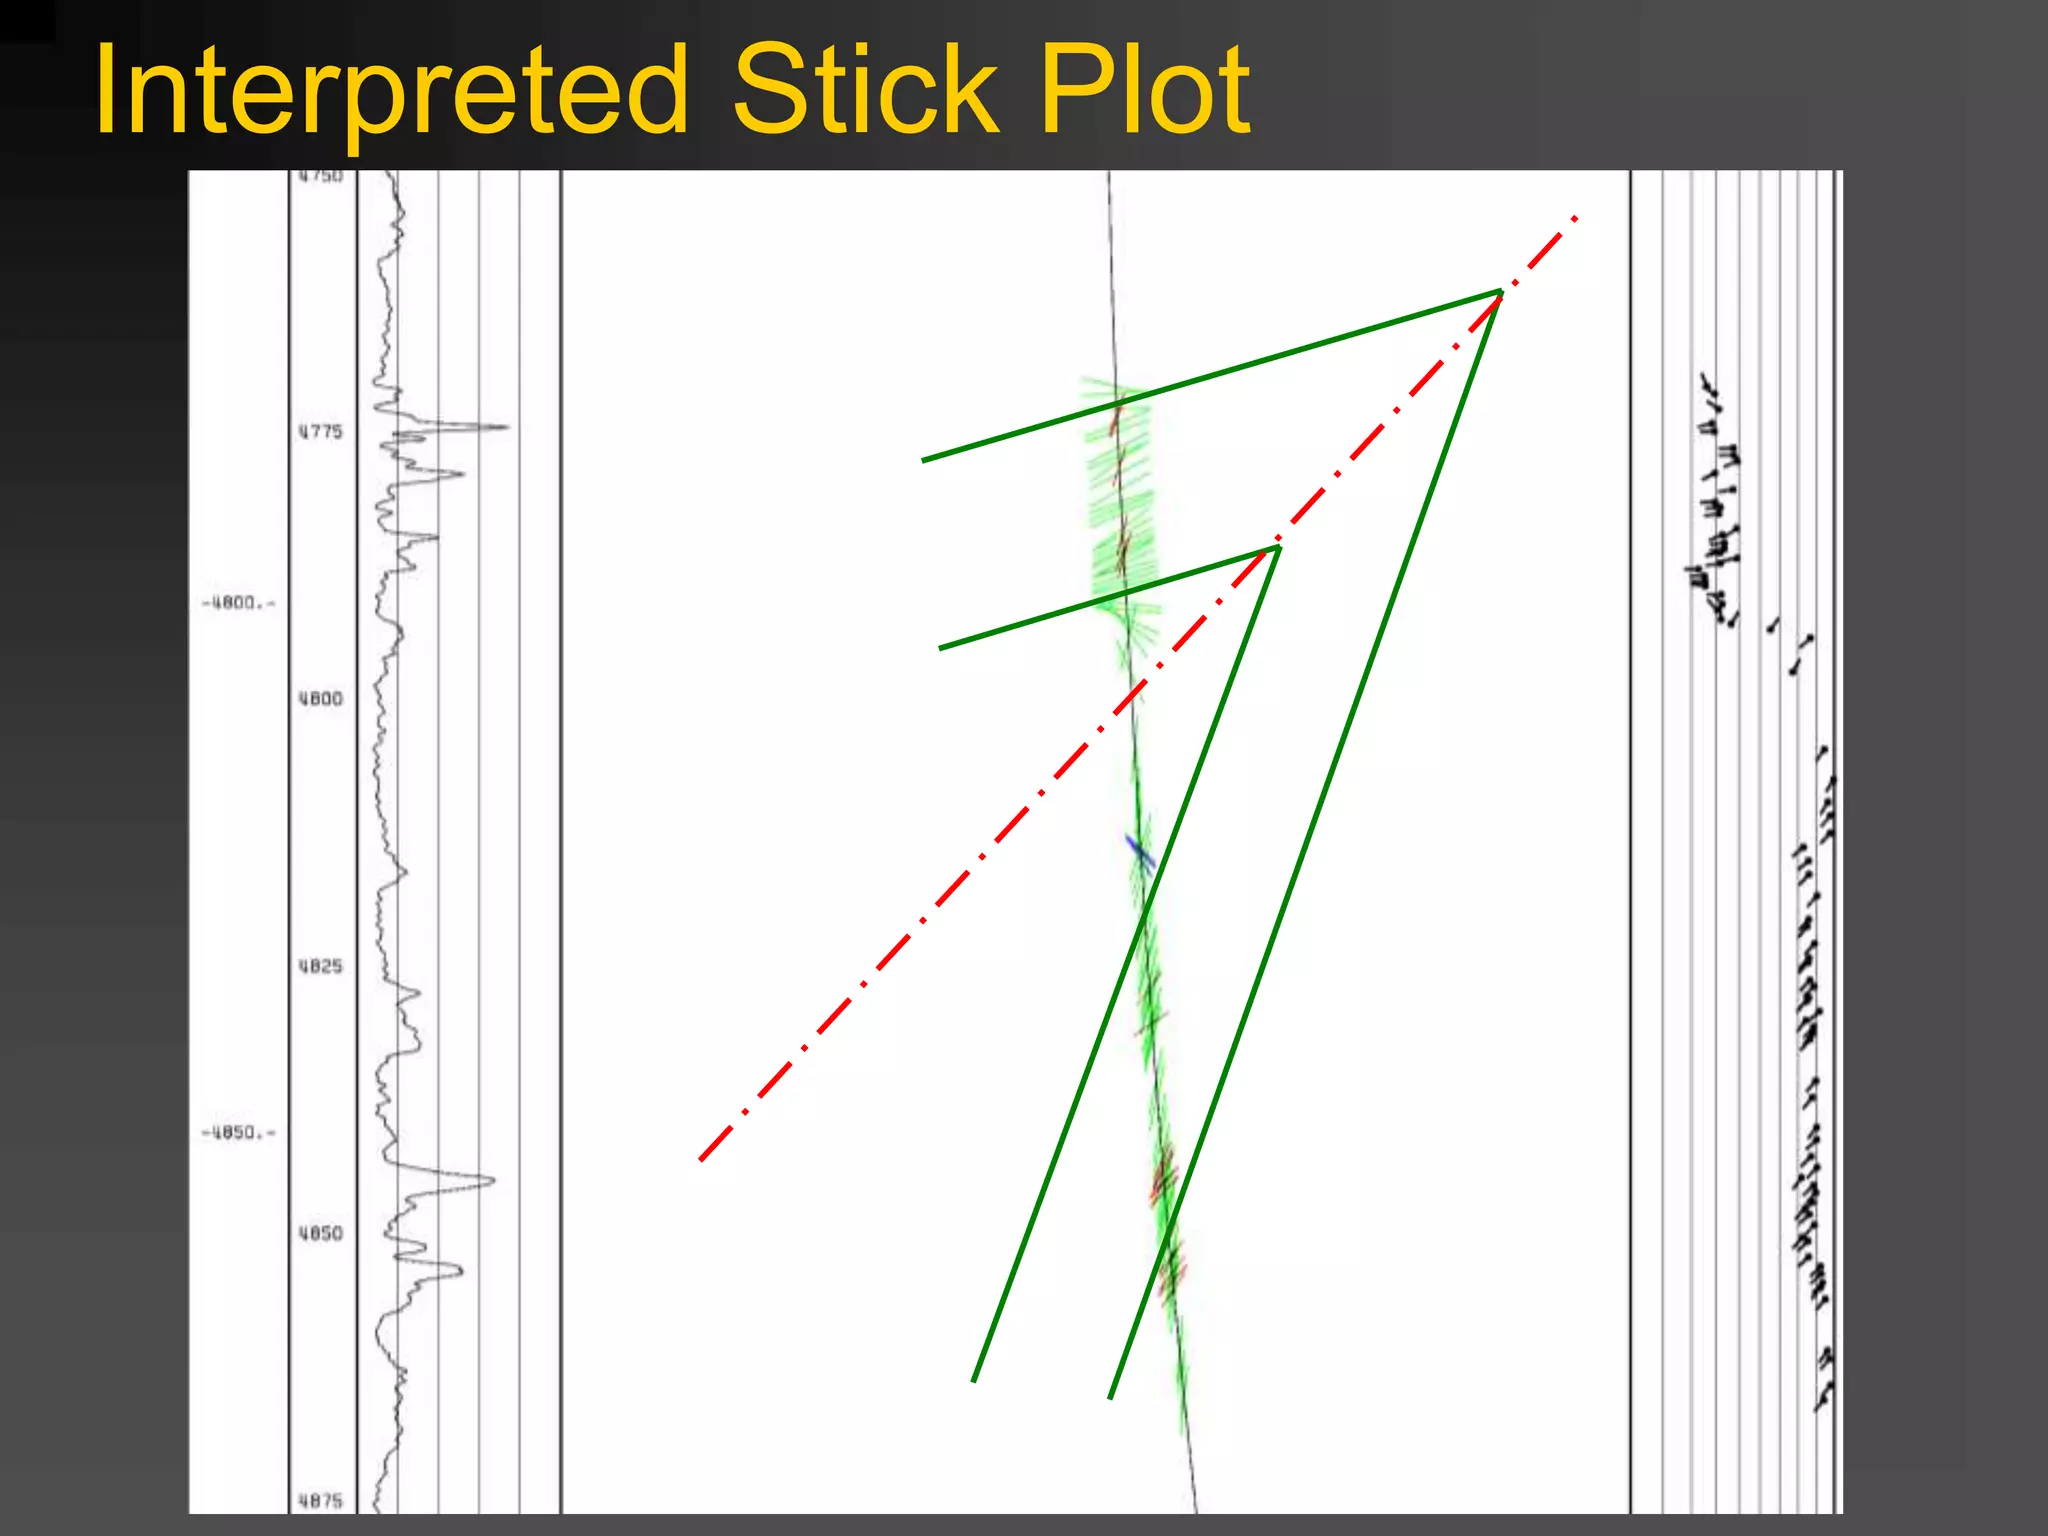
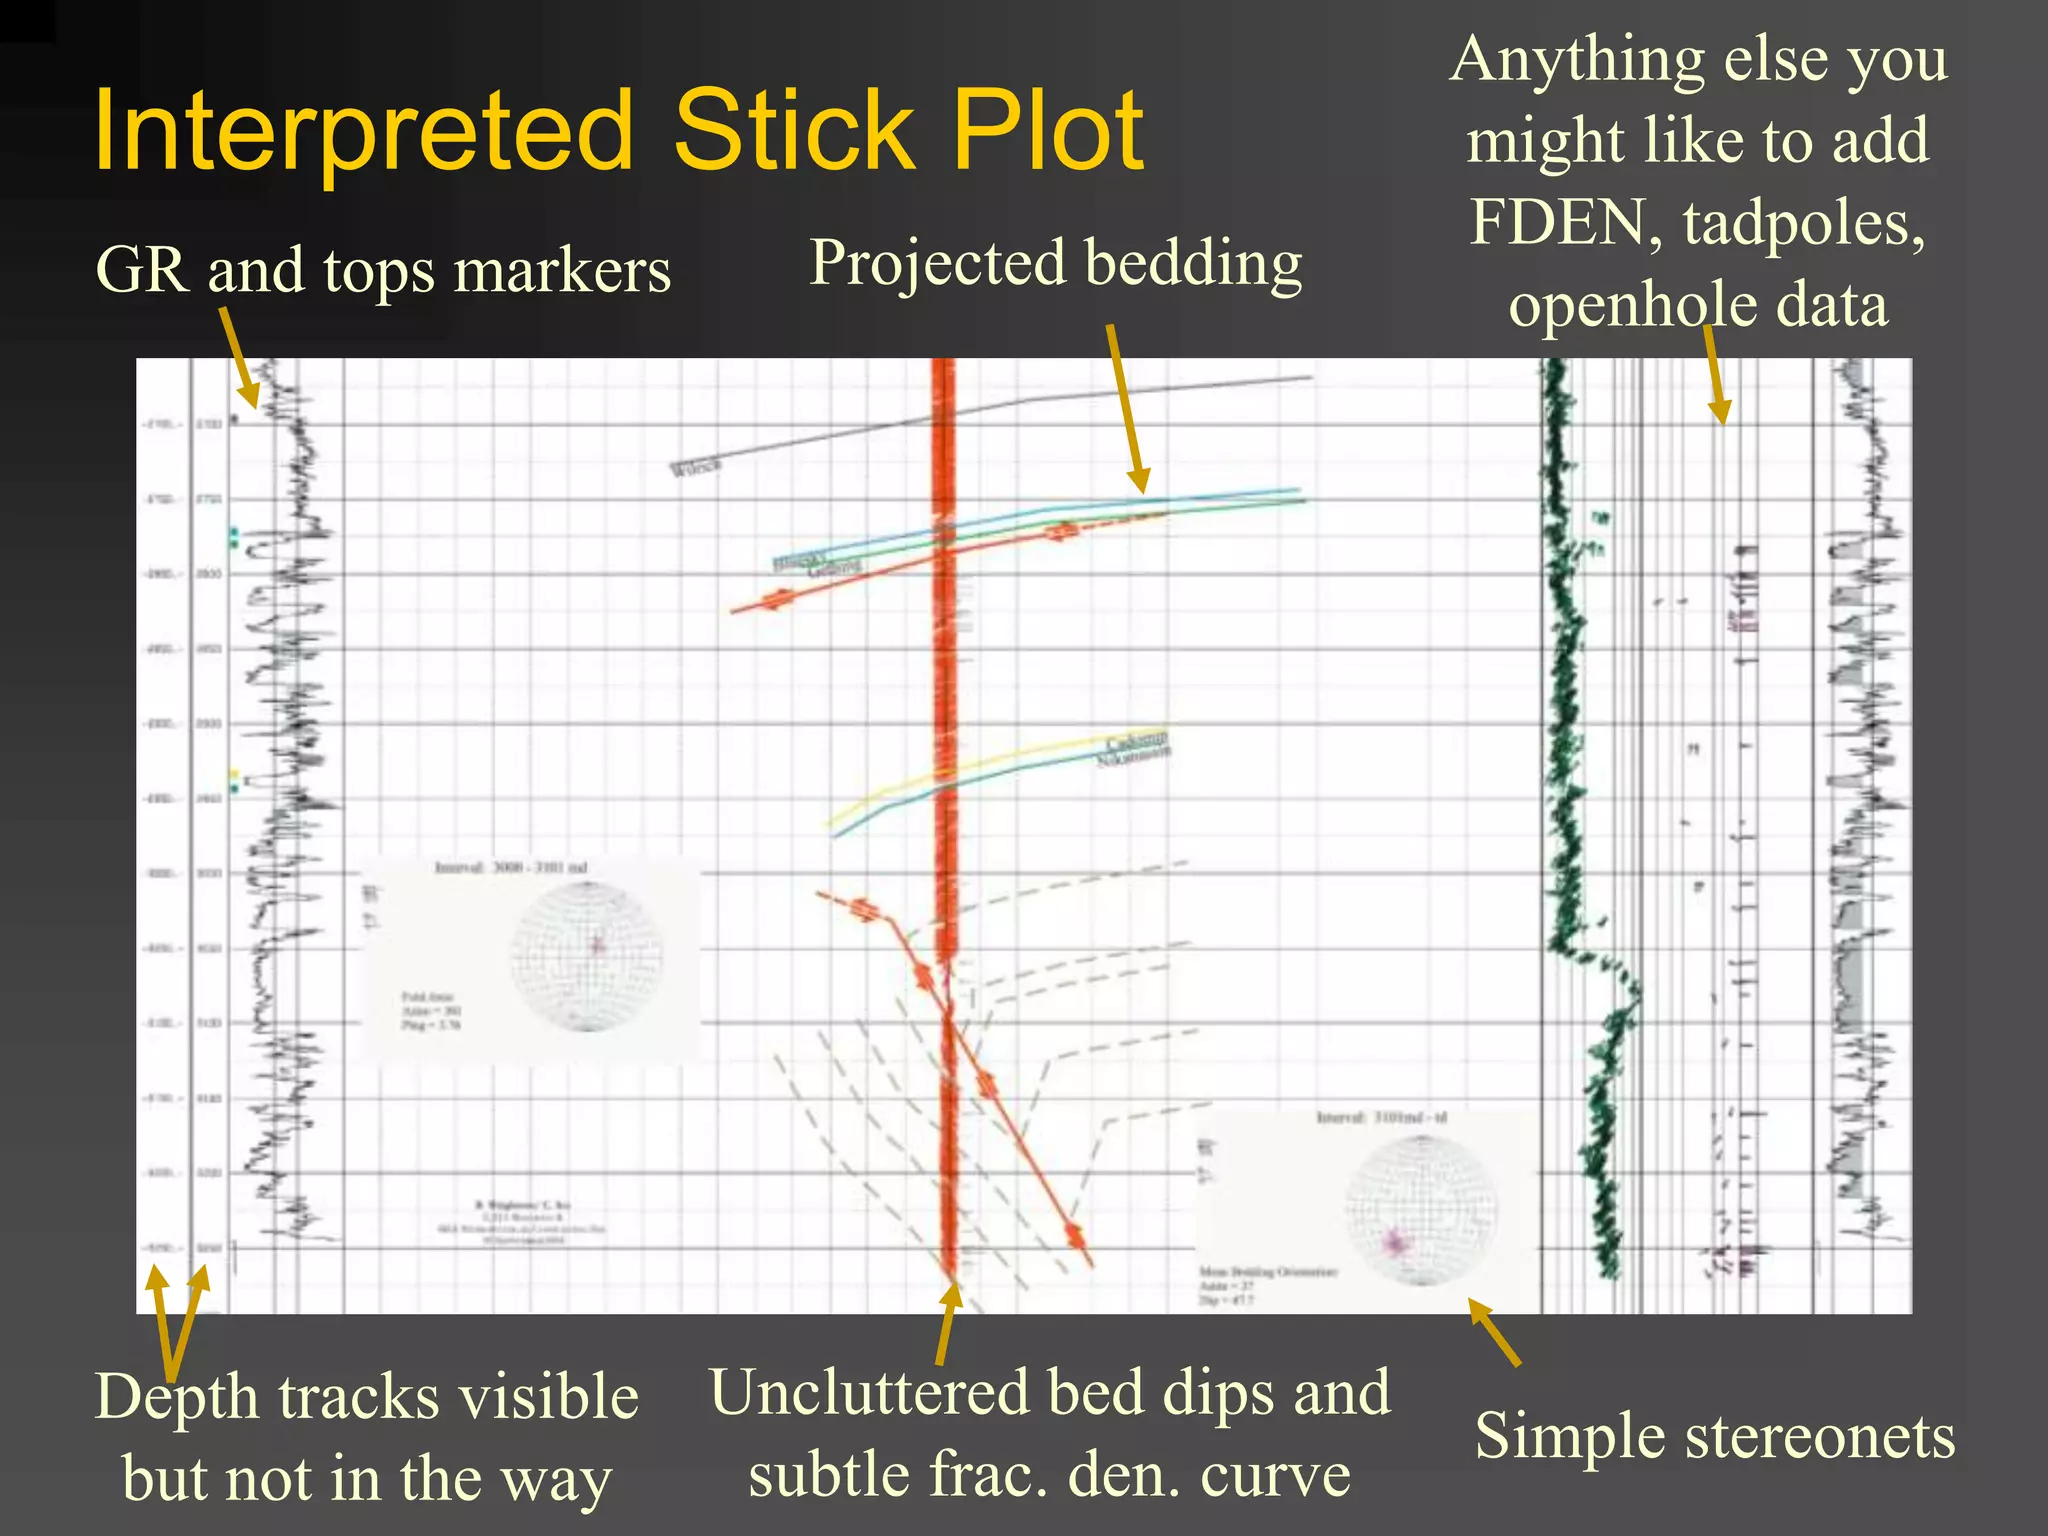
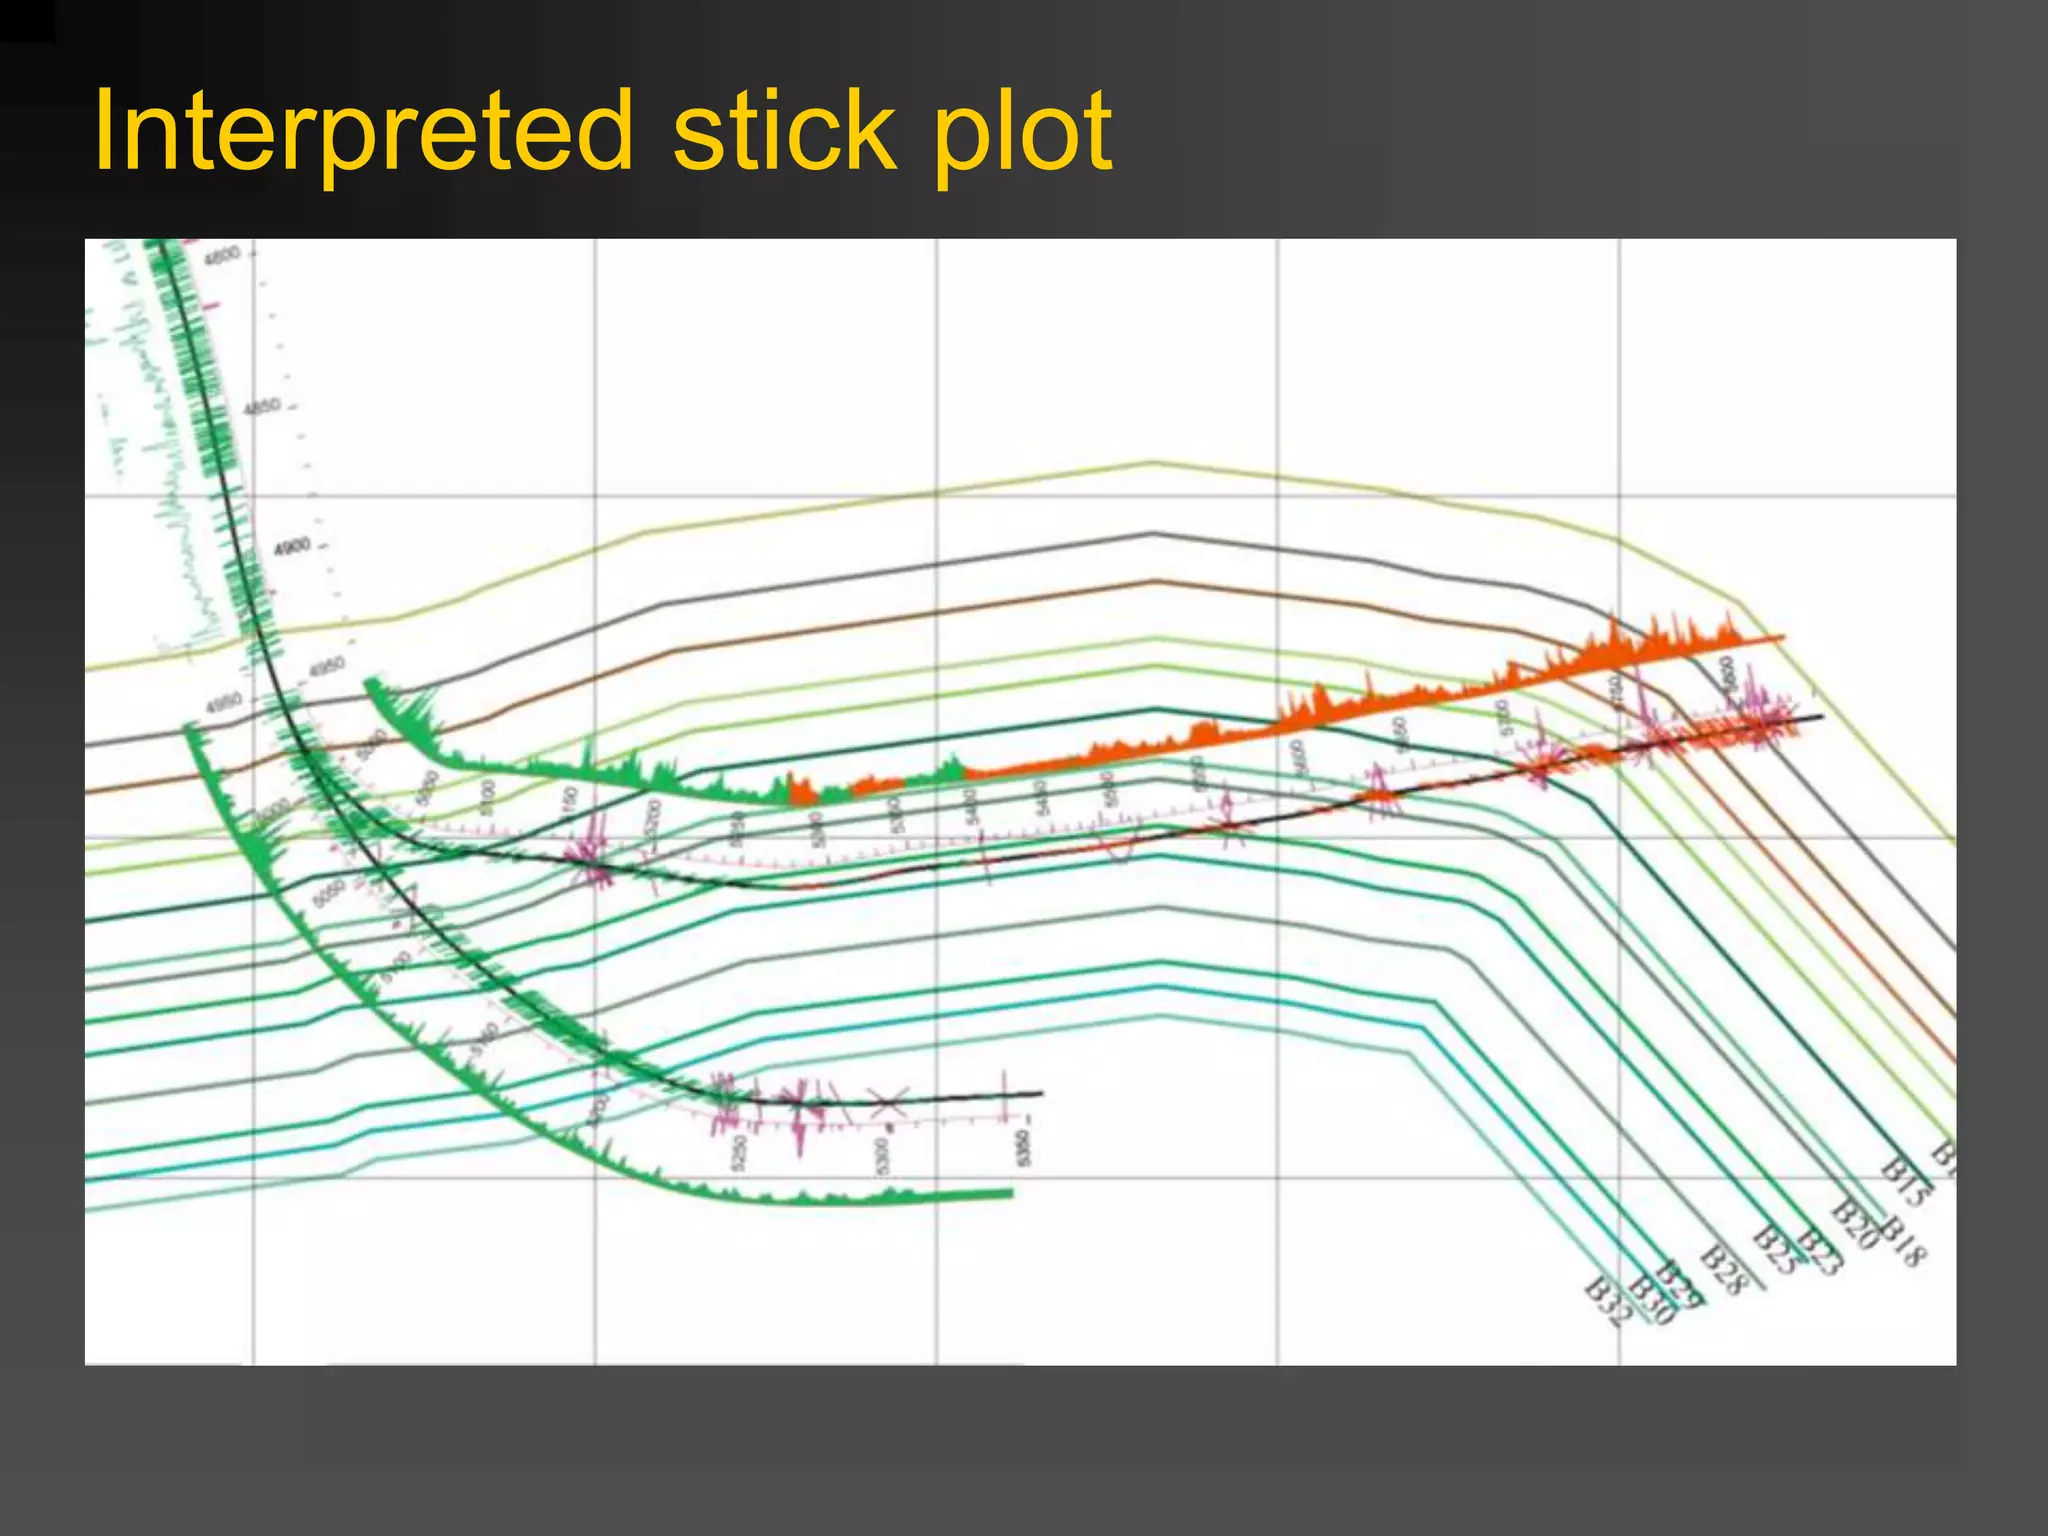
Interpreted Stick Plot
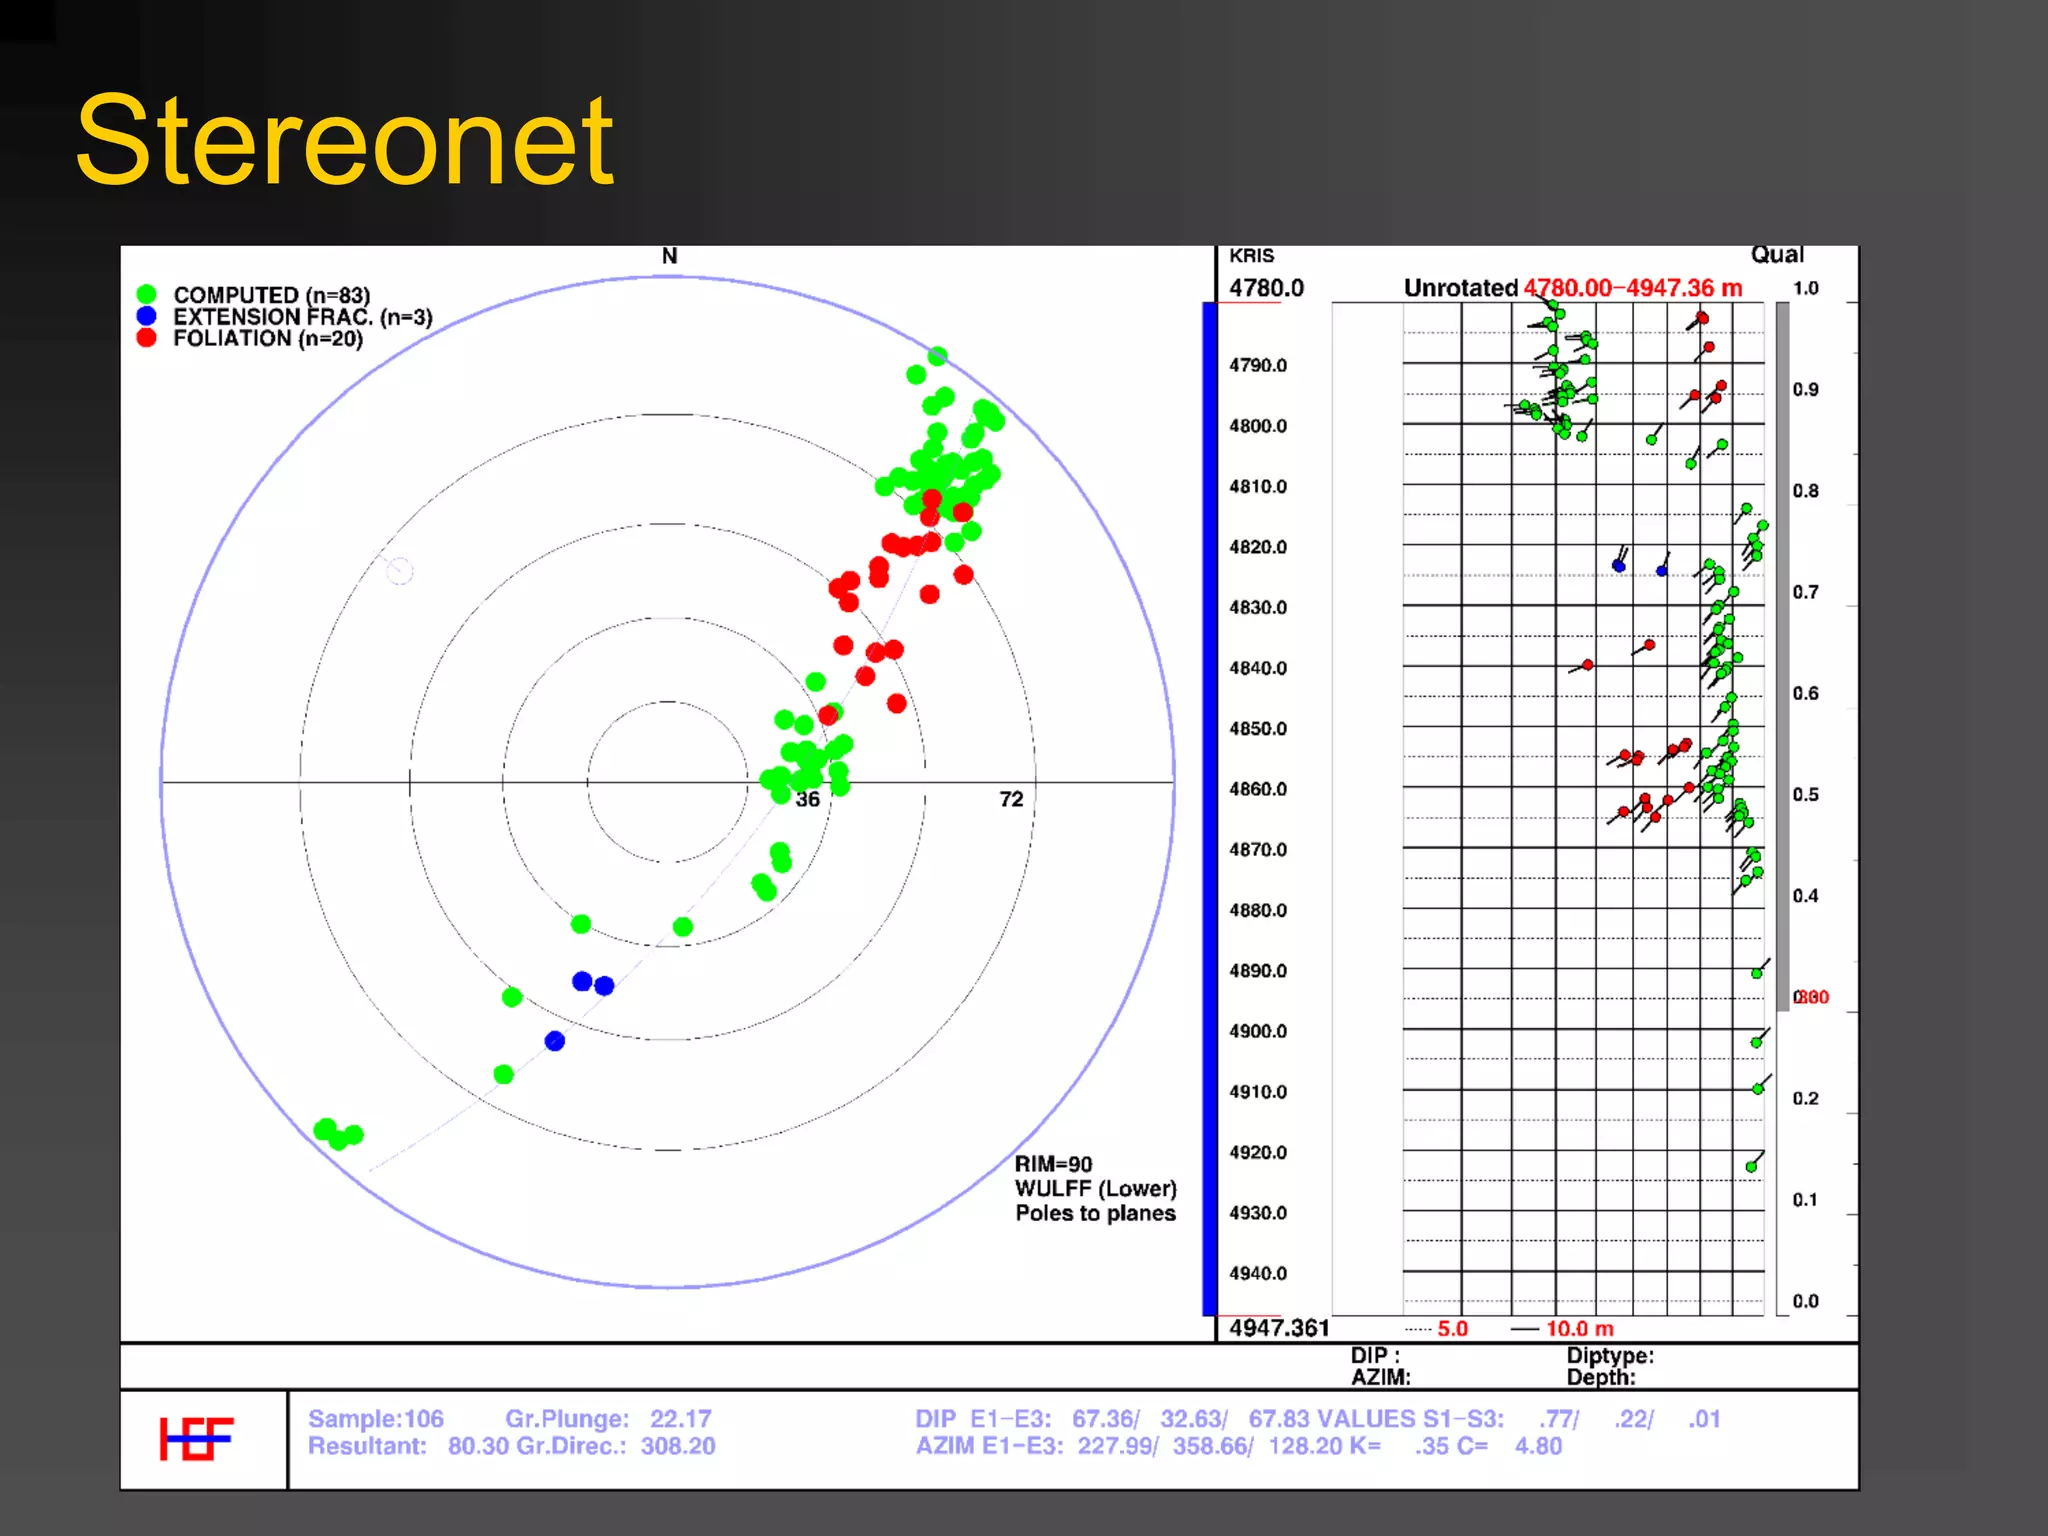
Simplestereonets
Uncluttered bed dips and
subtle frac. den. curve
GR and tops markers
Depth tracks visible
but not in the way
Projected bedding
Anything else you
might like to add
FDEN, tadpoles,
openhole data
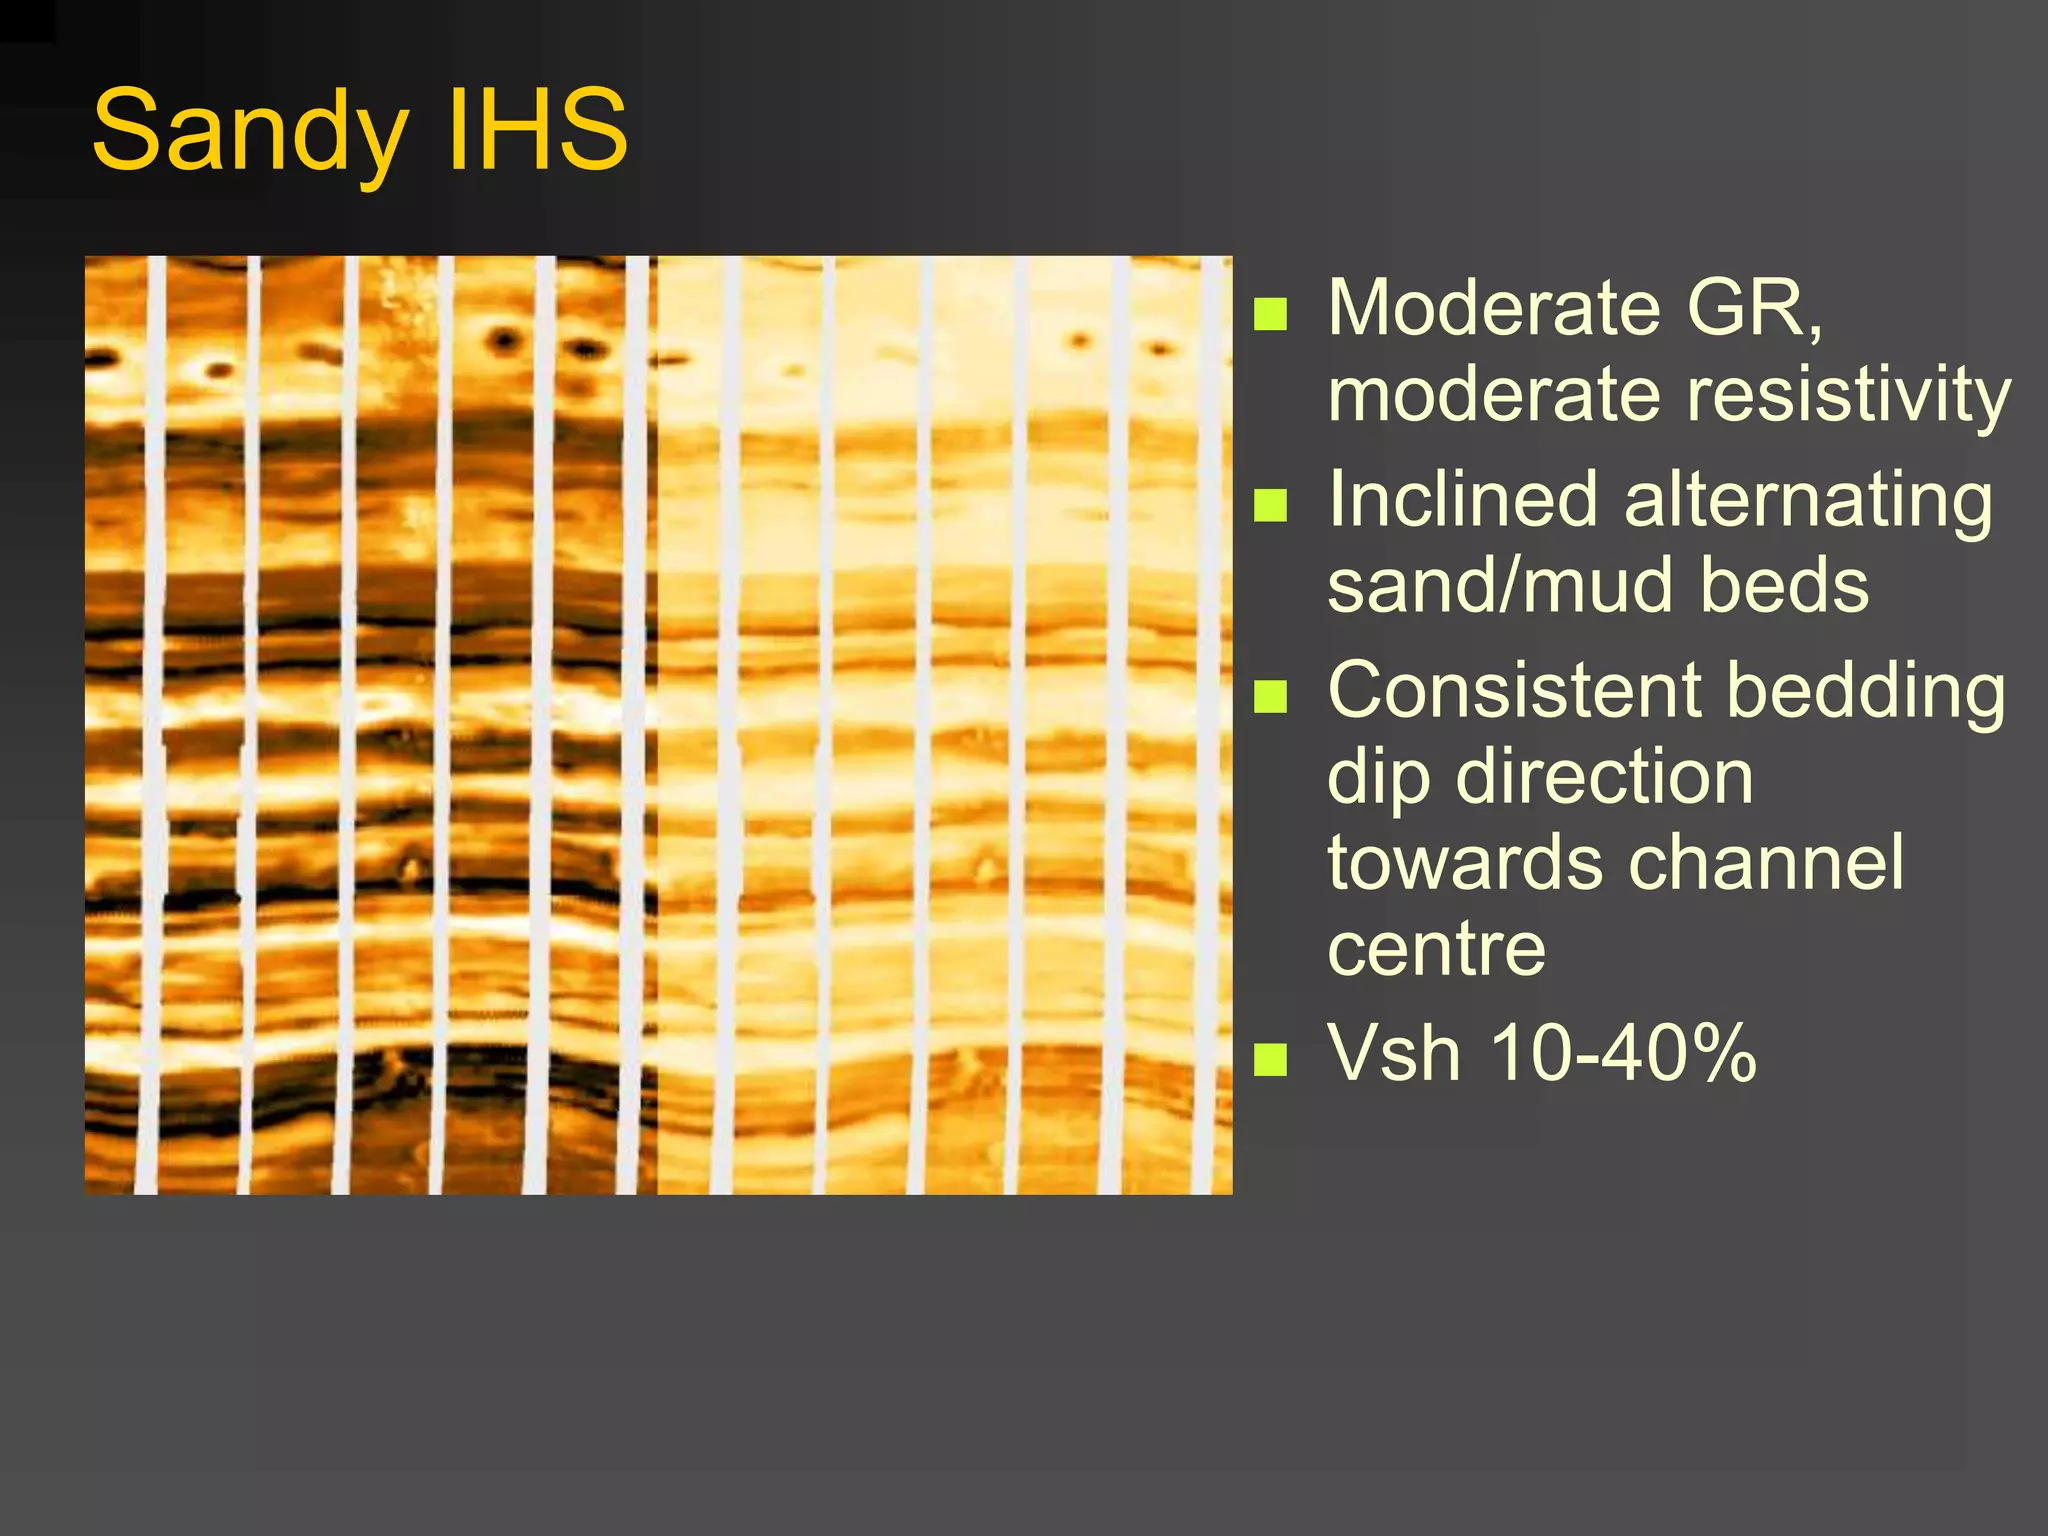
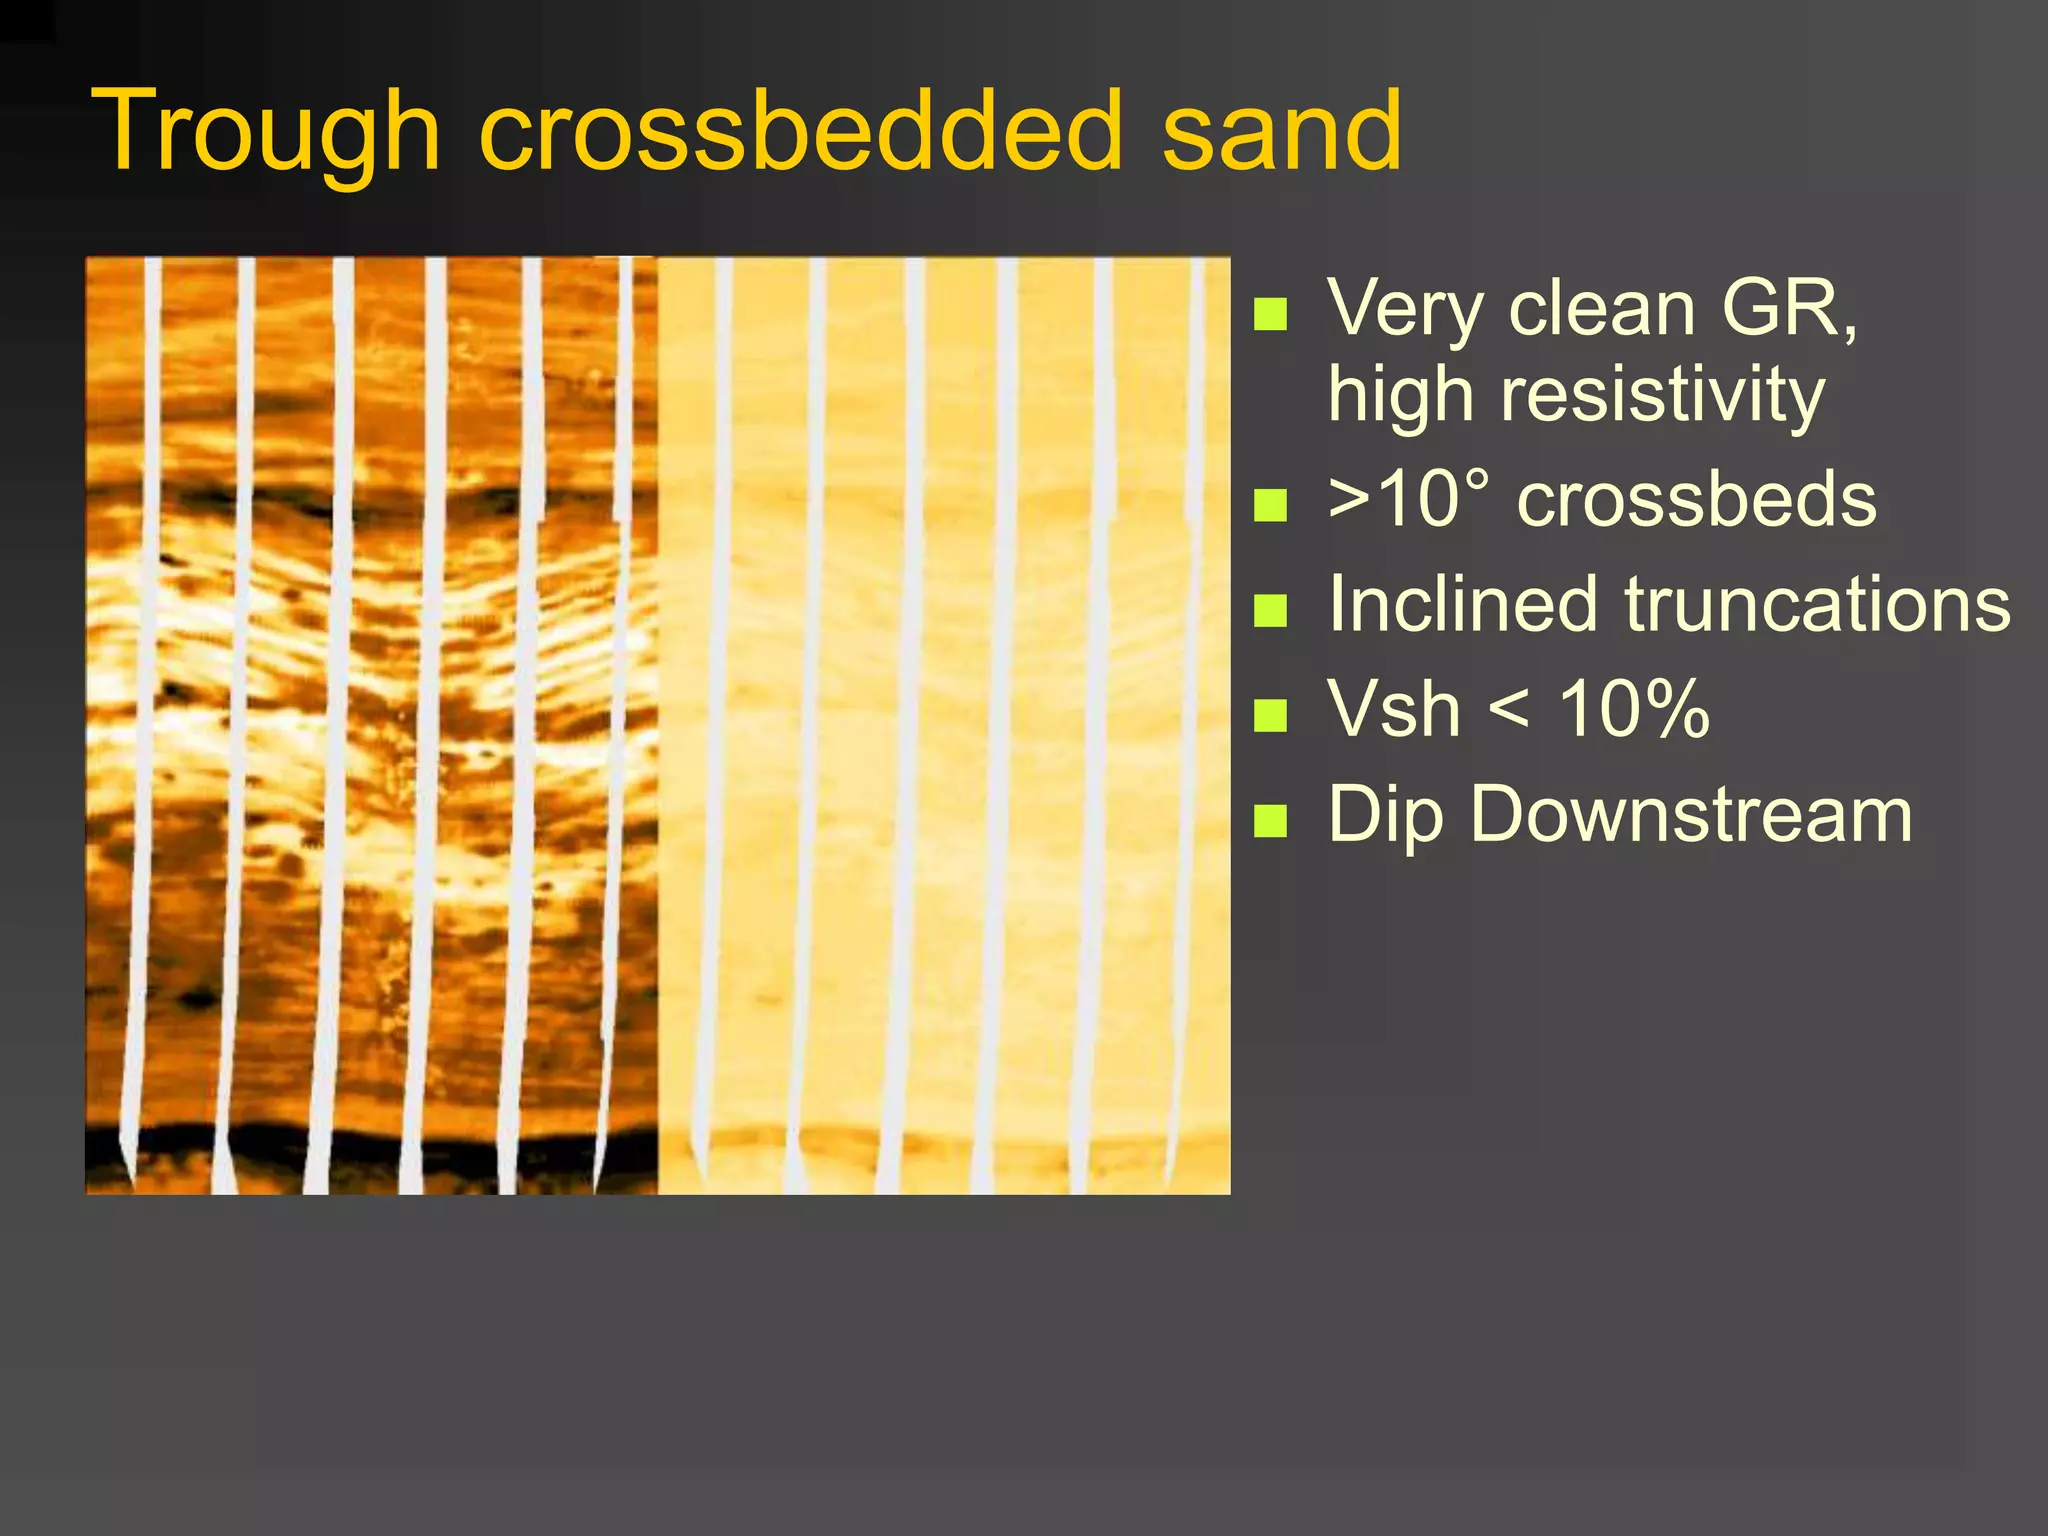
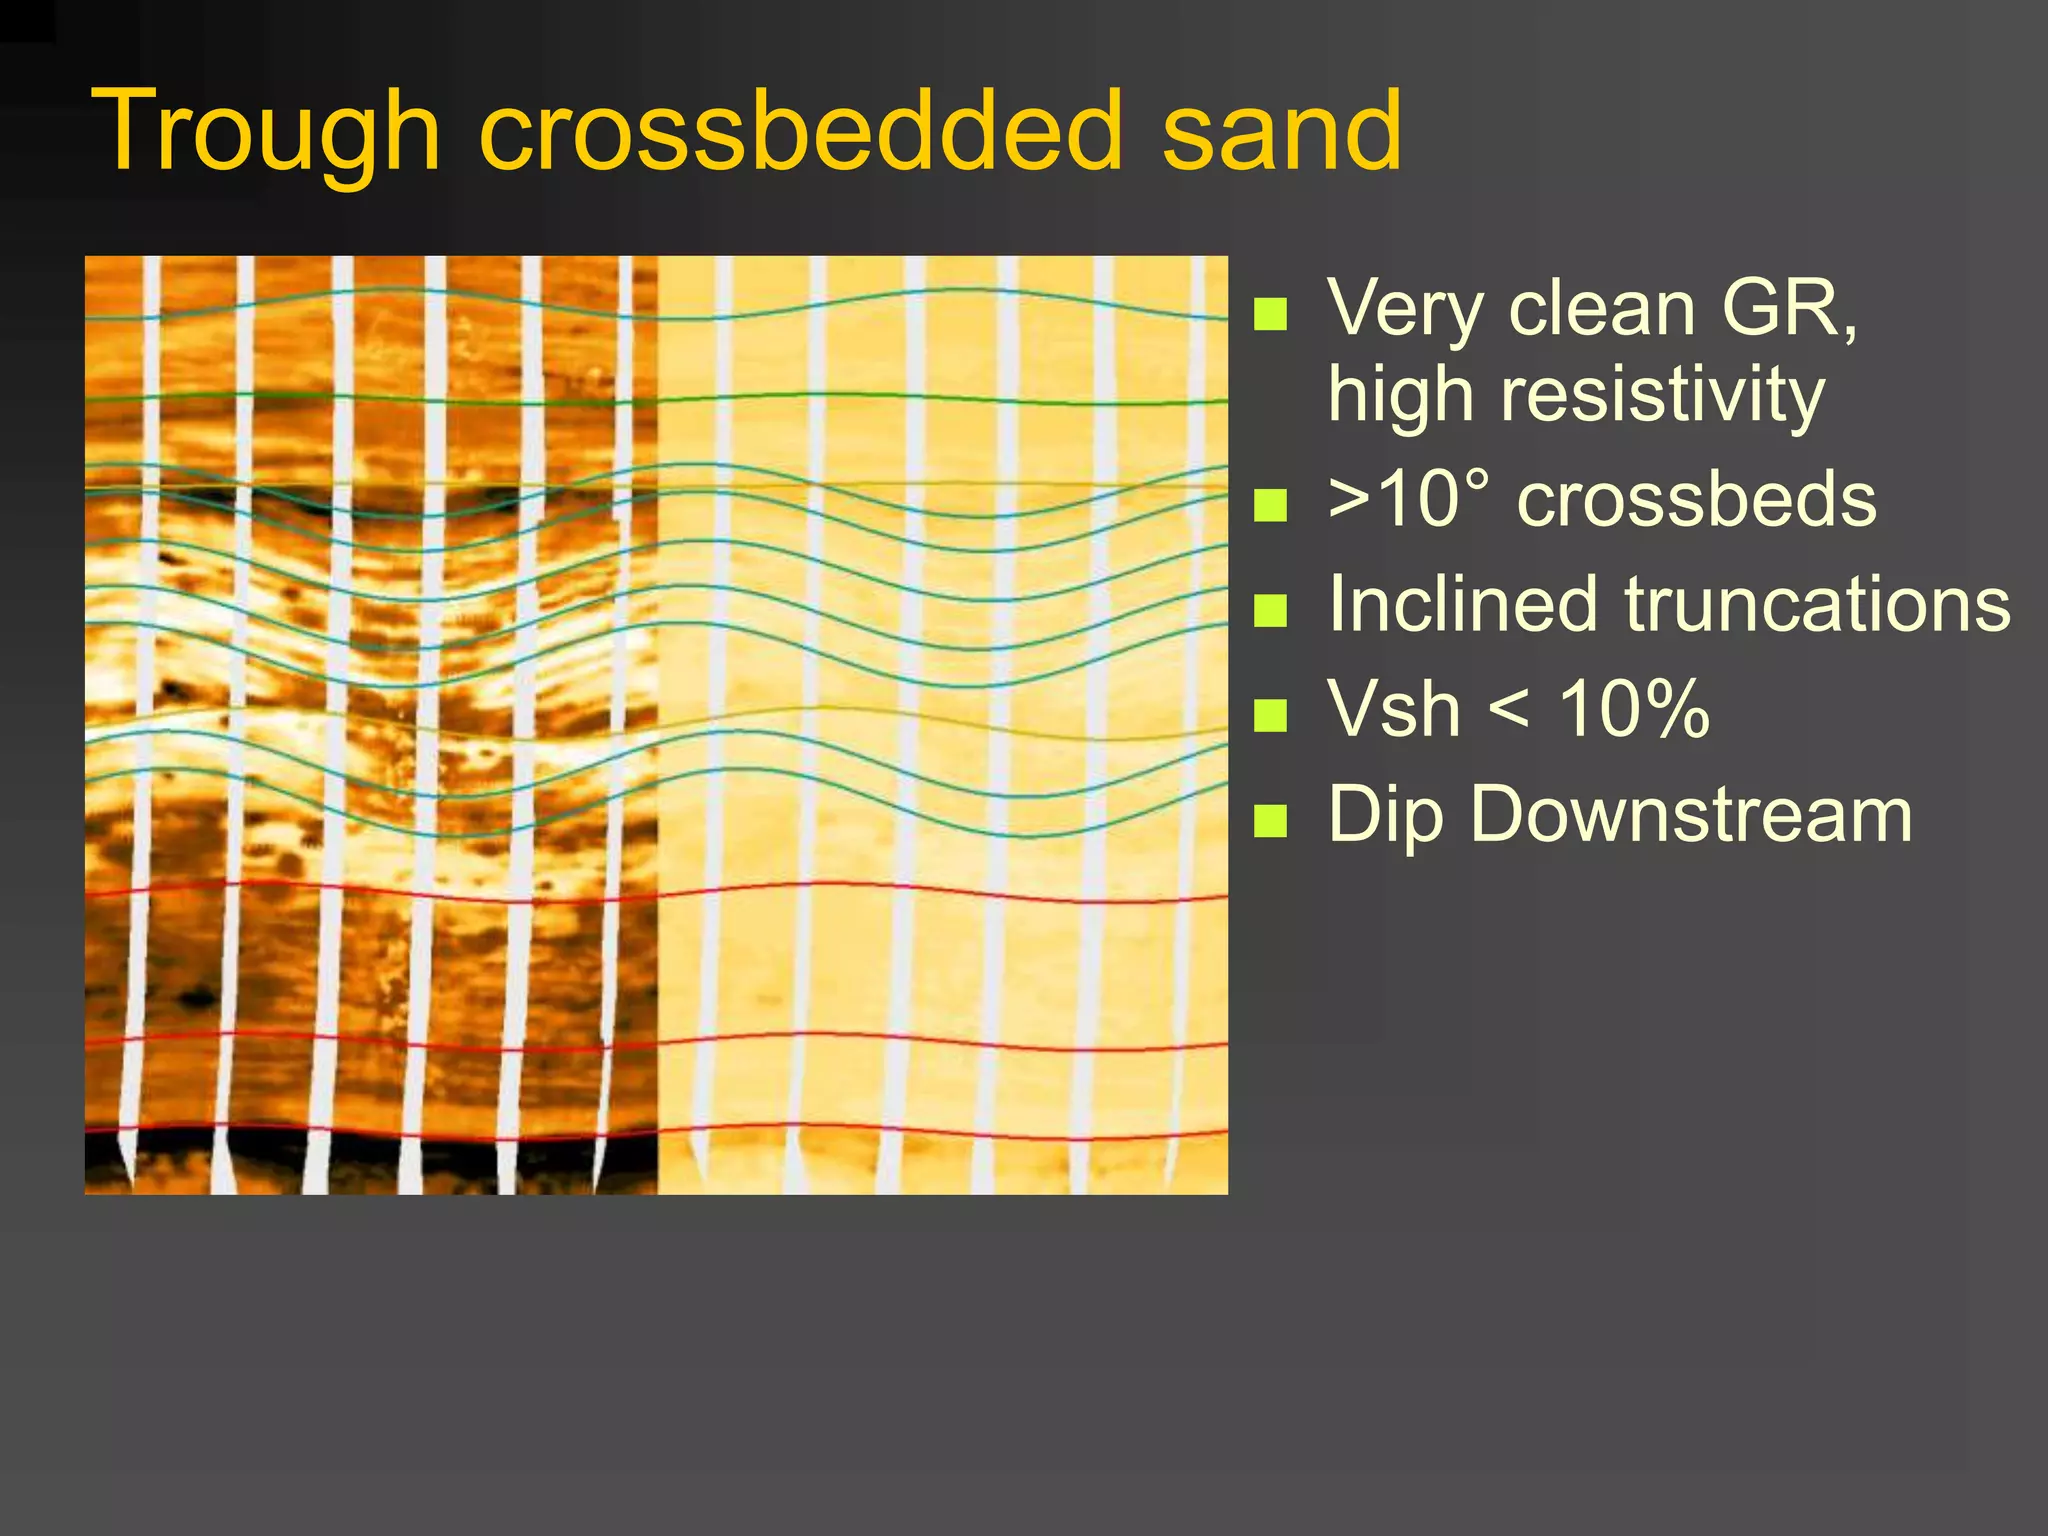
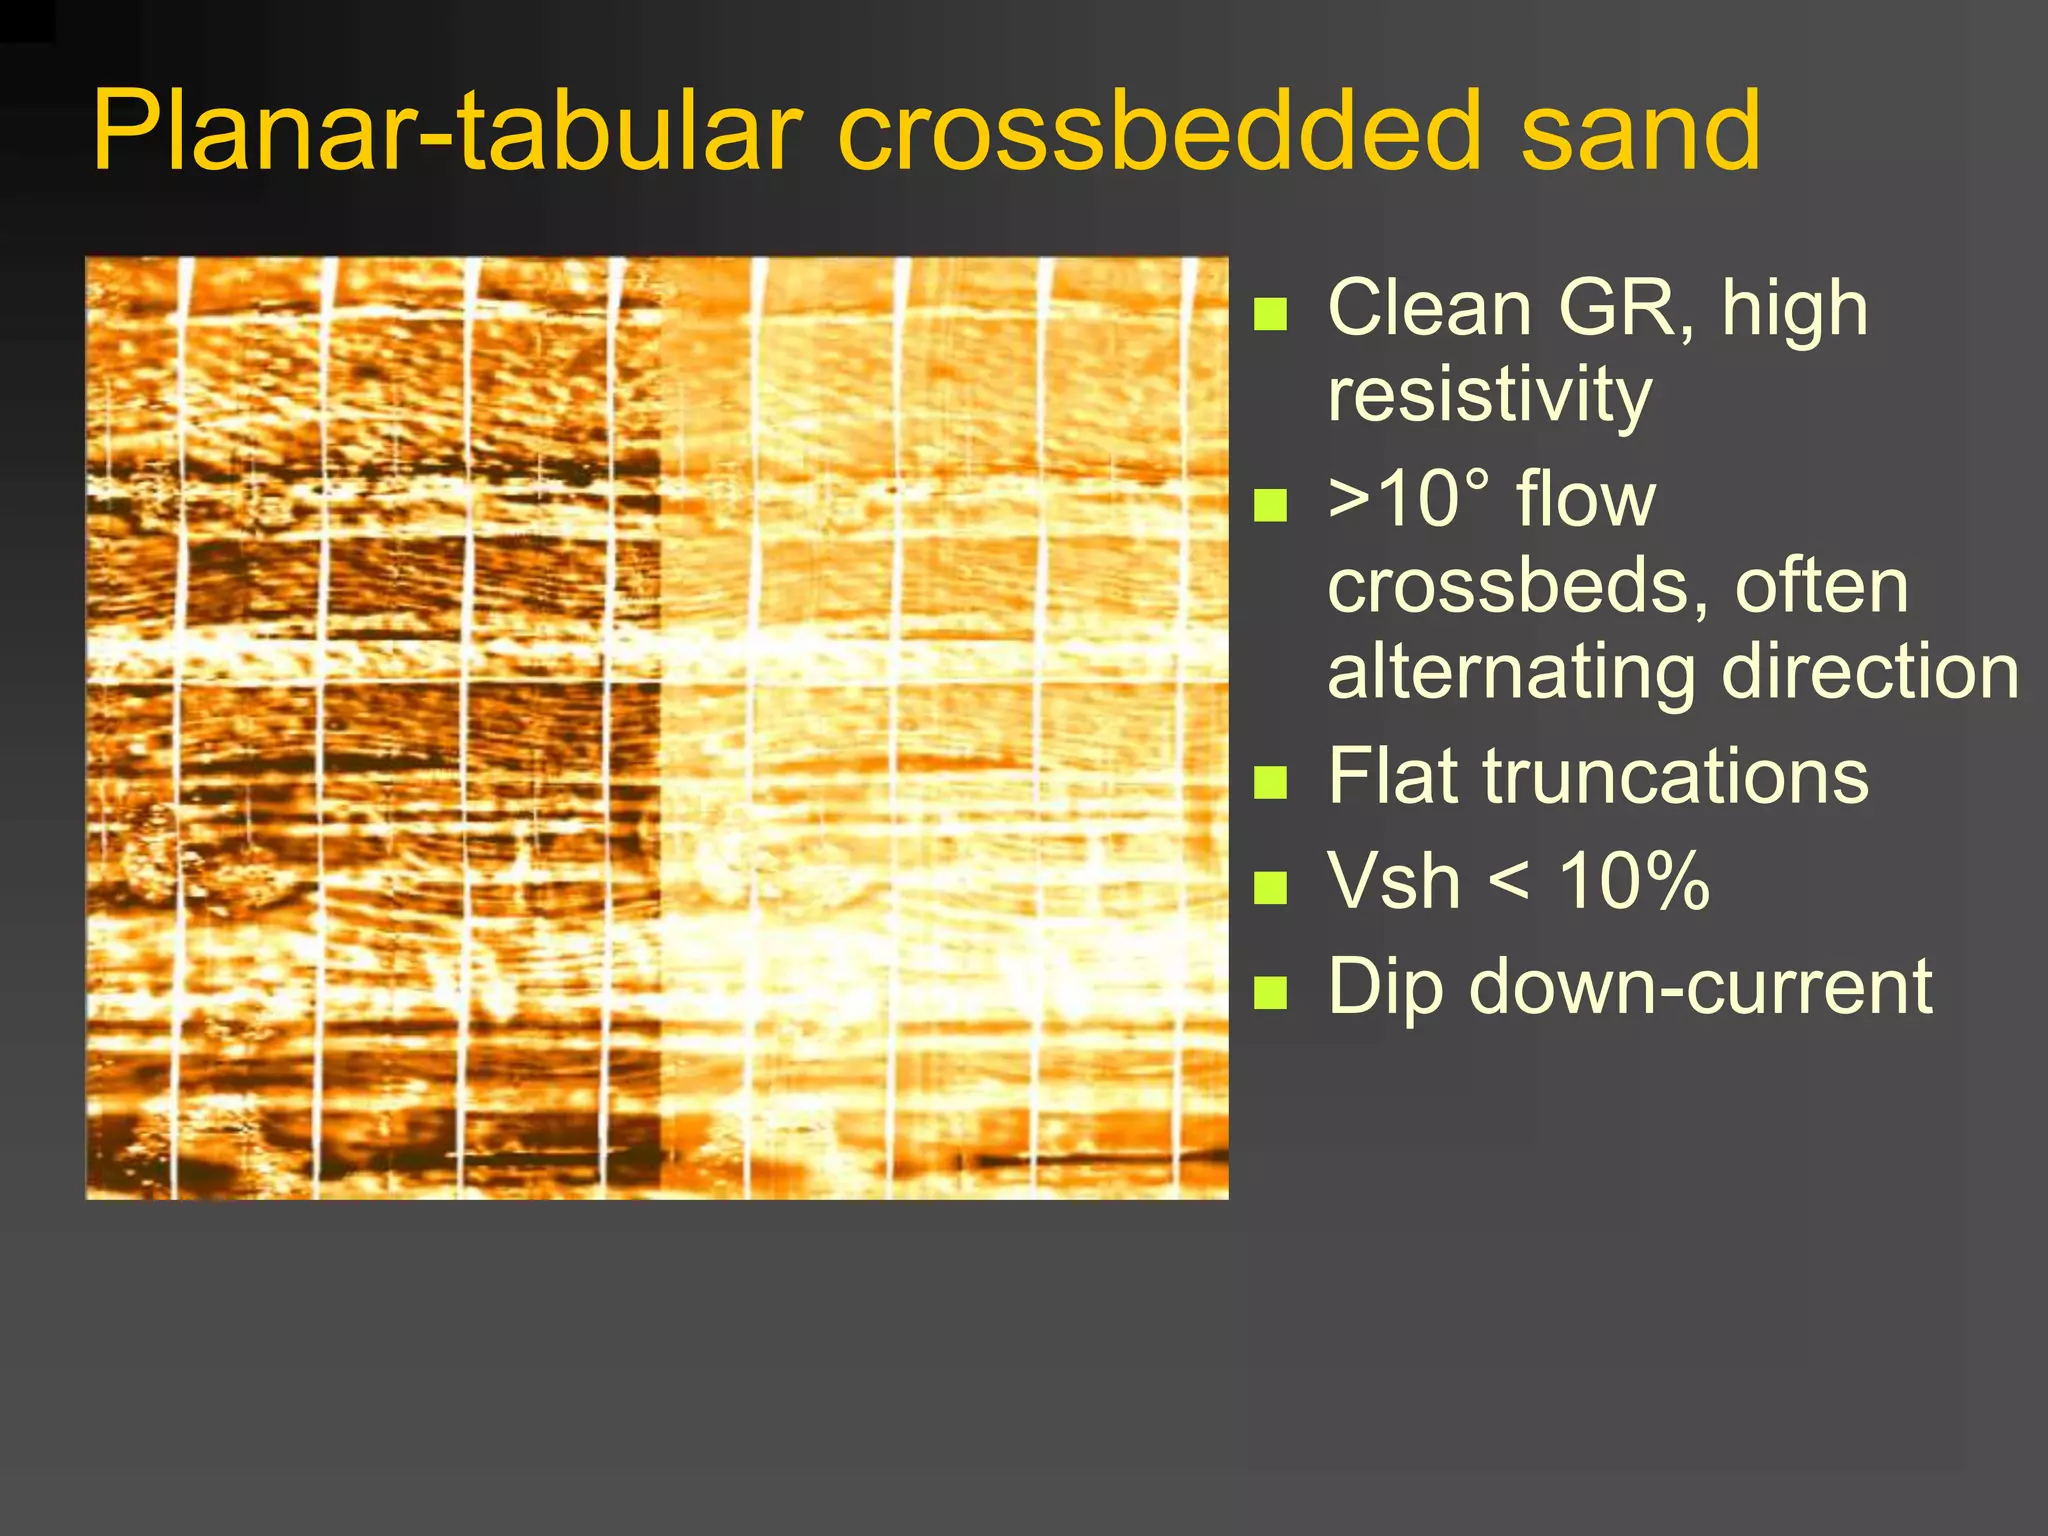
Planar-tabular crossbedded sand
Clean GR, high
resistivity
>10° flow
crossbeds, often
alternating direction
Flat truncations
Vsh < 10%
Dip down-current
35.
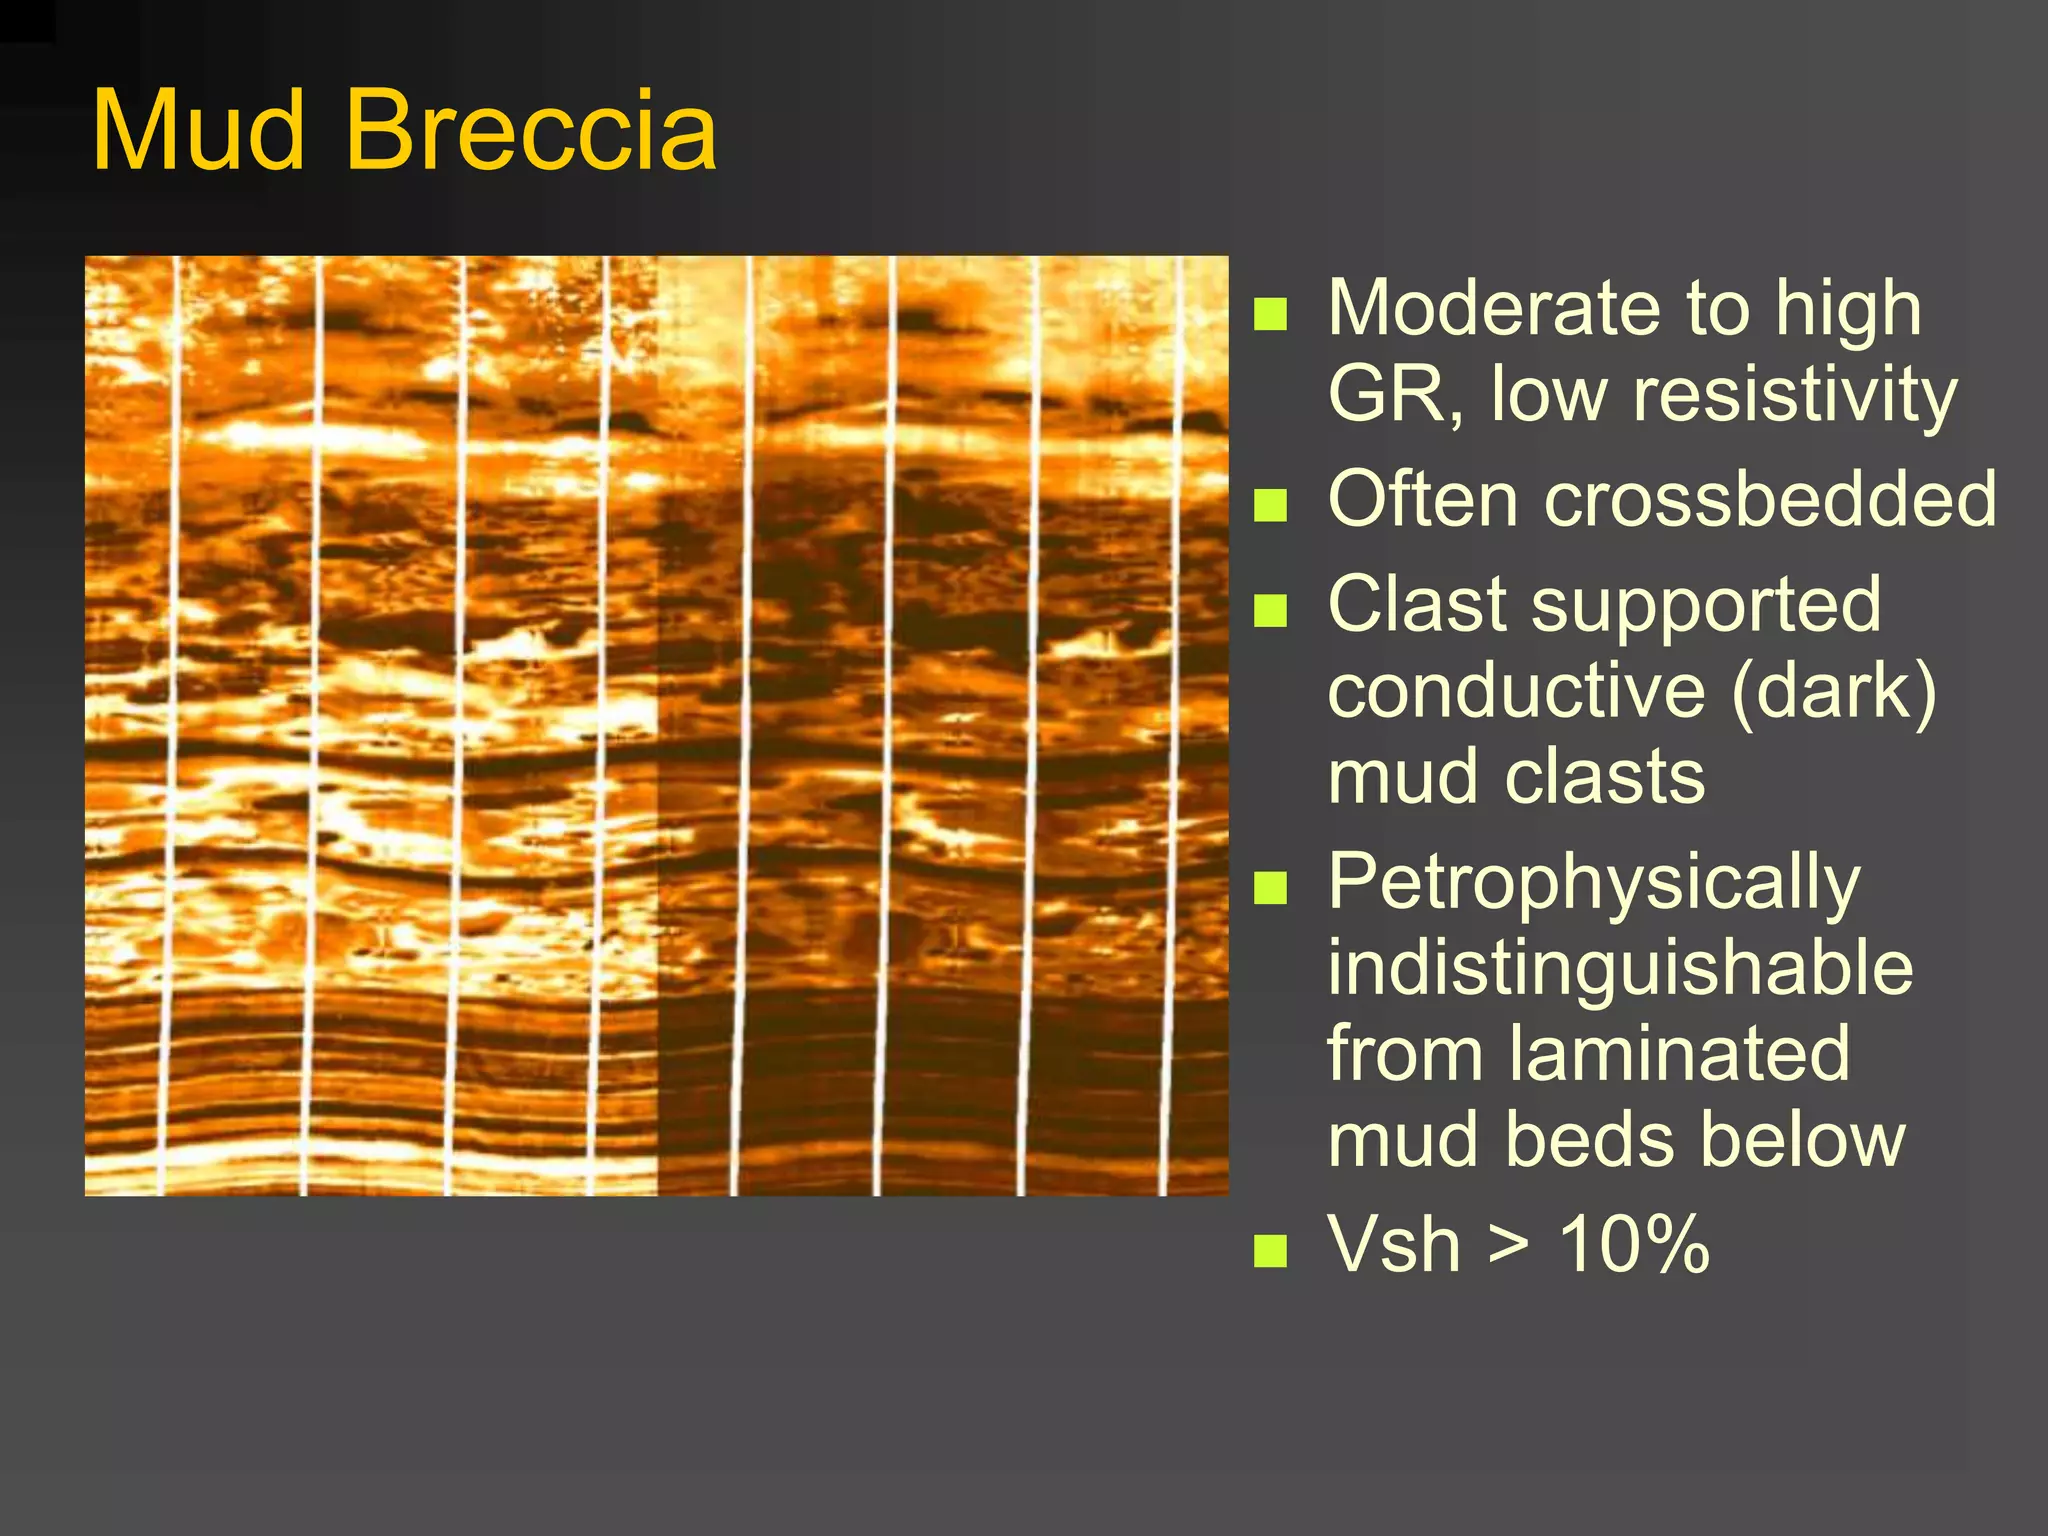
Mud Breccia
Moderateto high
GR, low resistivity
Often crossbedded
Clast supported
conductive (dark)
mud clasts
Petrophysically
indistinguishable
from laminated
mud beds below
Vsh > 10%
36.
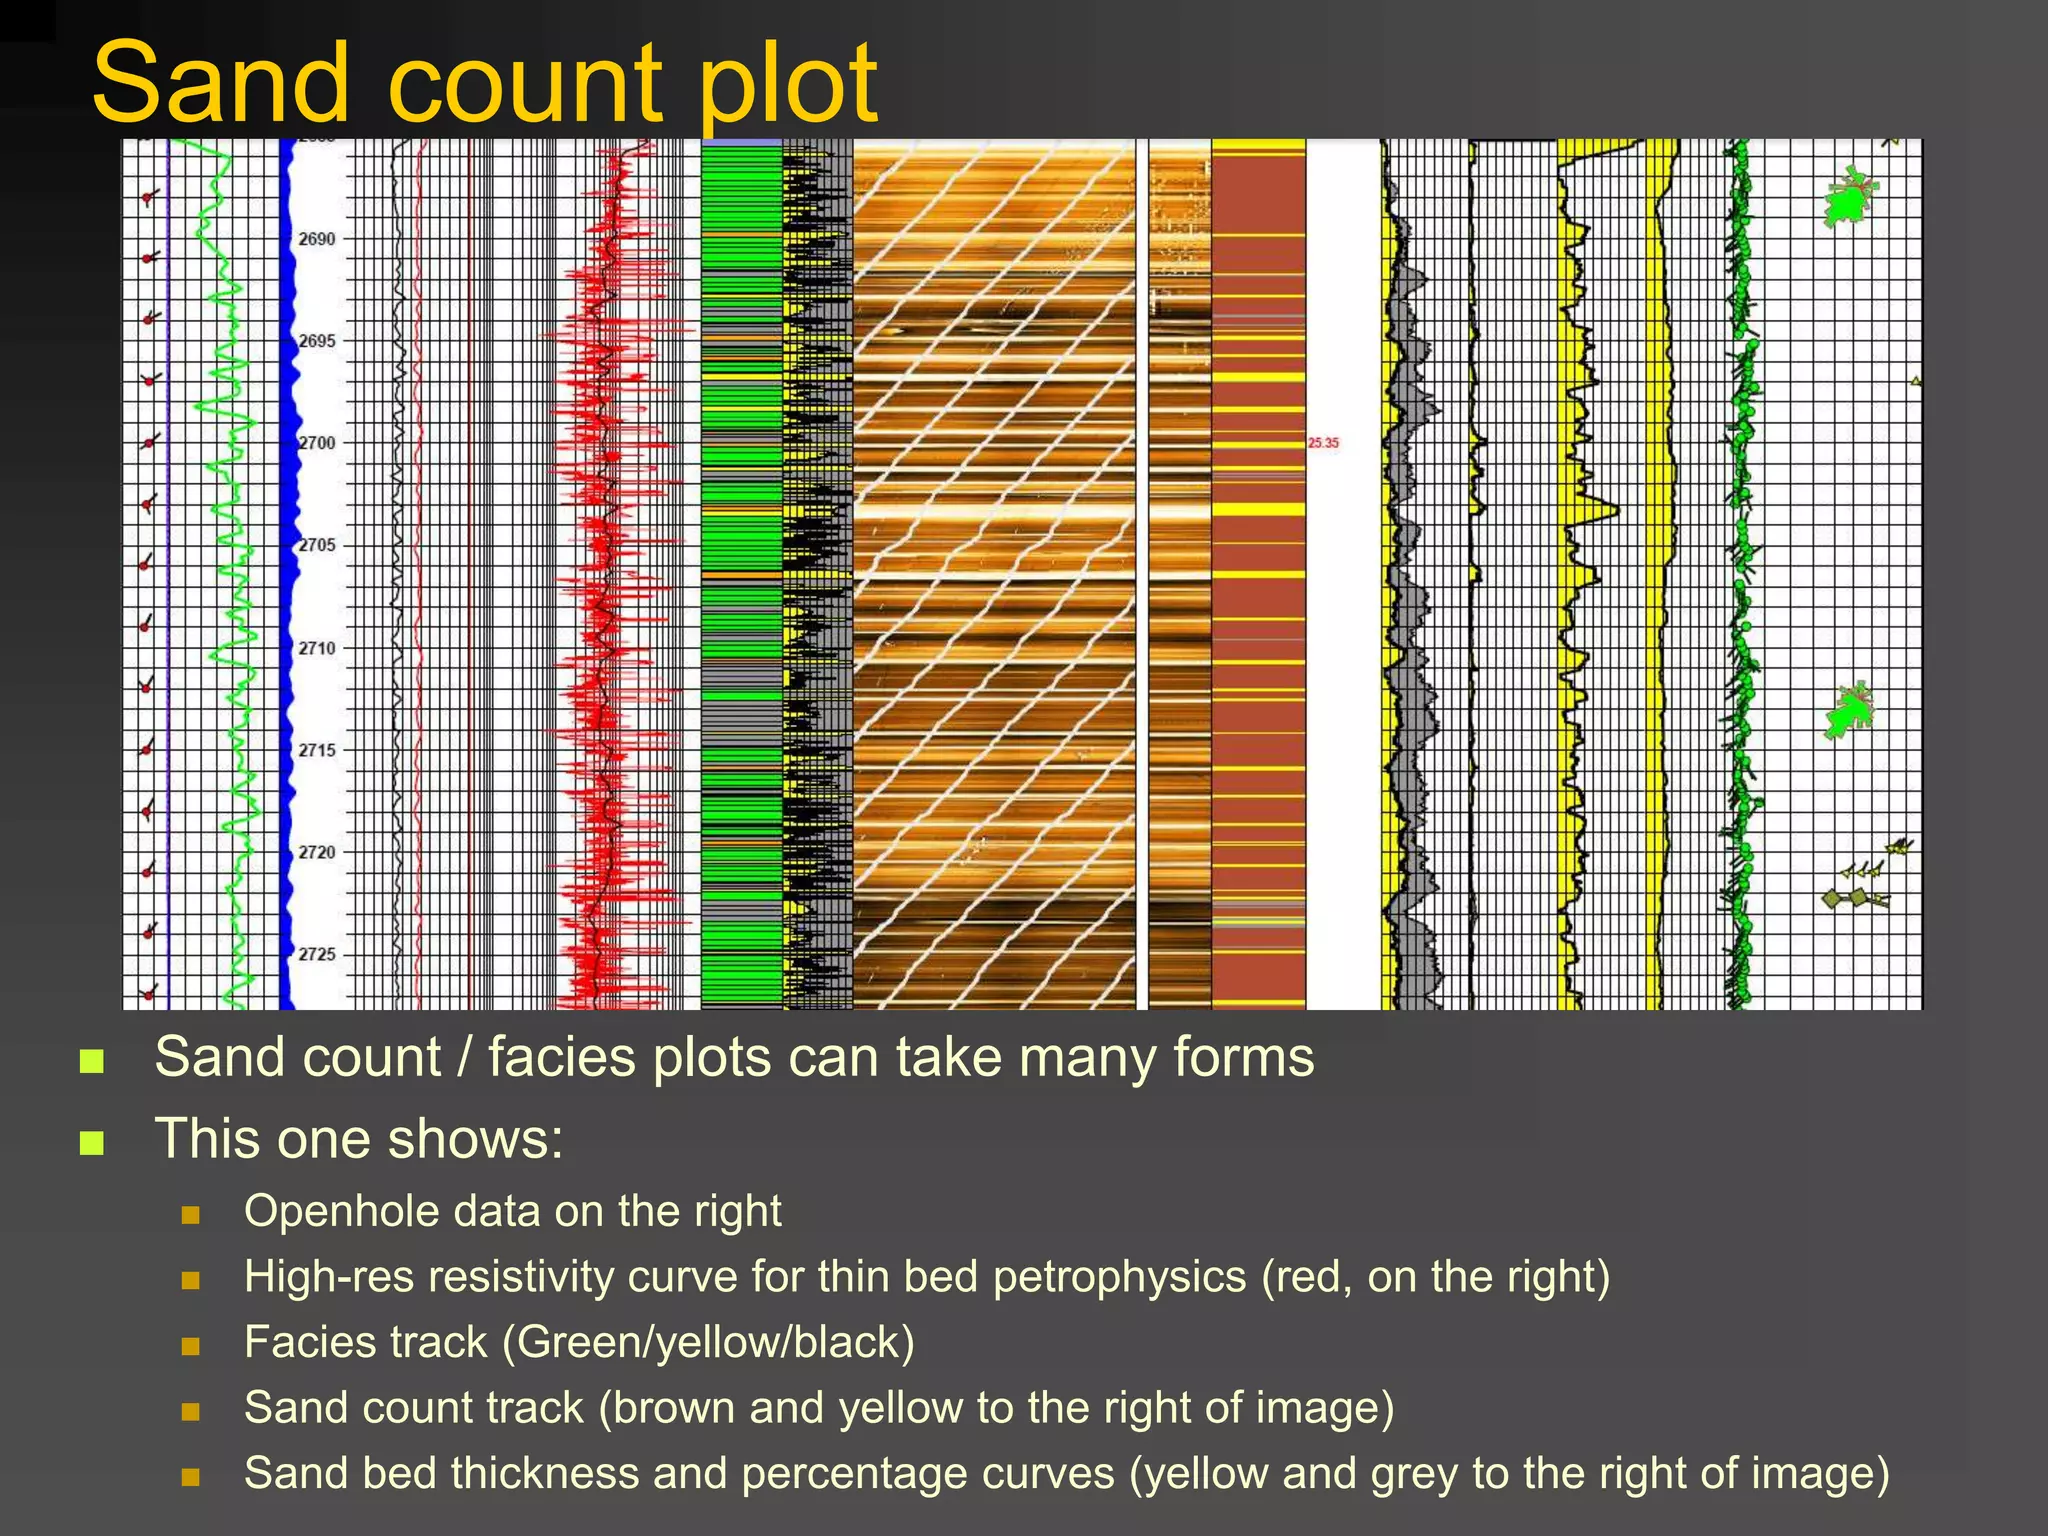
Sand count plot
Sand count / facies plots can take many forms
This one shows:
Openhole data on the right
High-res resistivity curve for thin bed petrophysics (red, on the right)
Facies track (Green/yellow/black)
Sand count track (brown and yellow to the right of image)
Sand bed thickness and percentage curves (yellow and grey to the right of image)
37.
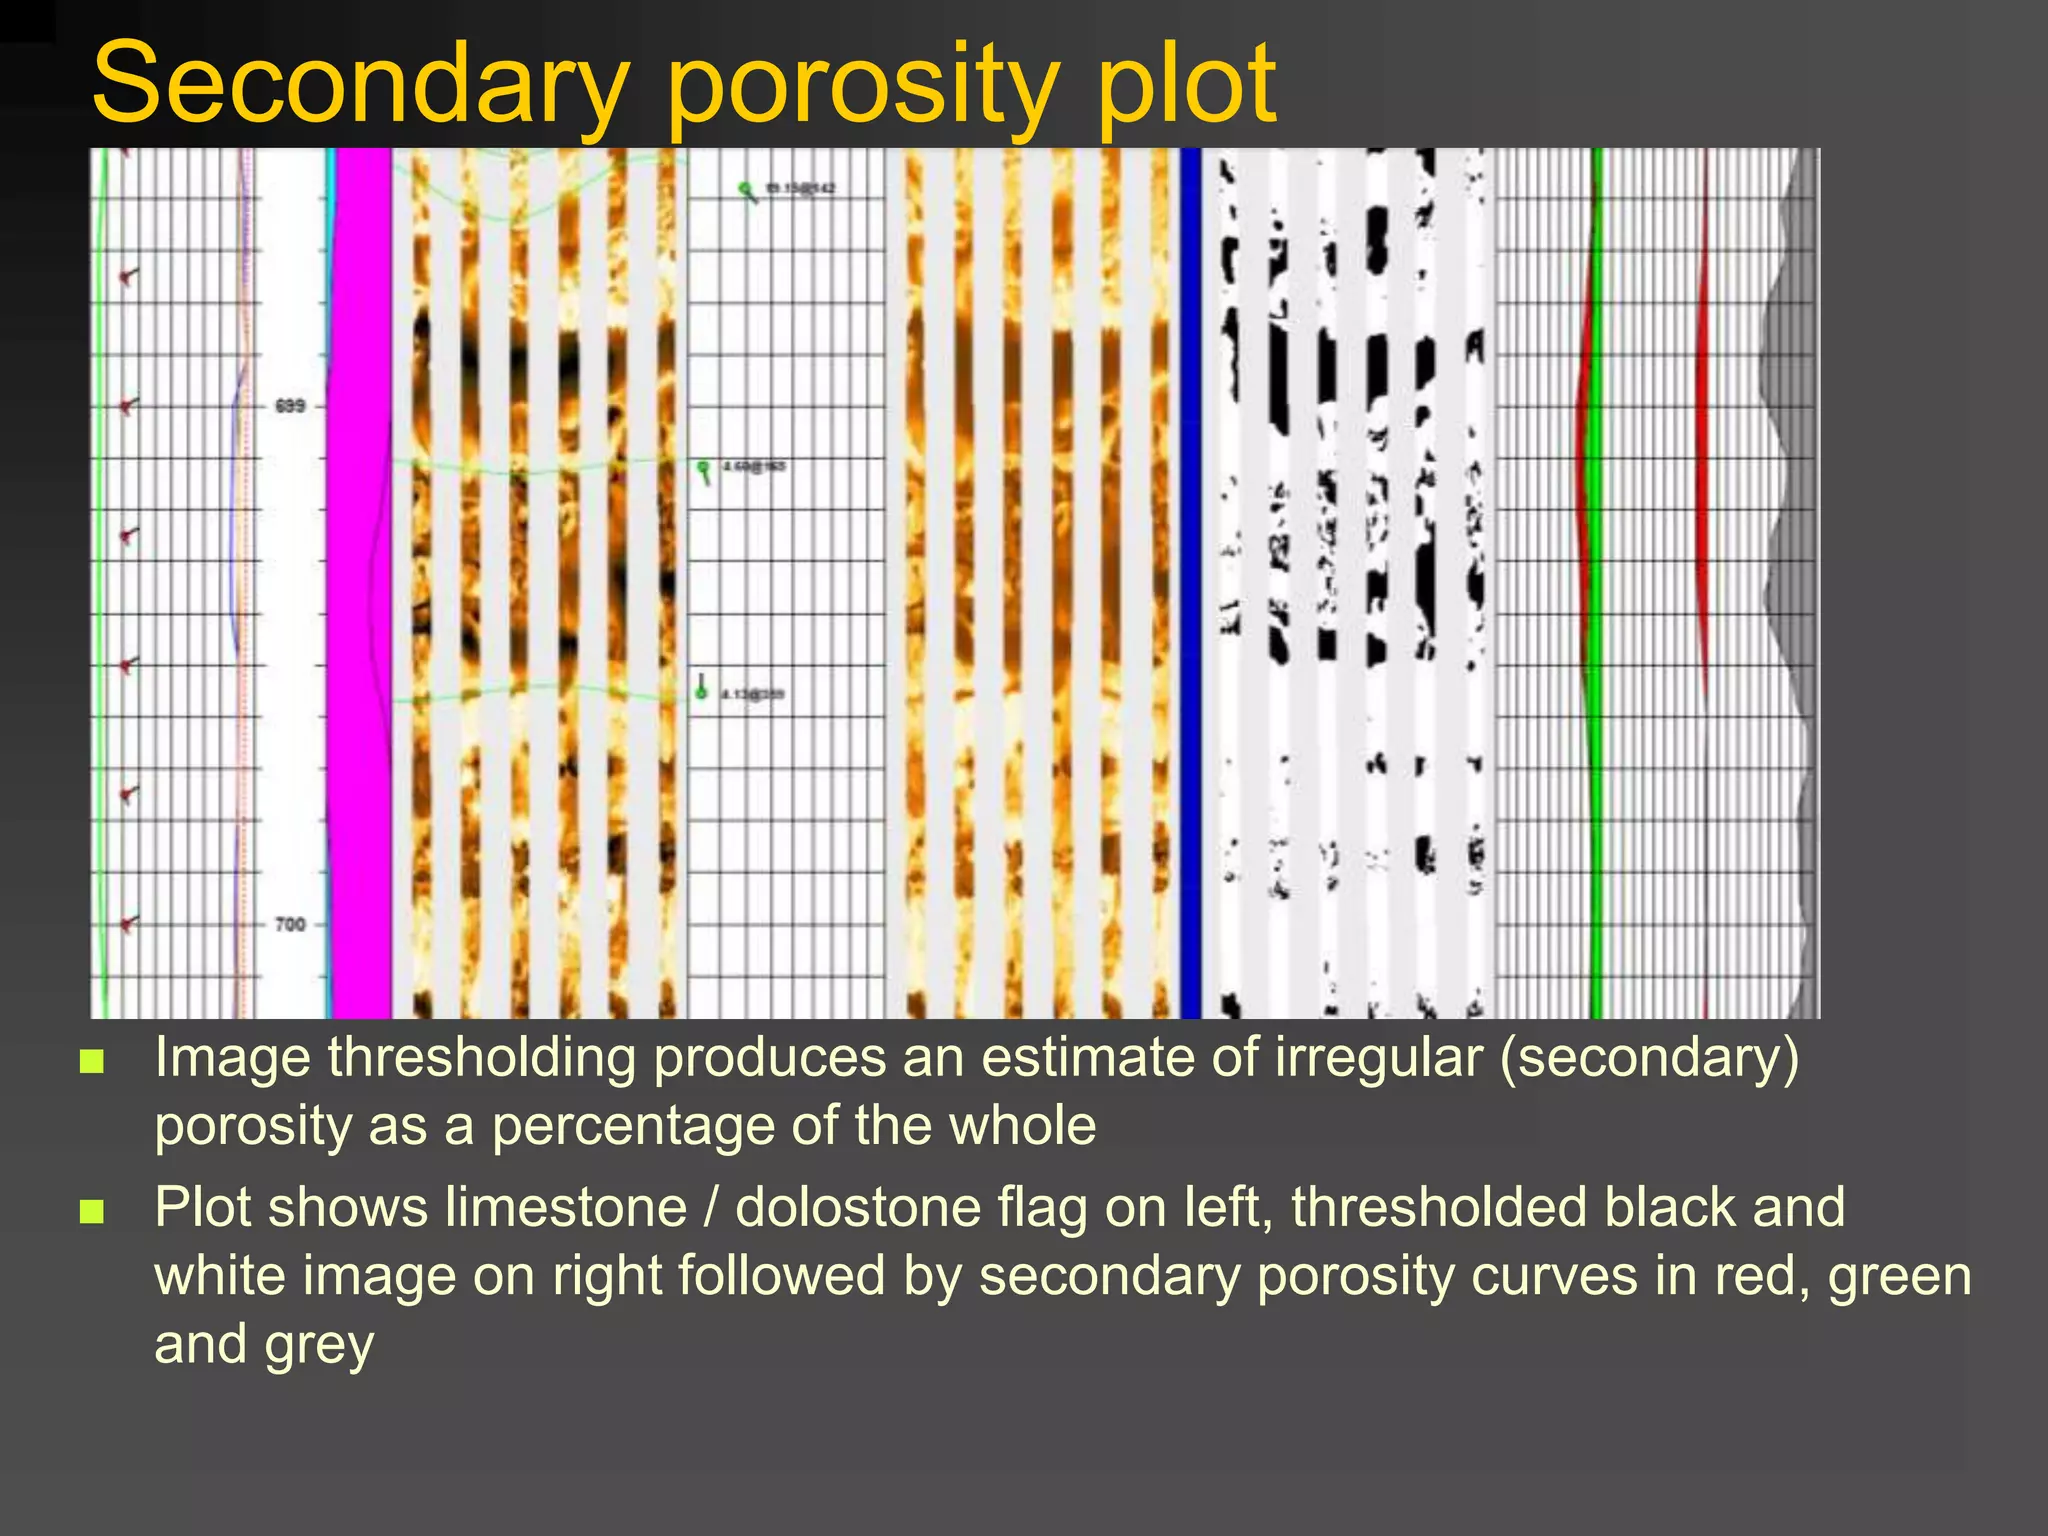
Secondary porosity plot
Image thresholding produces an estimate of irregular (secondary)
porosity as a percentage of the whole
Plot shows limestone / dolostone flag on left, thresholded black and
white image on right followed by secondary porosity curves in red, green
and grey
38.
Bed Interpretation products
Stereonet, Tadpole, Stick, TST, etc. (Paper / PDF)
Lithology zonation file (LAS) and plots
Bed dip types on plots and in LAS / ASCII
39.
Outline
Basics ofborehole image interpretation
Bedding and structural dip analysis
Natural fractures
Stress features
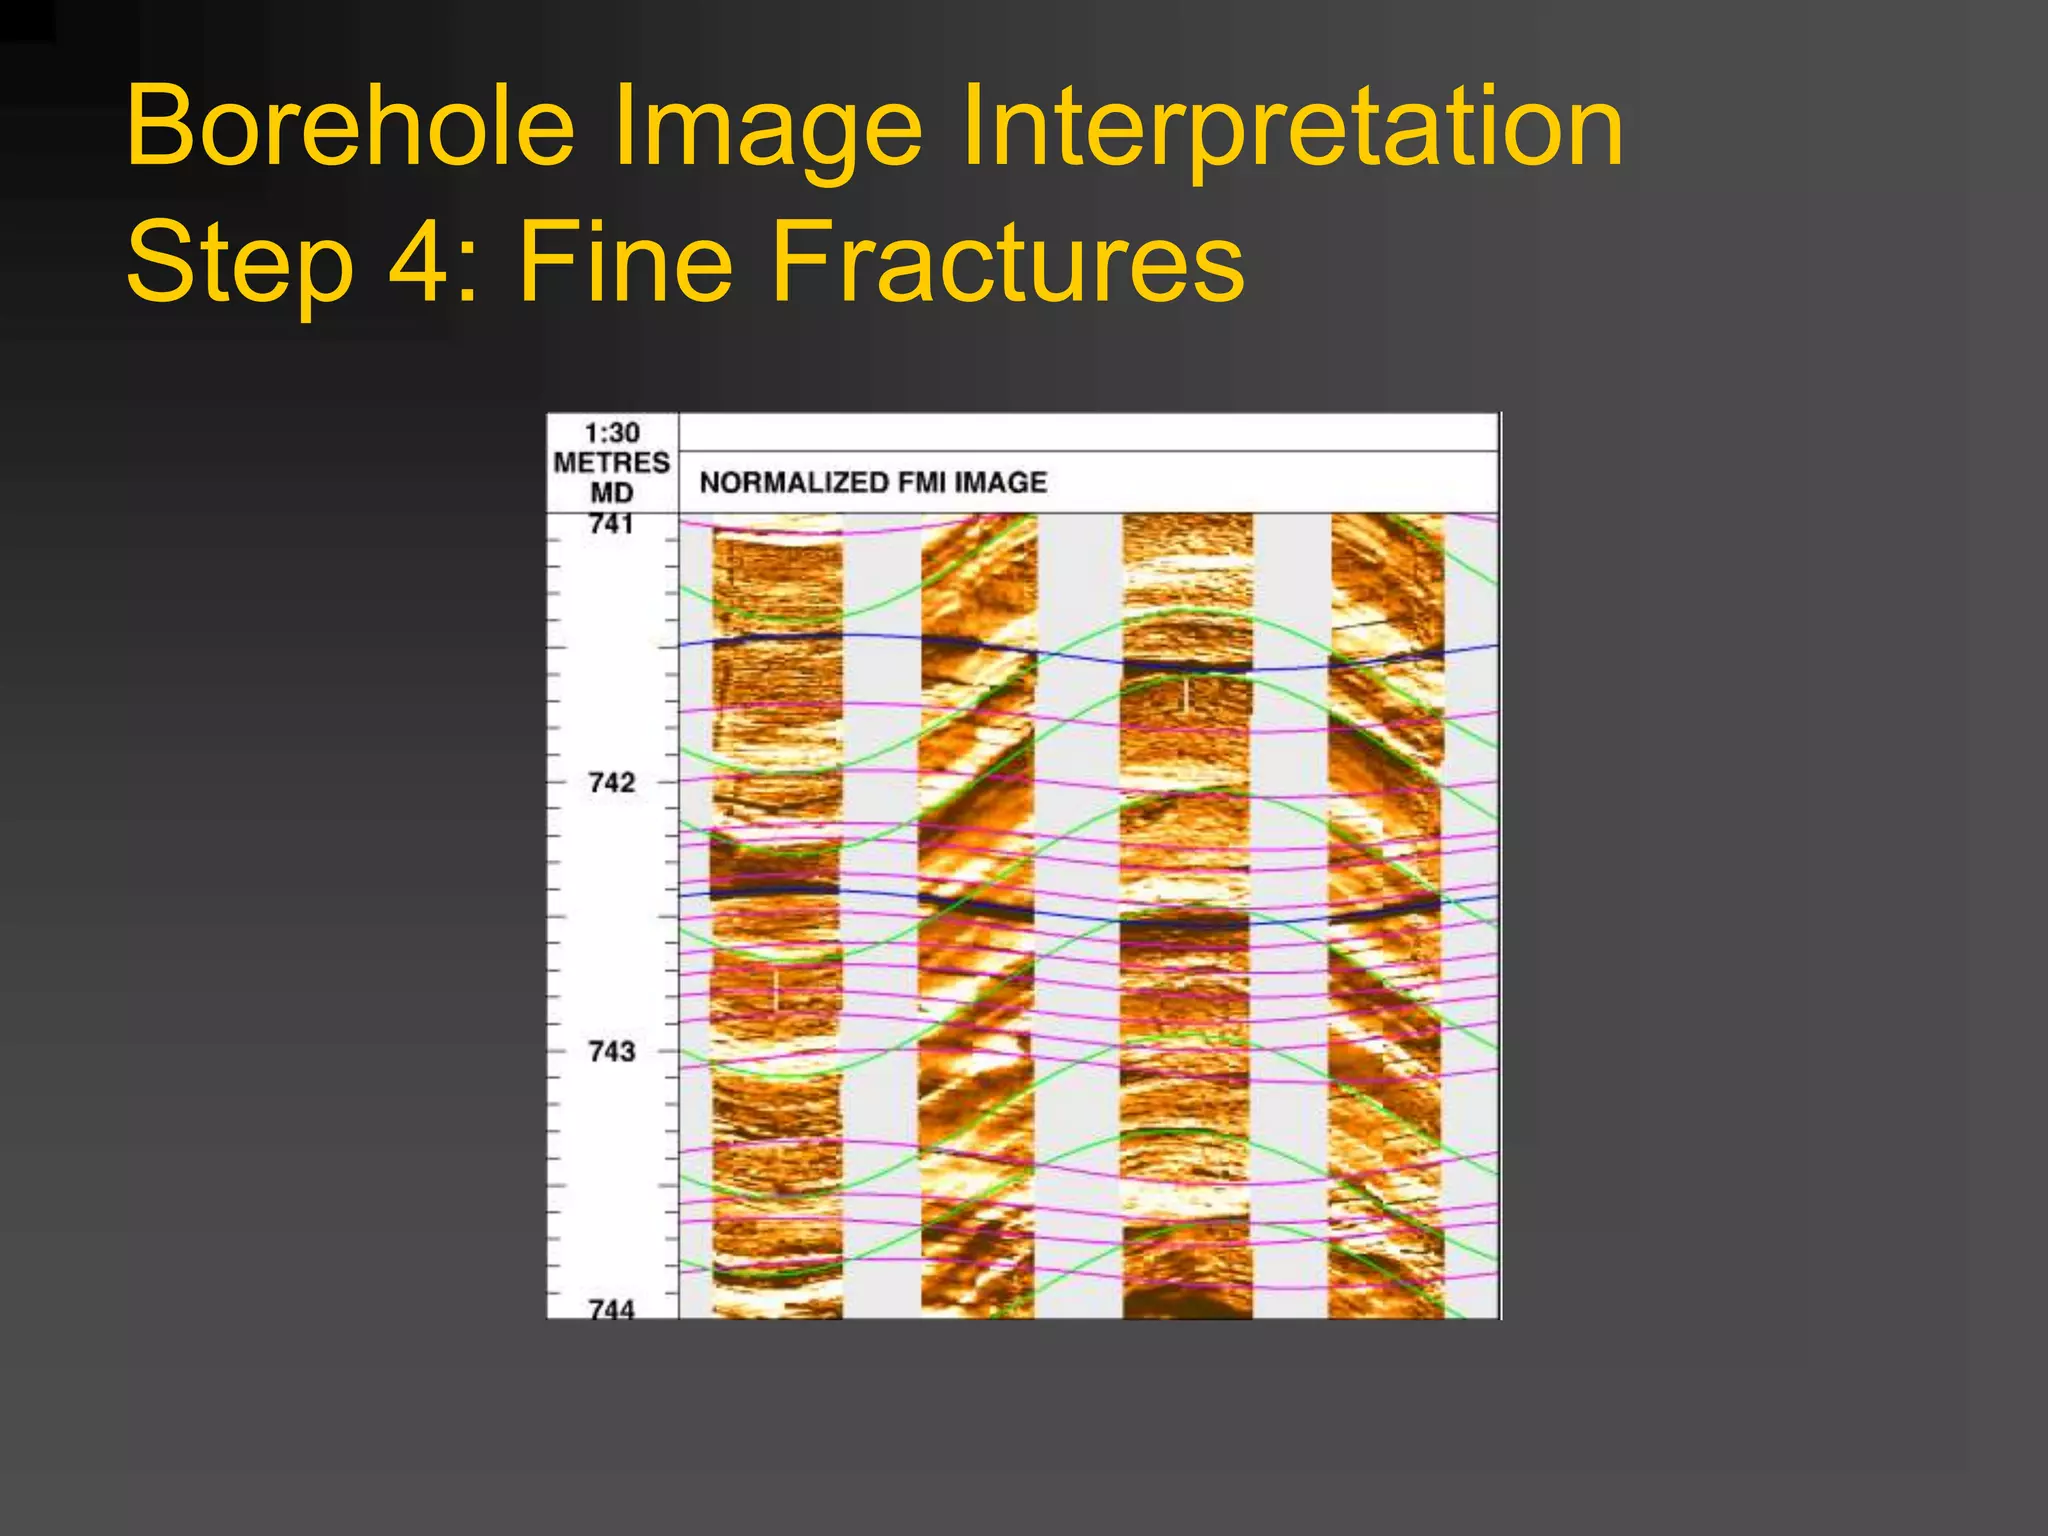
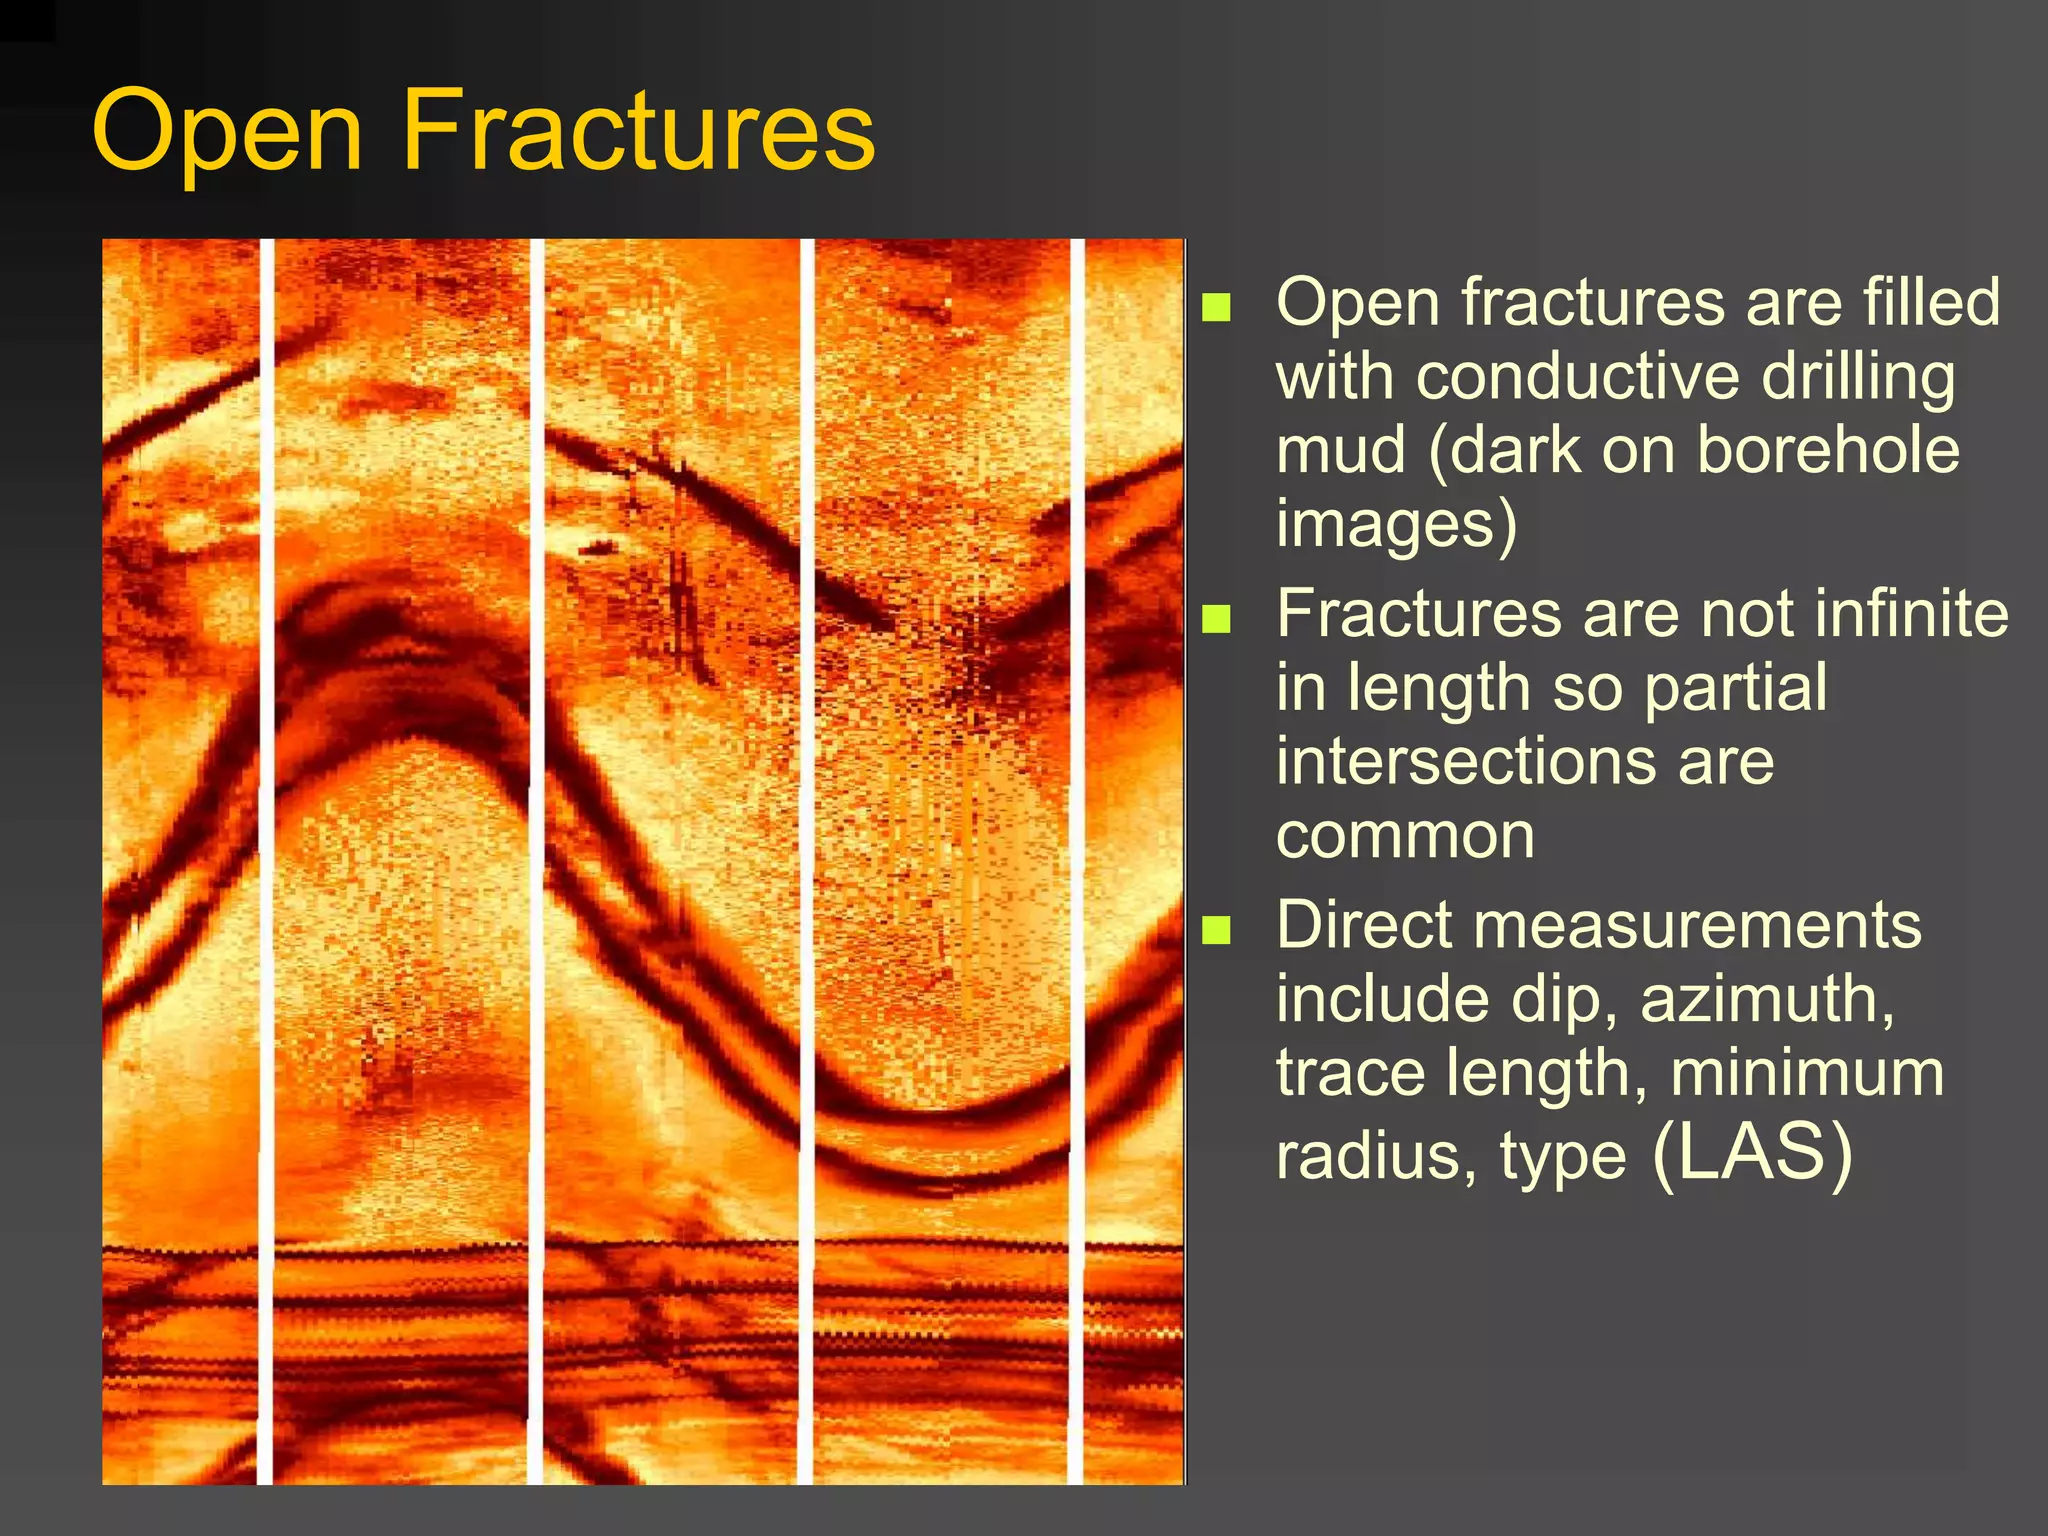
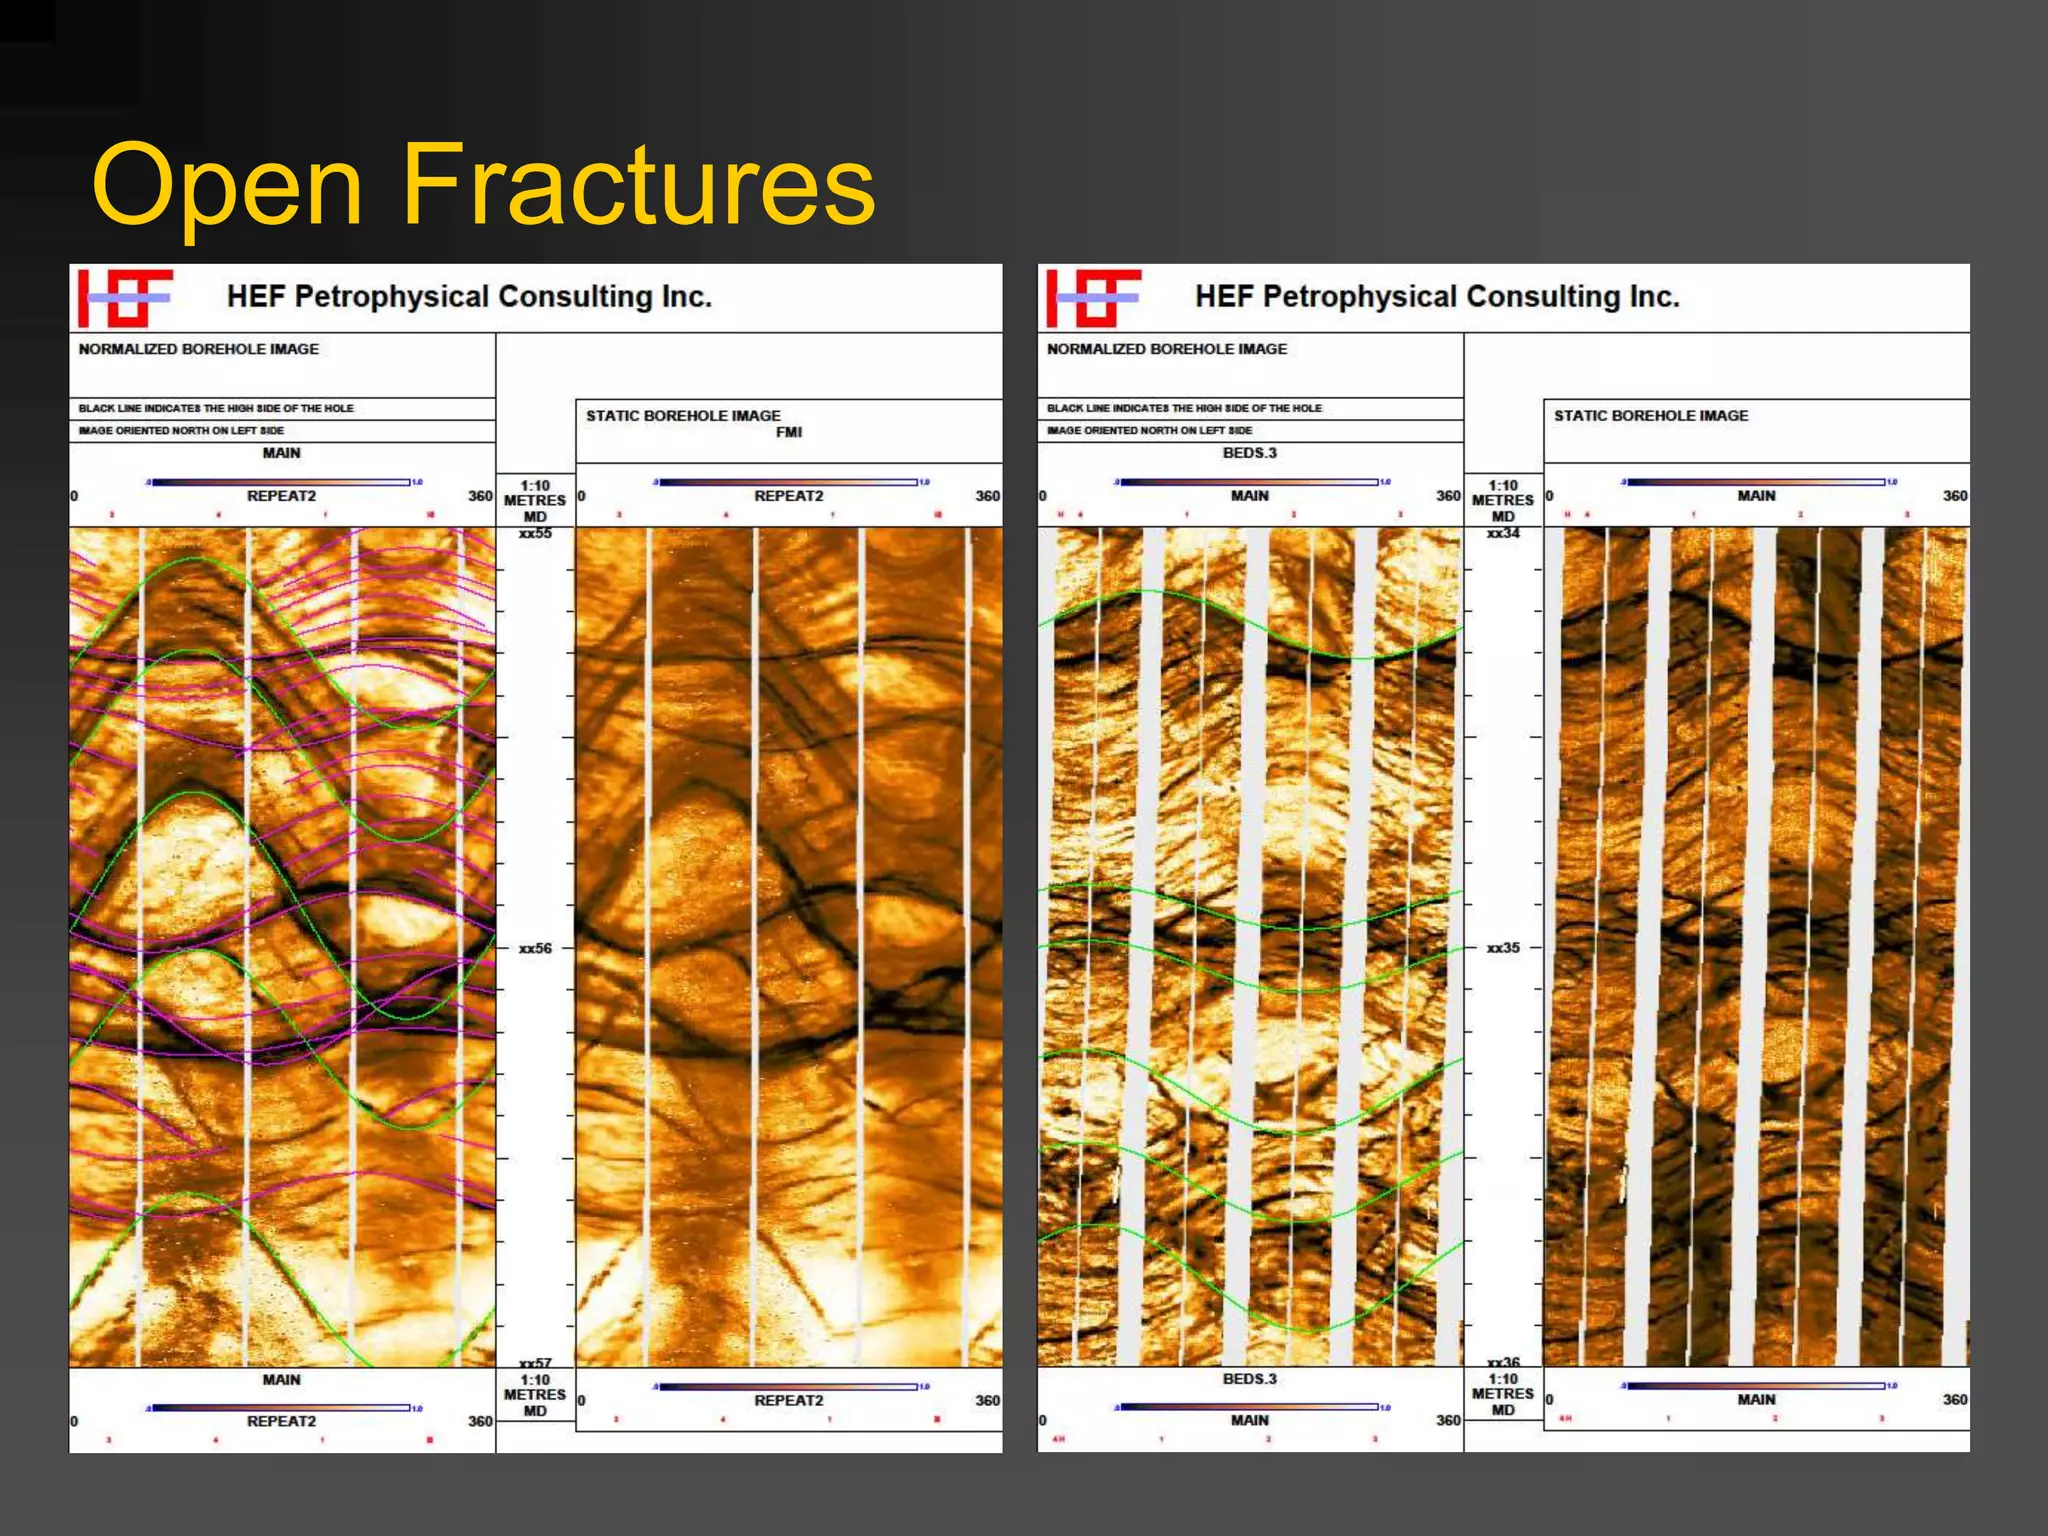
Open Fractures
Openfractures are filled
with conductive drilling
mud (dark on borehole
images)
Fractures are not infinite
in length so partial
intersections are
common
Direct measurements
include dip, azimuth,
trace length, minimum
radius, type (LAS)
42.
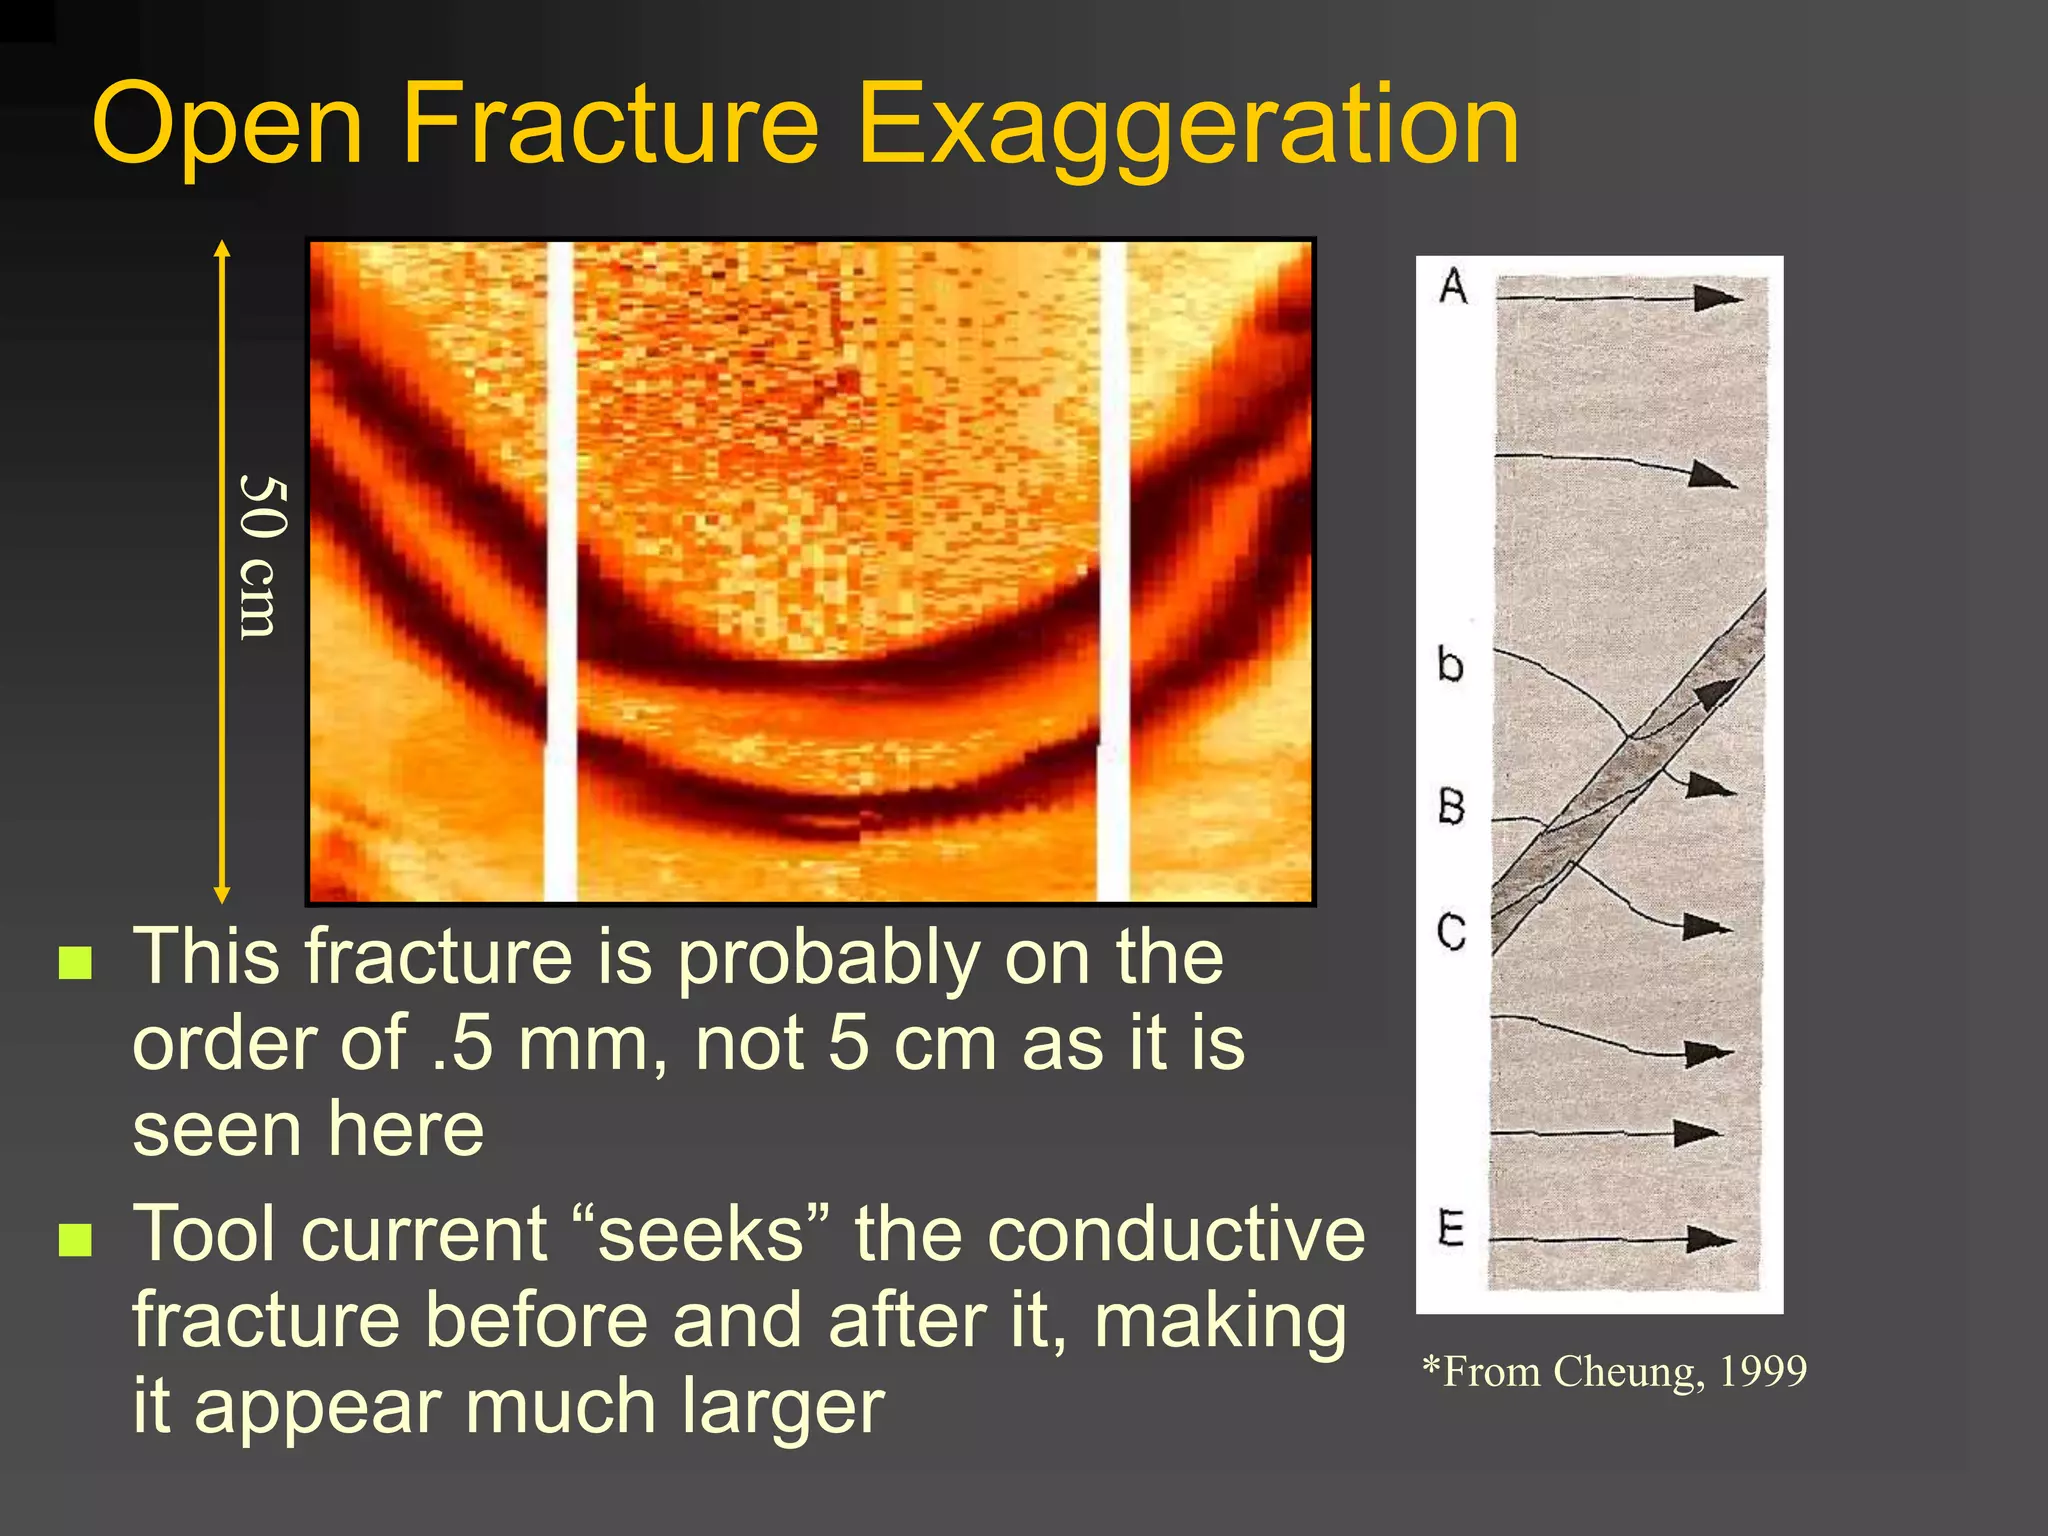
Open Fracture Exaggeration
50cm
This fracture is probably on the
order of .5 mm, not 5 cm as it is
seen here
Tool current “seeks” the conductive
fracture before and after it, making
it appear much larger
*From Cheung, 1999
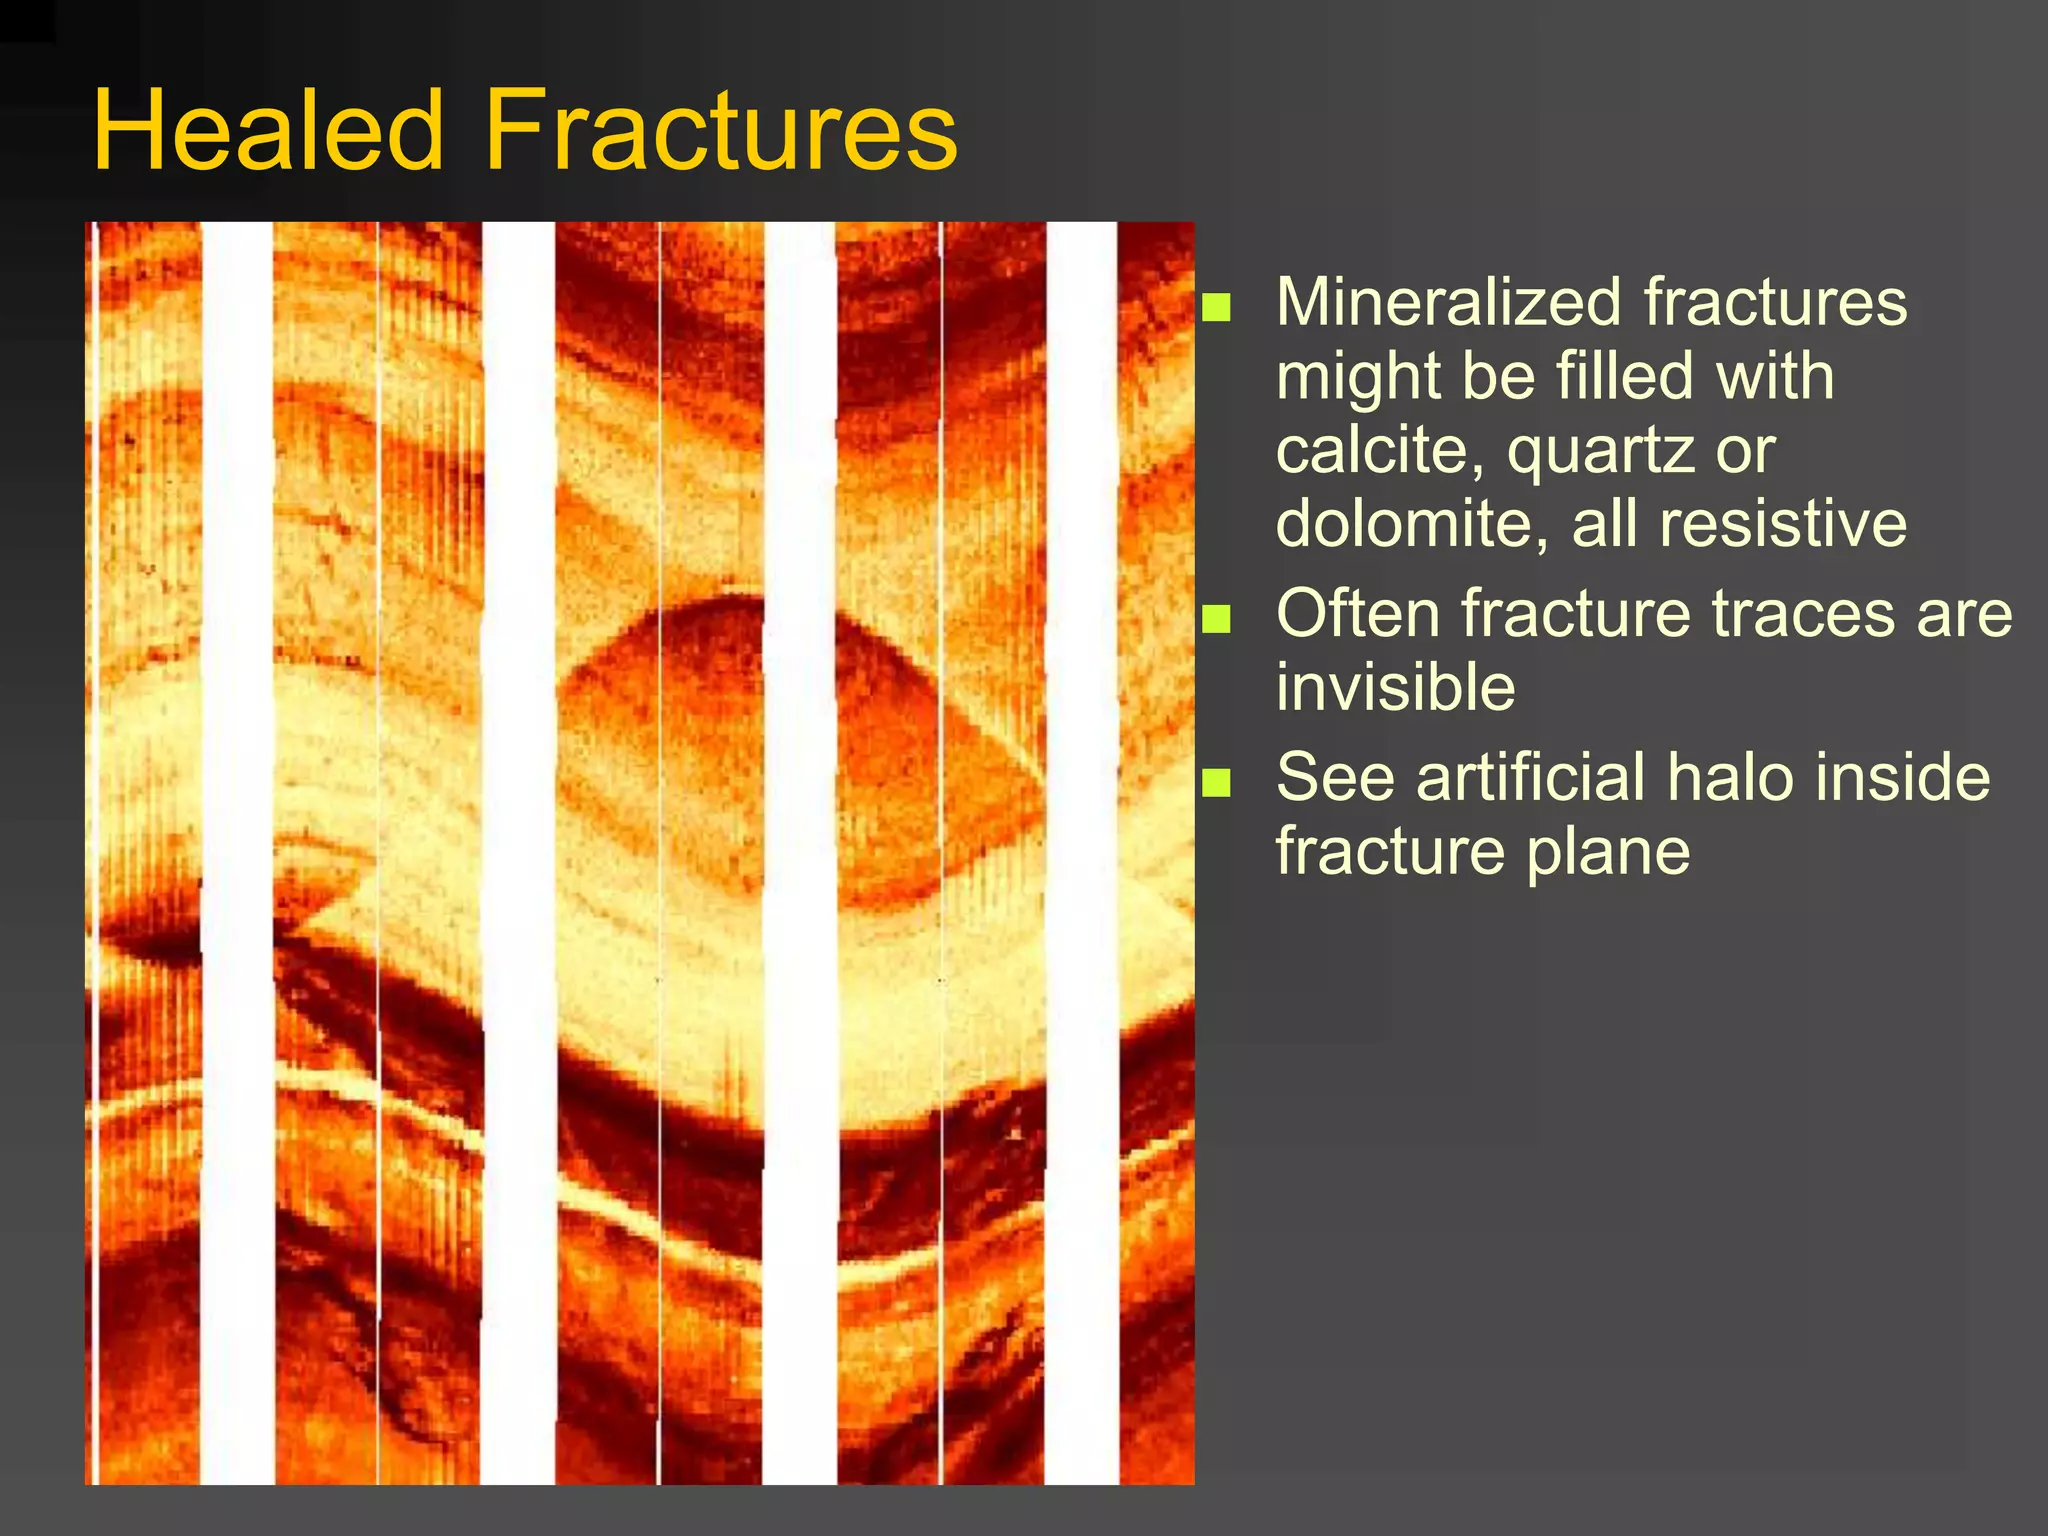
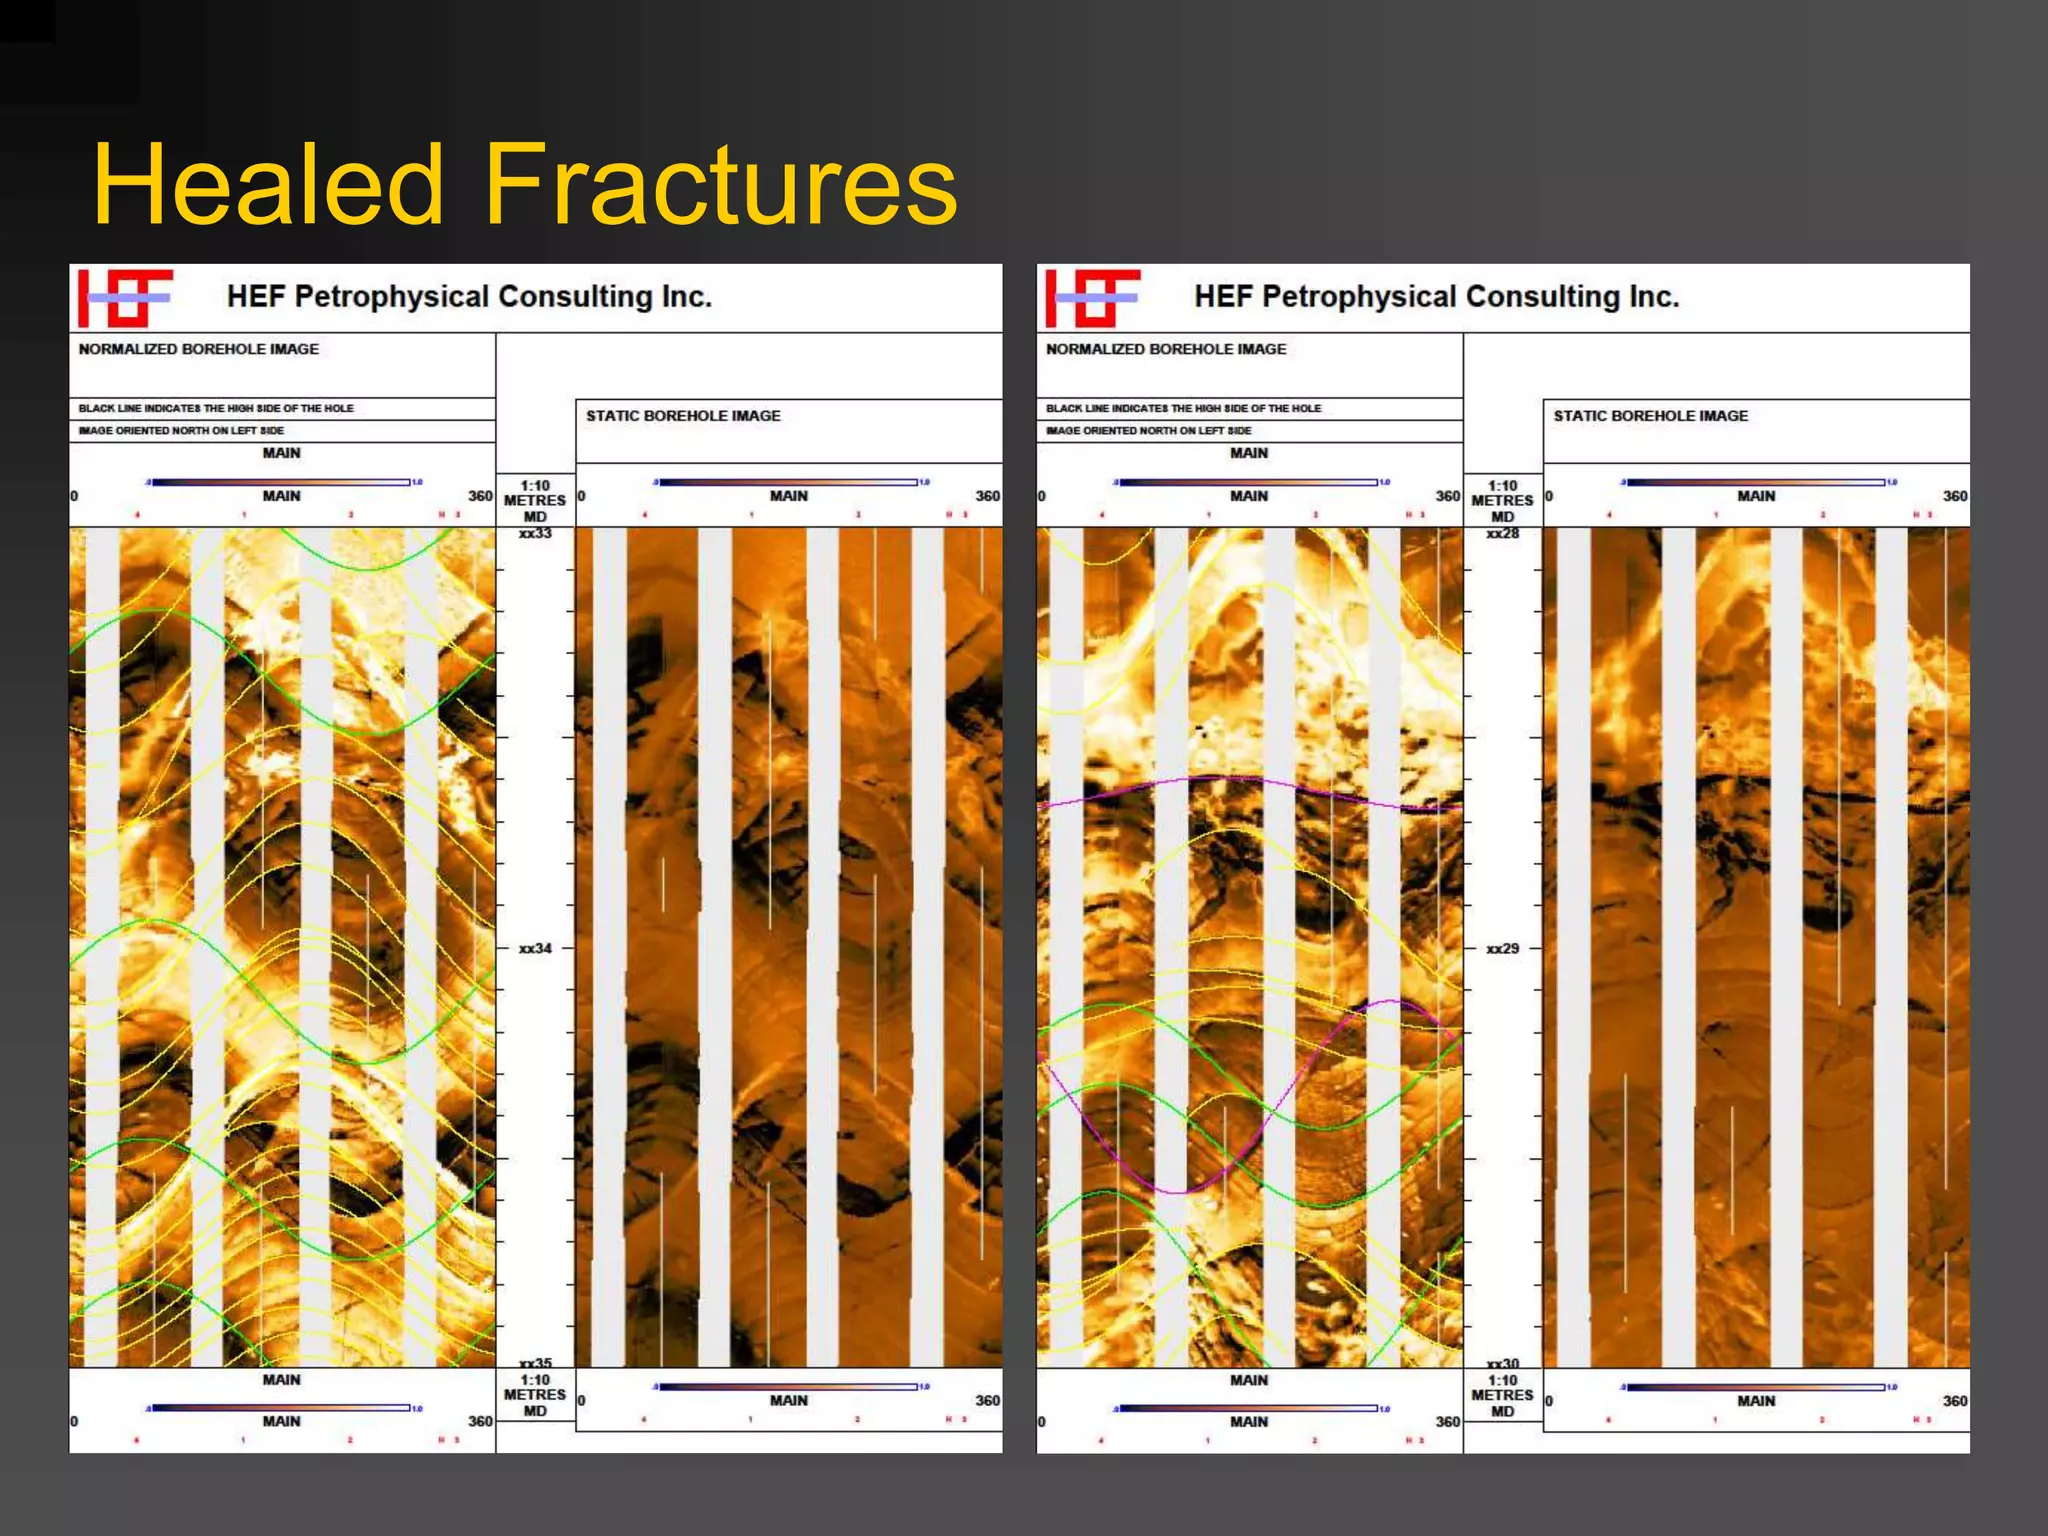
Mineralized fractures
mightbe filled with
calcite, quartz or
dolomite, all resistive
Often fracture traces are
invisible
See artificial halo inside
fracture plane
Healed Fractures
45.
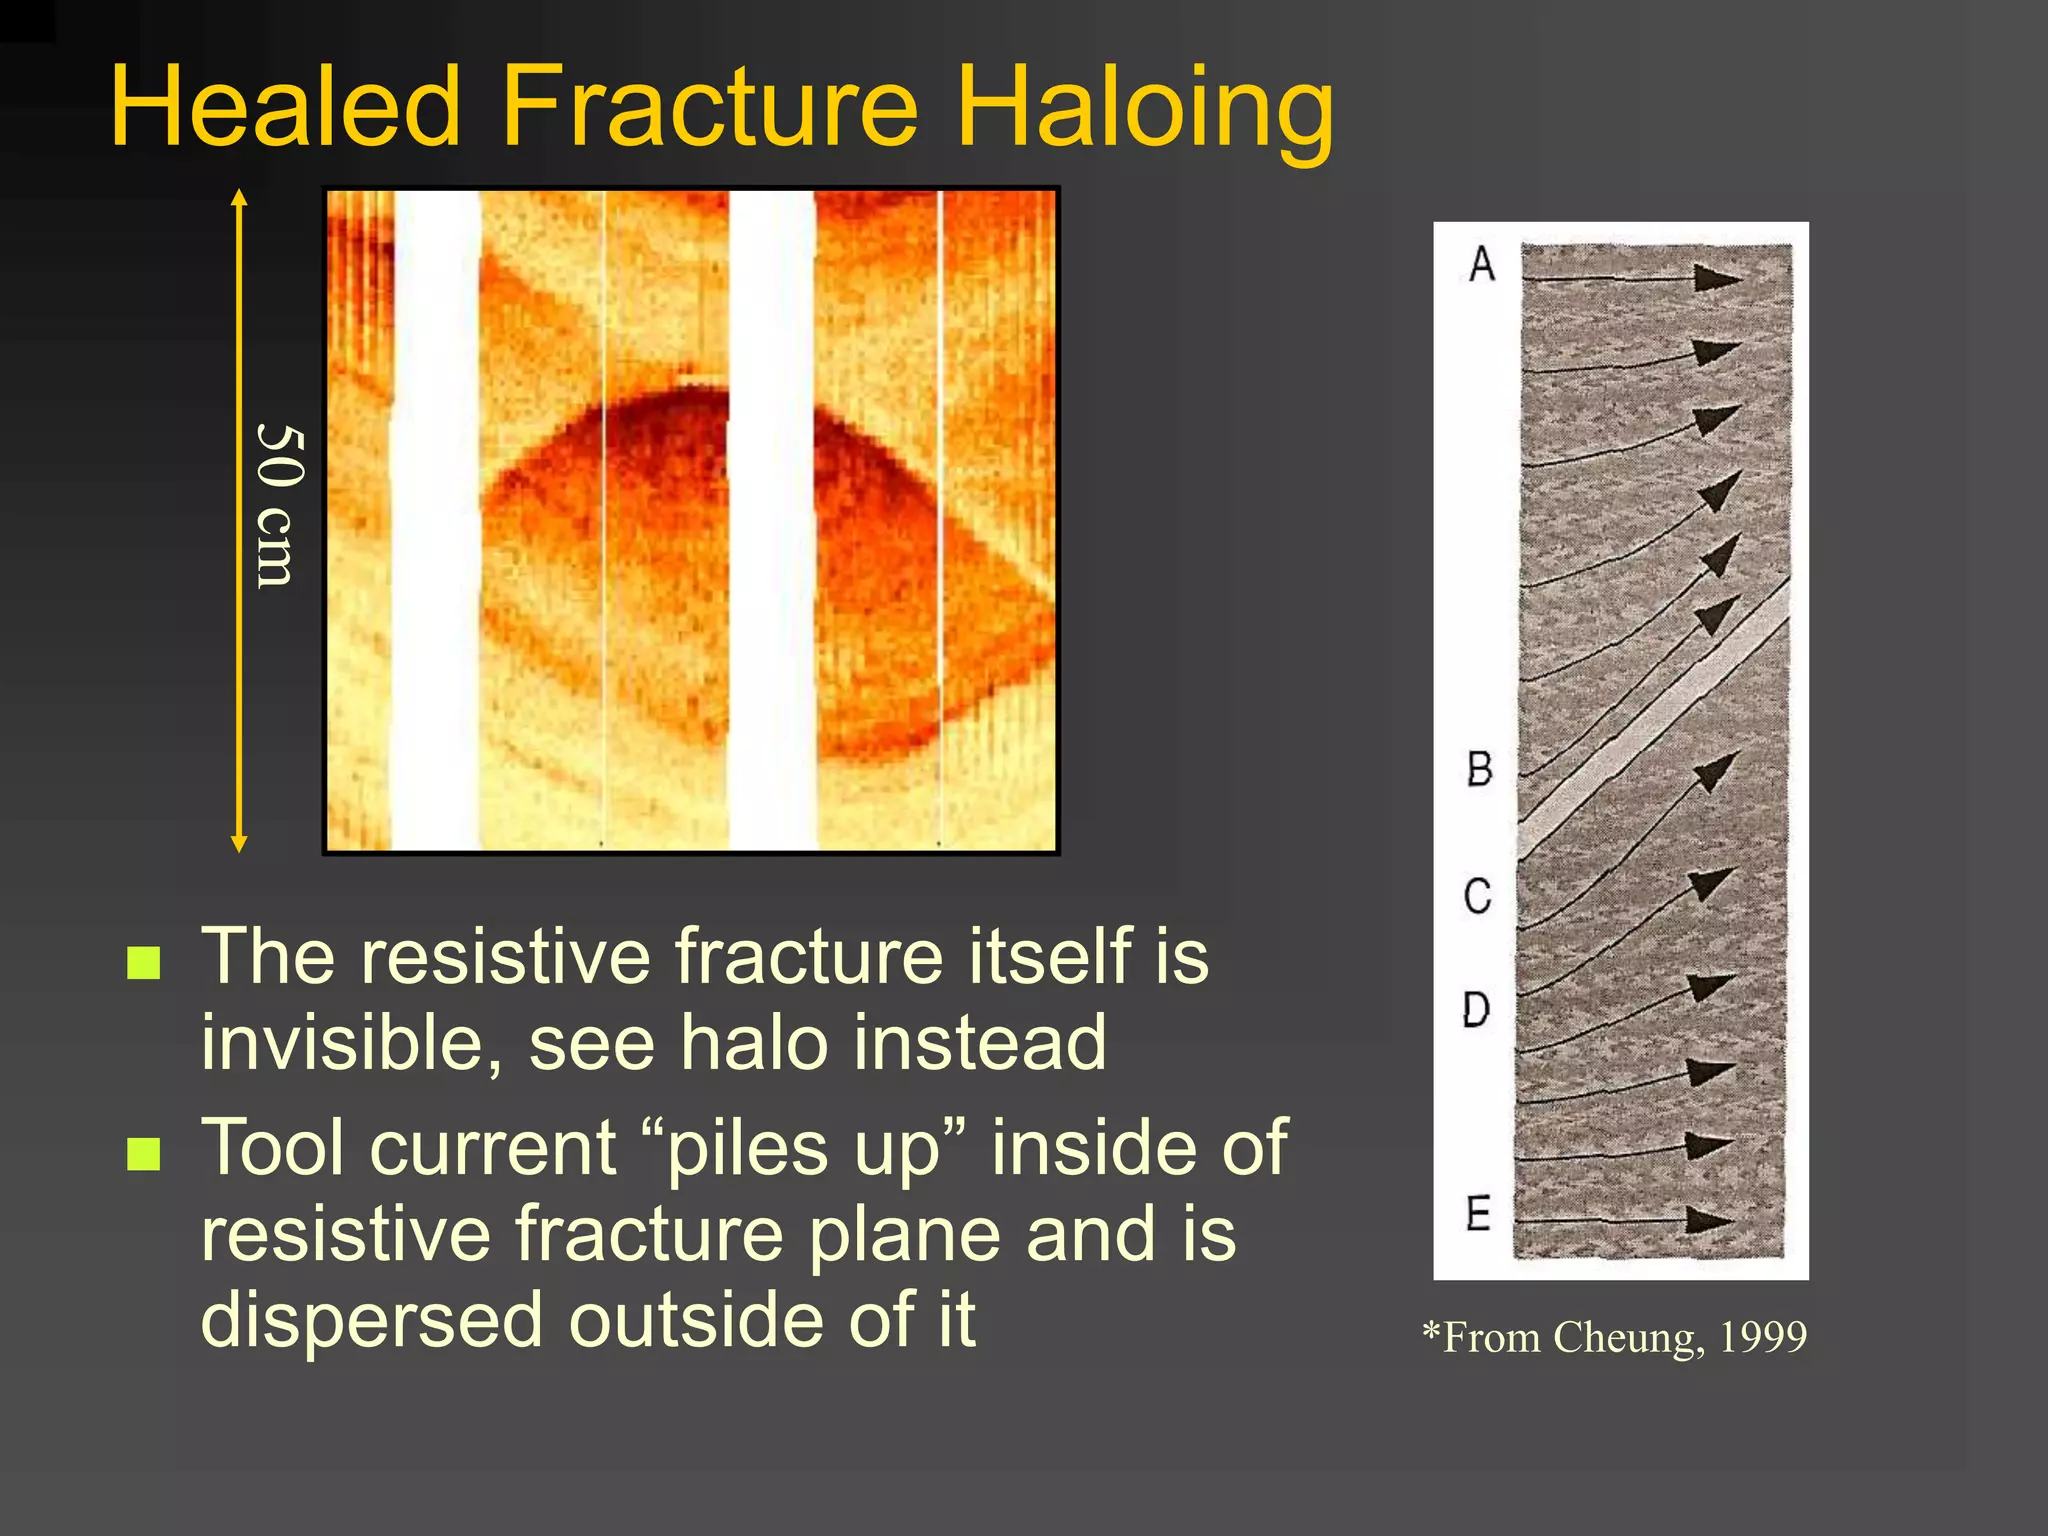
Healed Fracture Haloing
50cm
*FromCheung, 1999
The resistive fracture itself is
invisible, see halo instead
Tool current “piles up” inside of
resistive fracture plane and is
dispersed outside of it
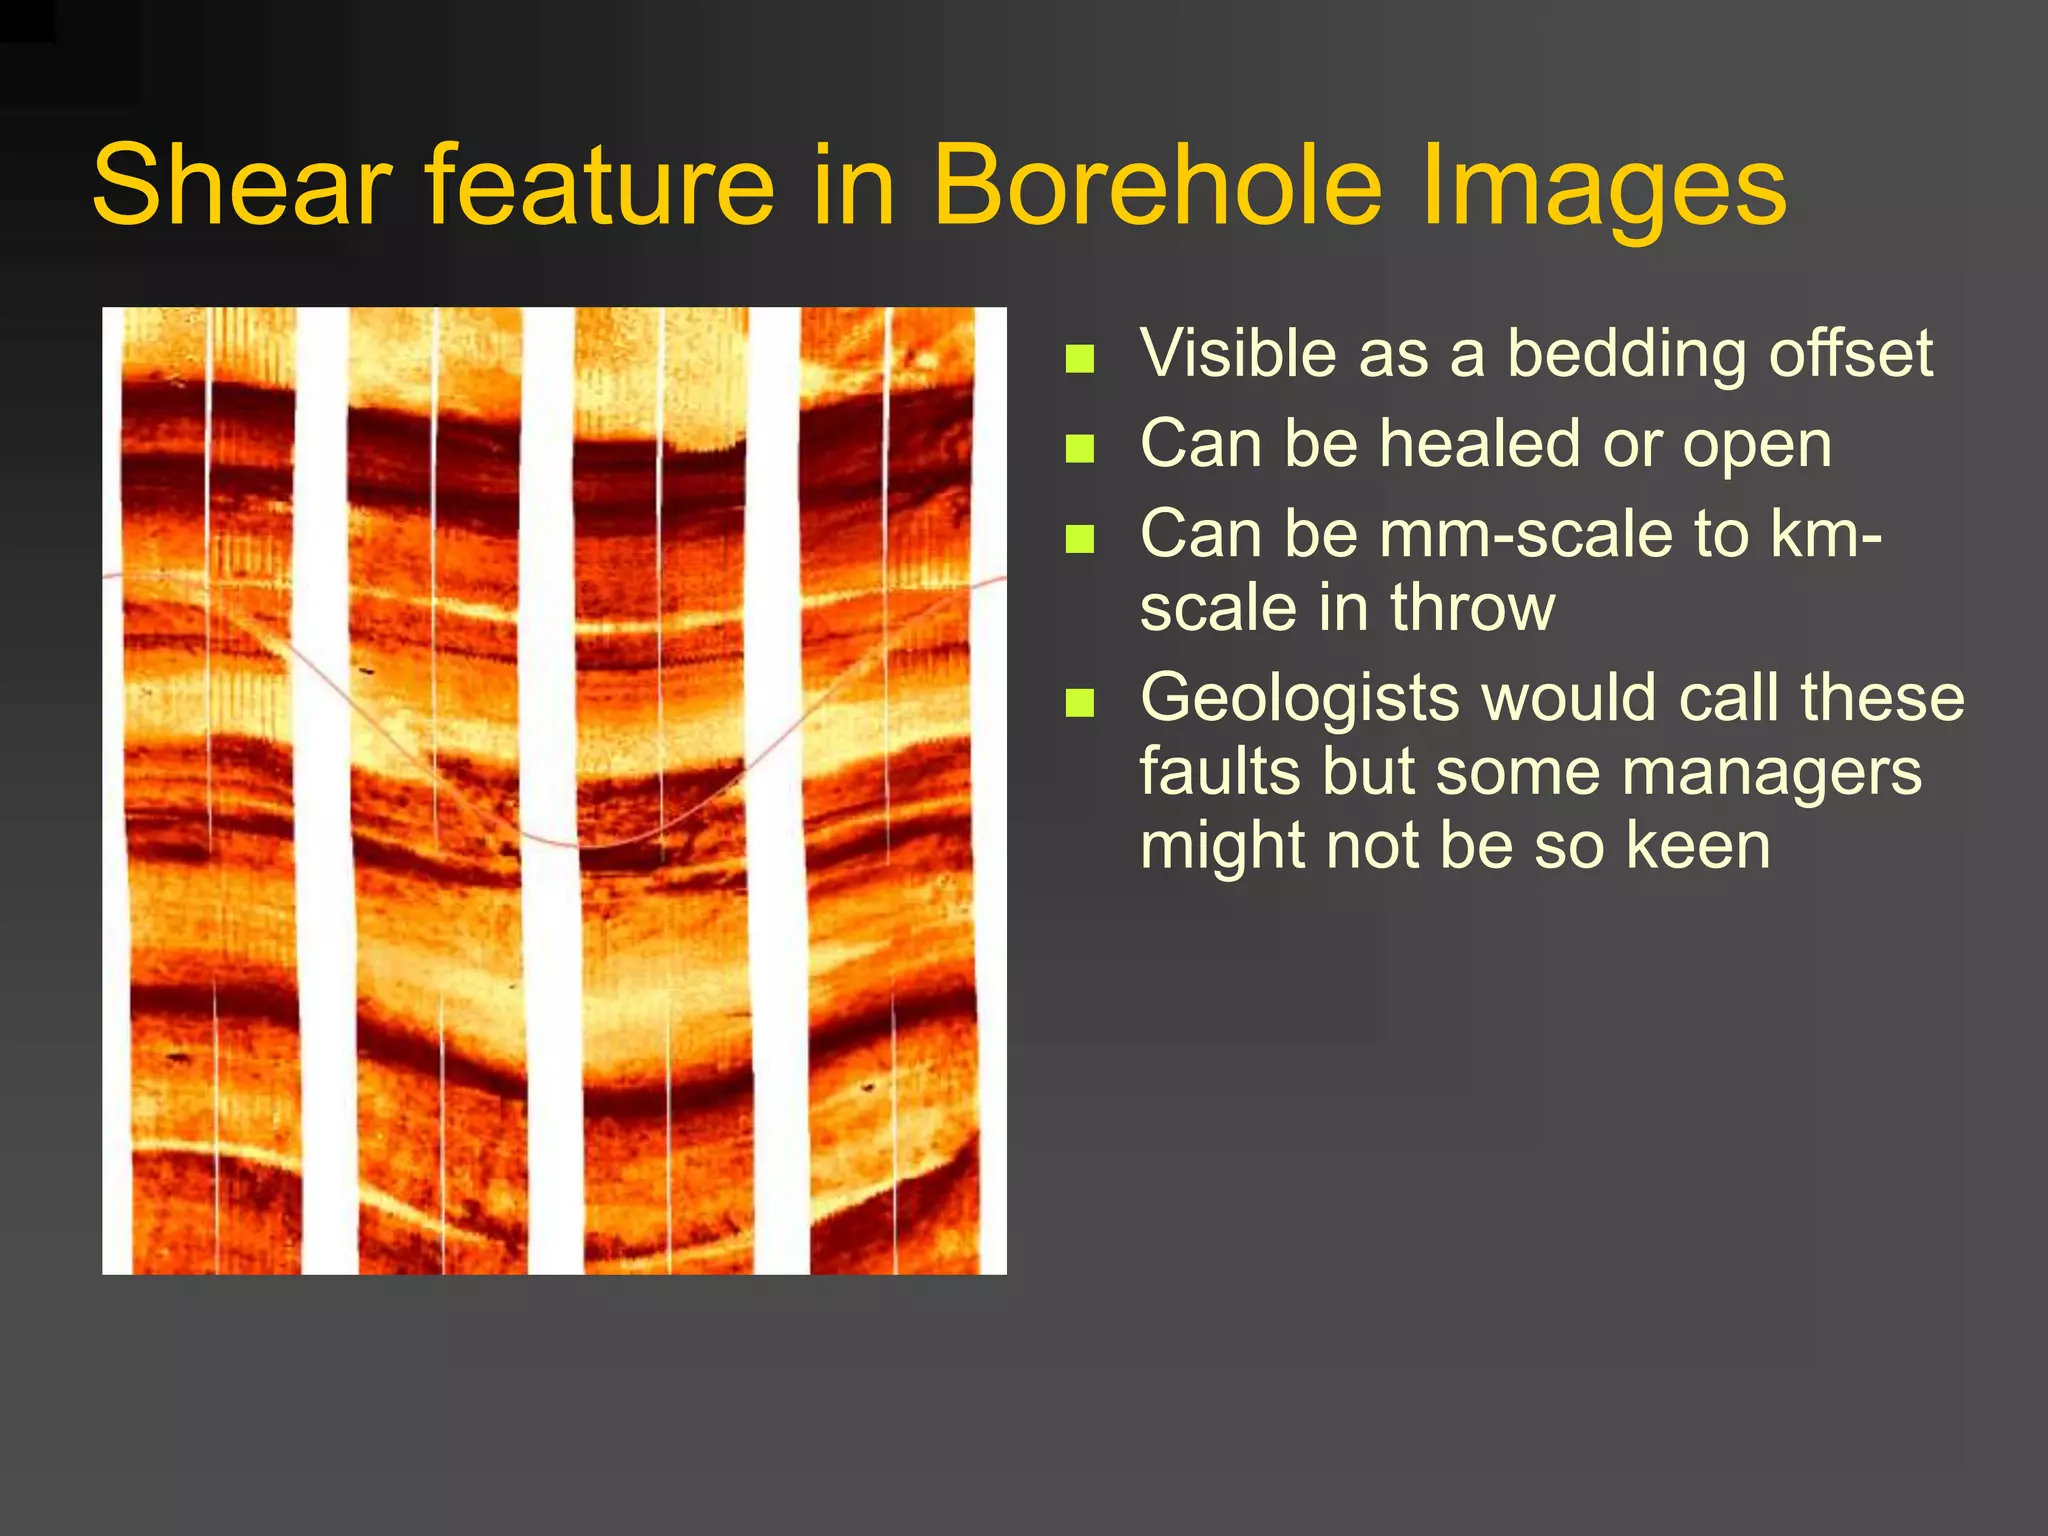
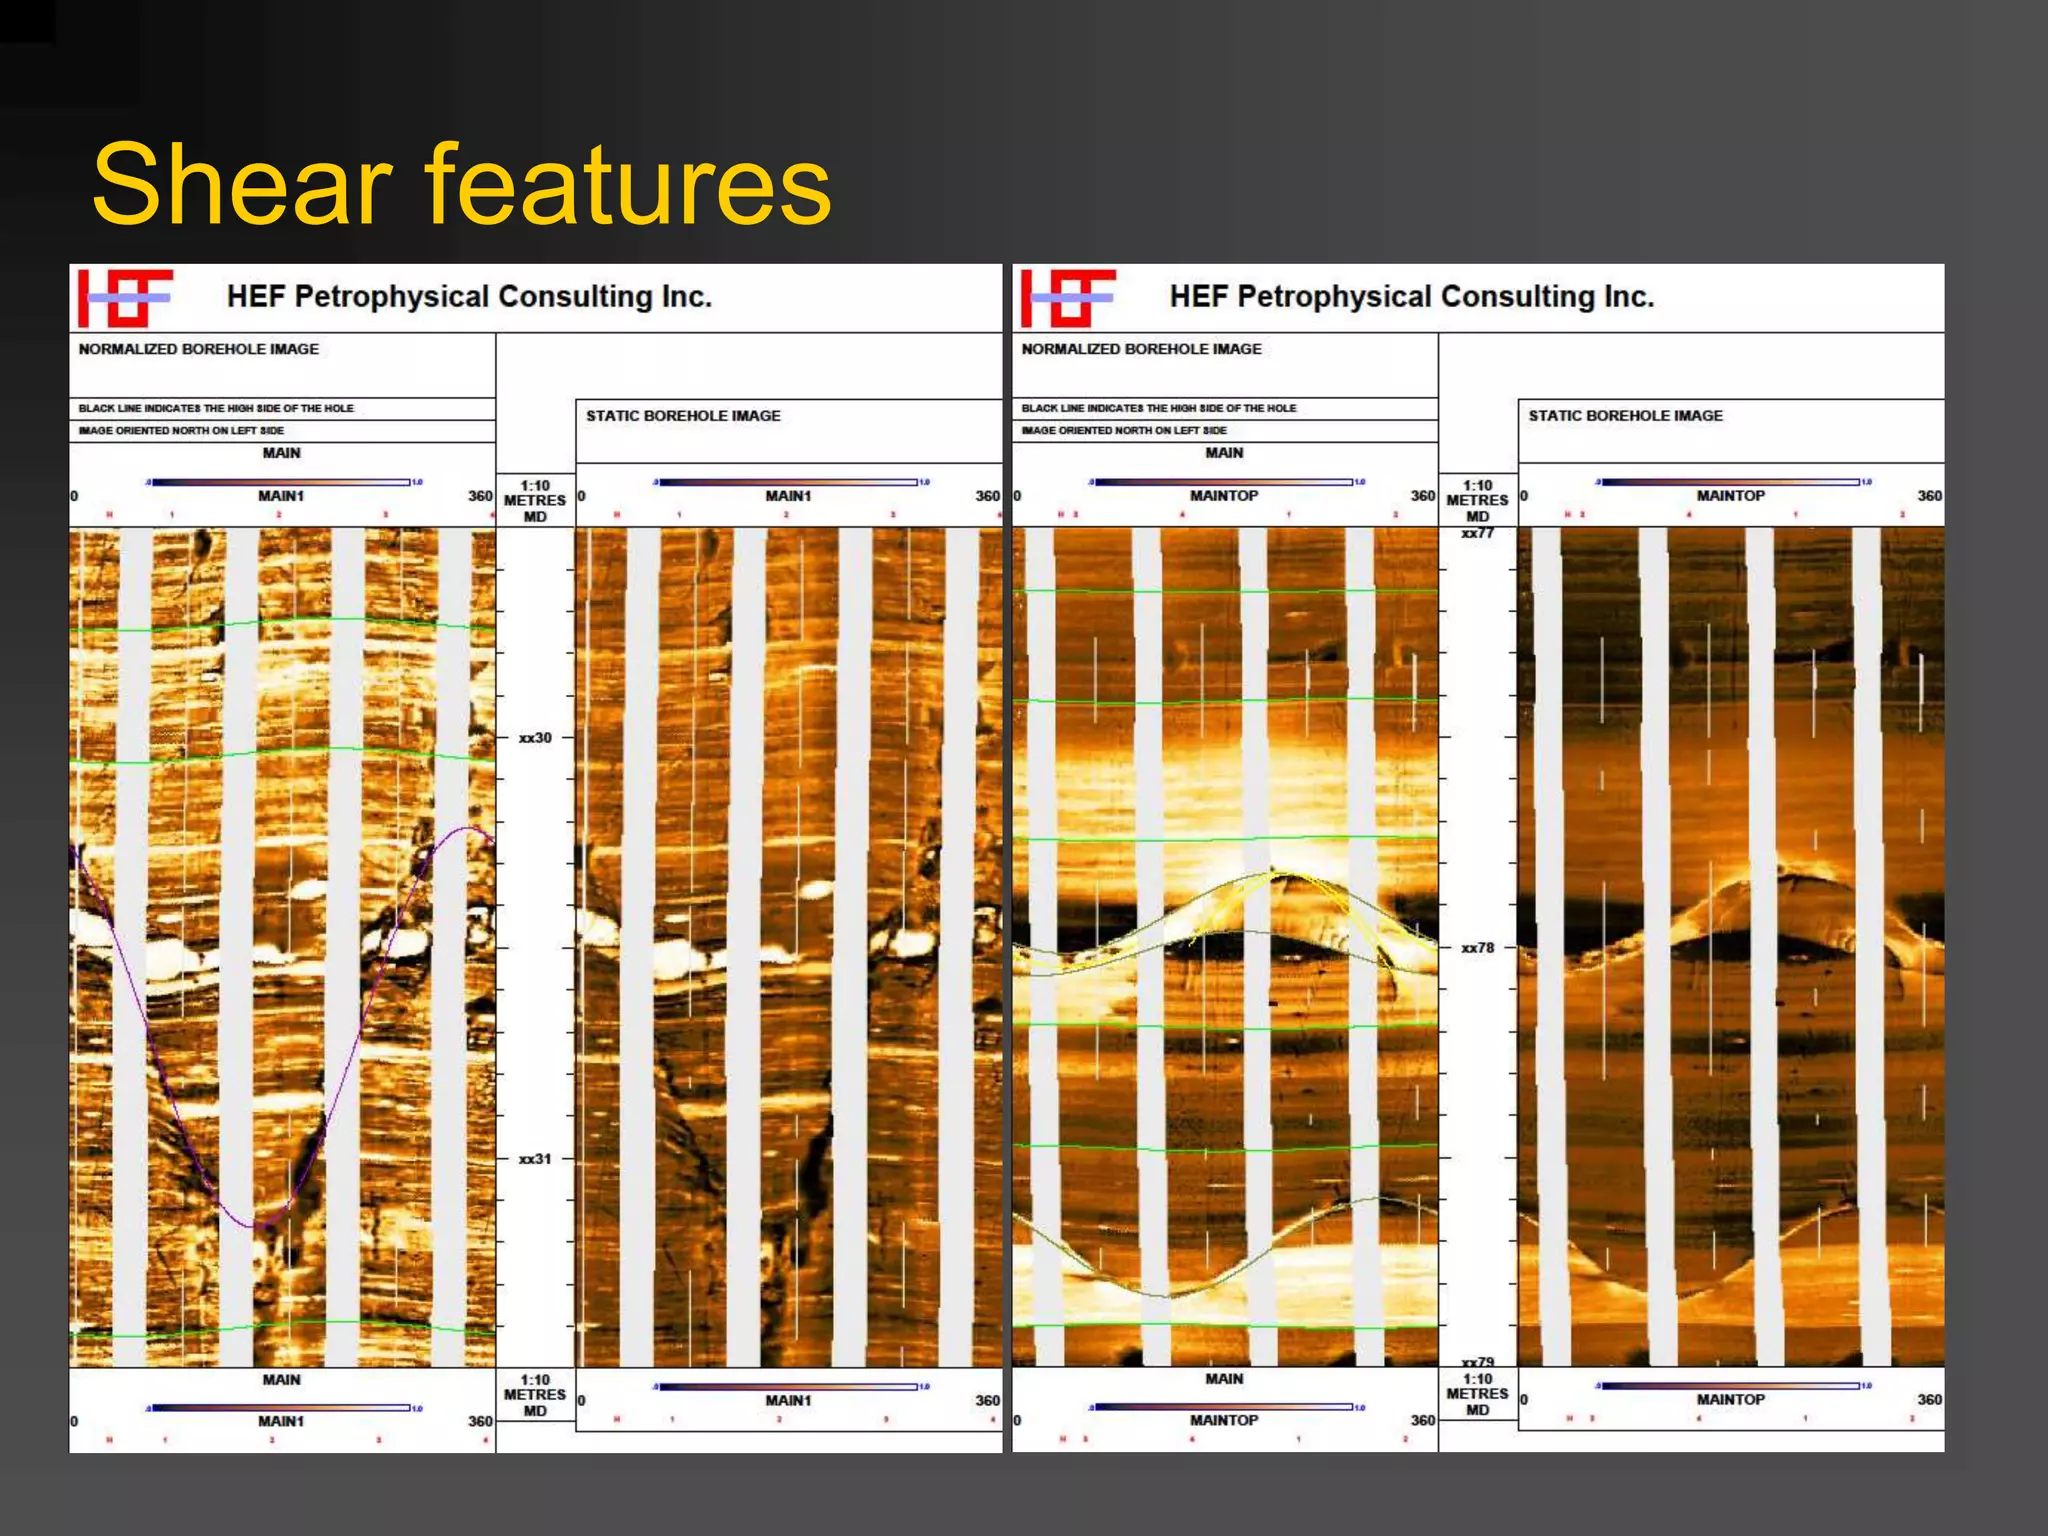
Shear feature inBorehole Images
Visible as a bedding offset
Can be healed or open
Can be mm-scale to km-
scale in throw
Geologists would call these
faults but some managers
might not be so keen
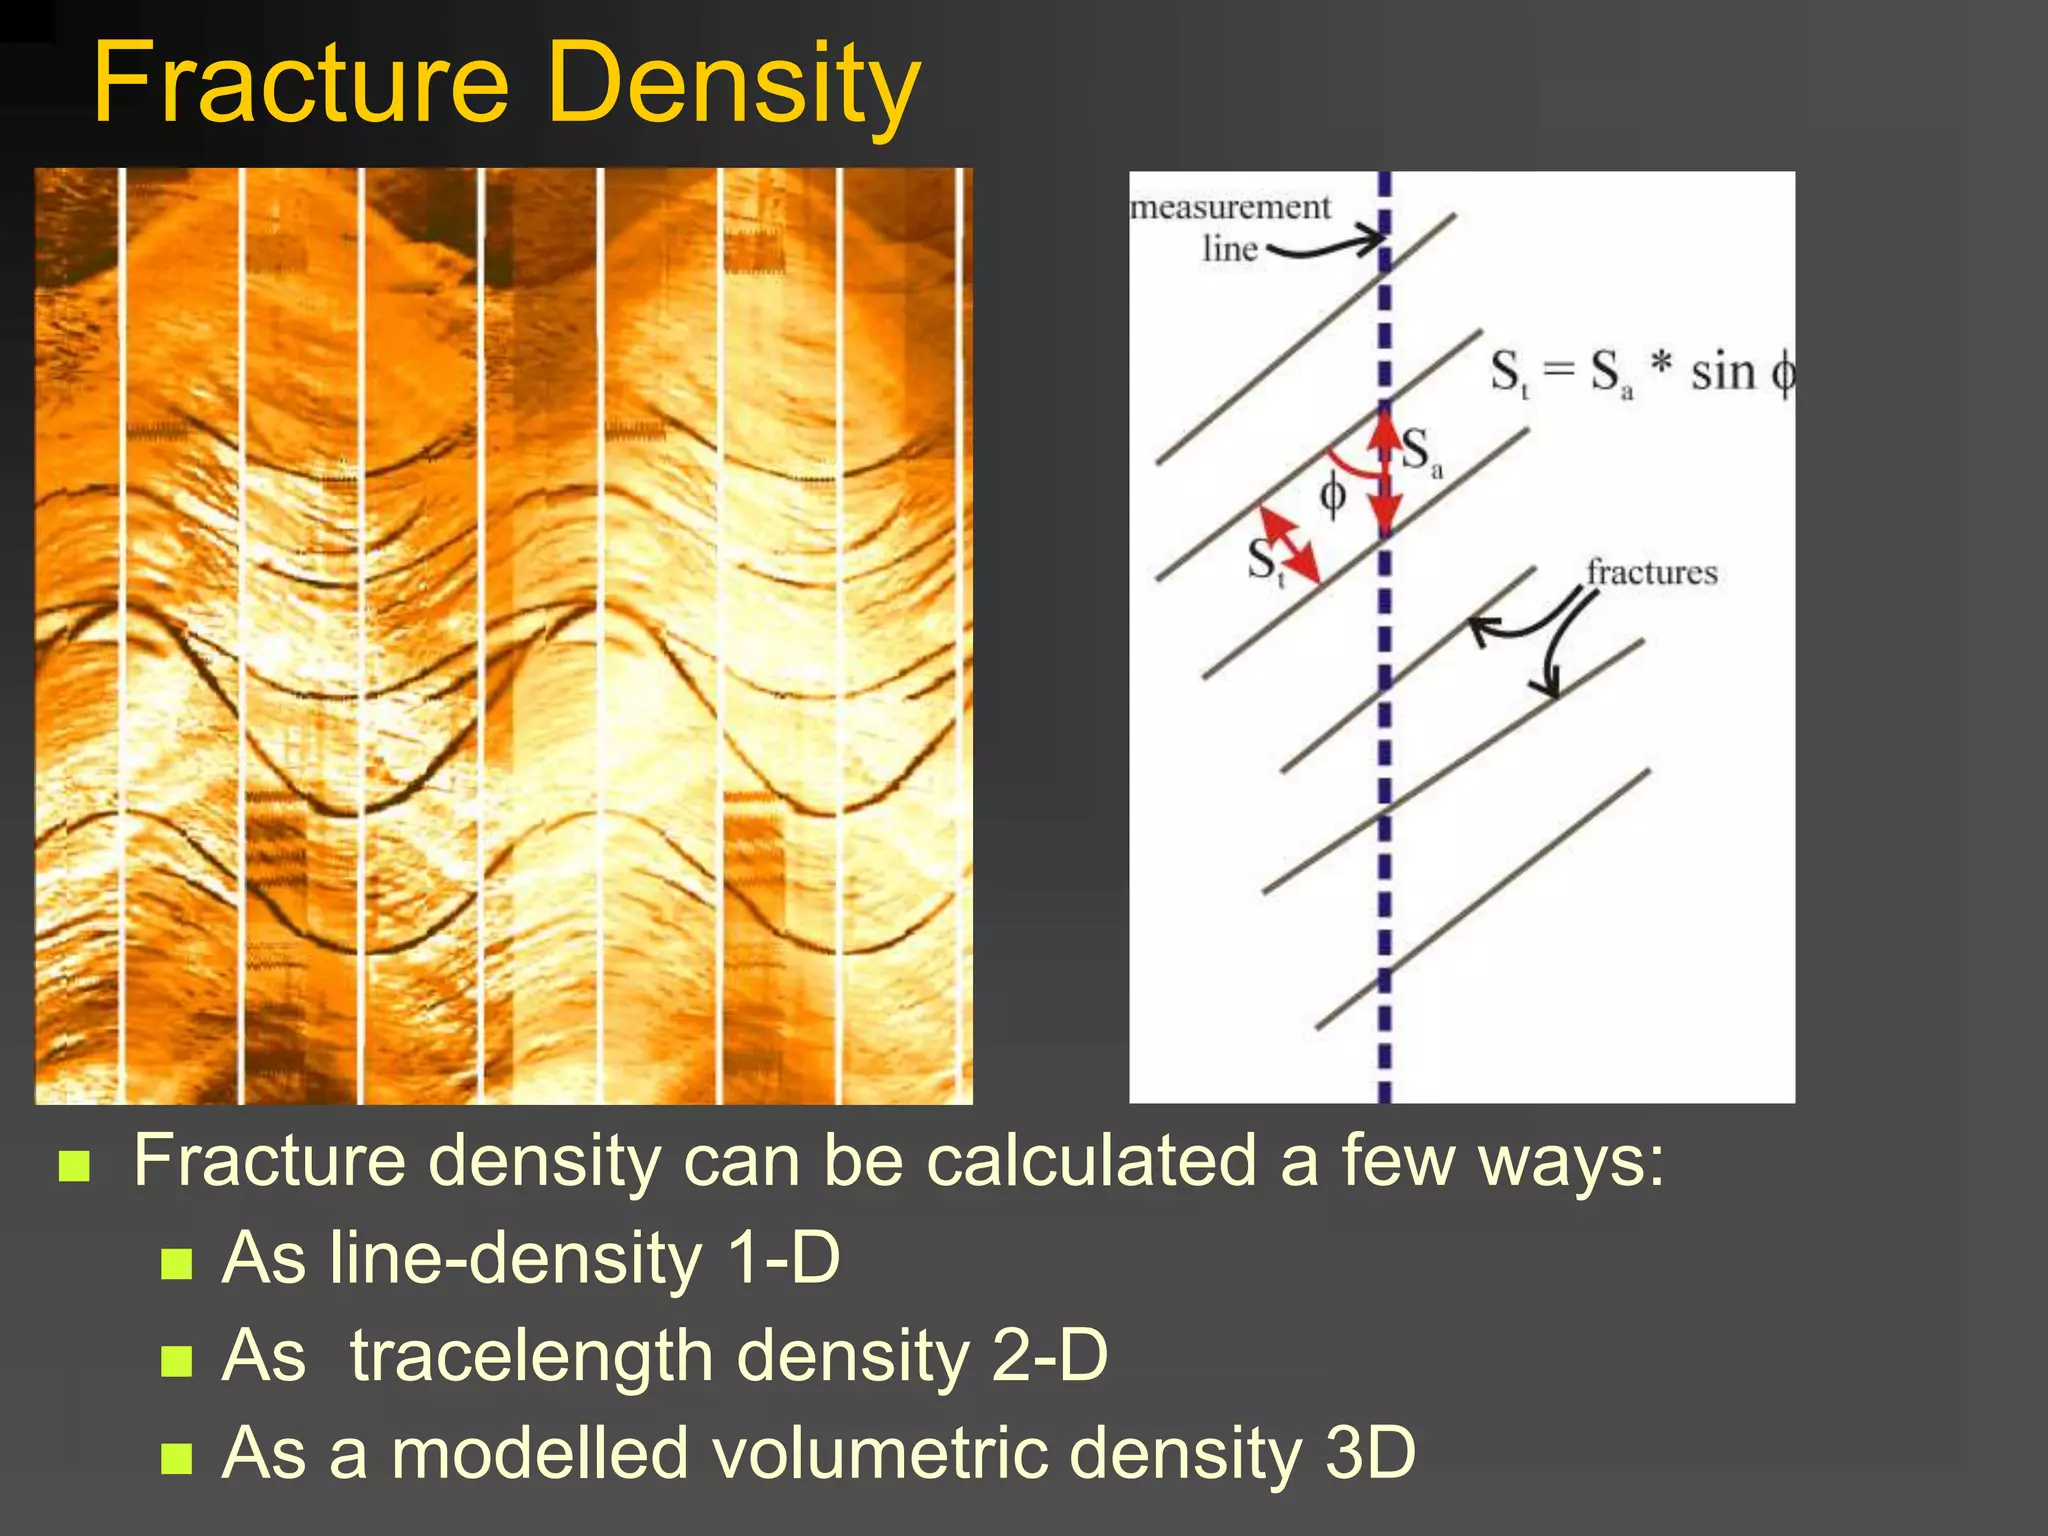
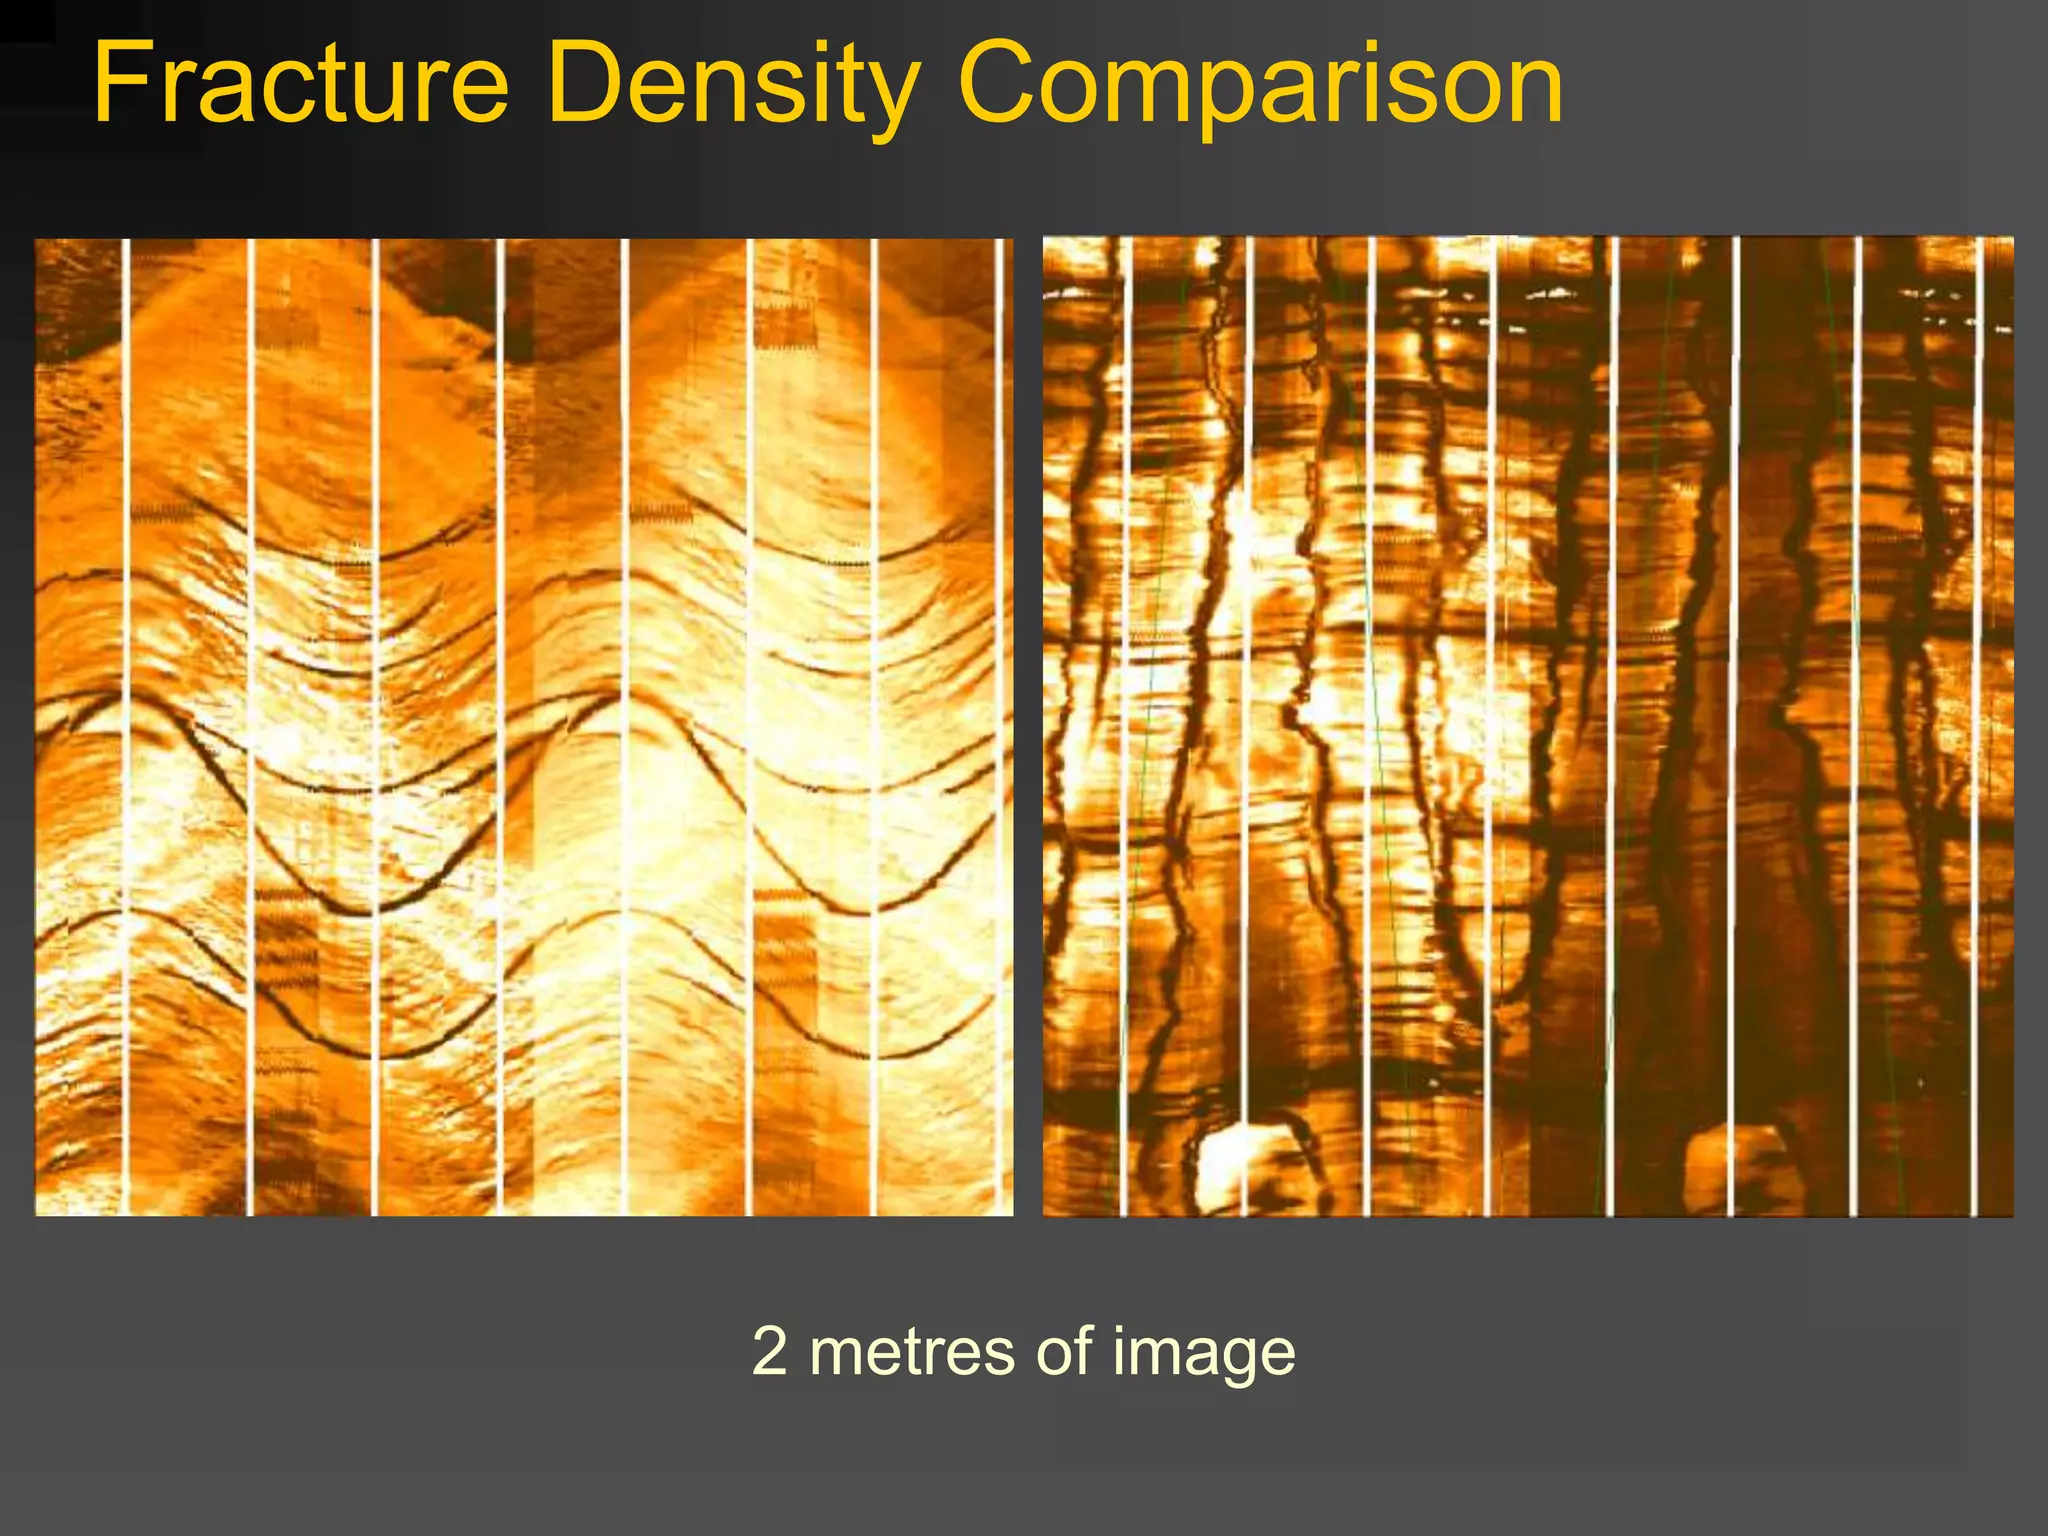
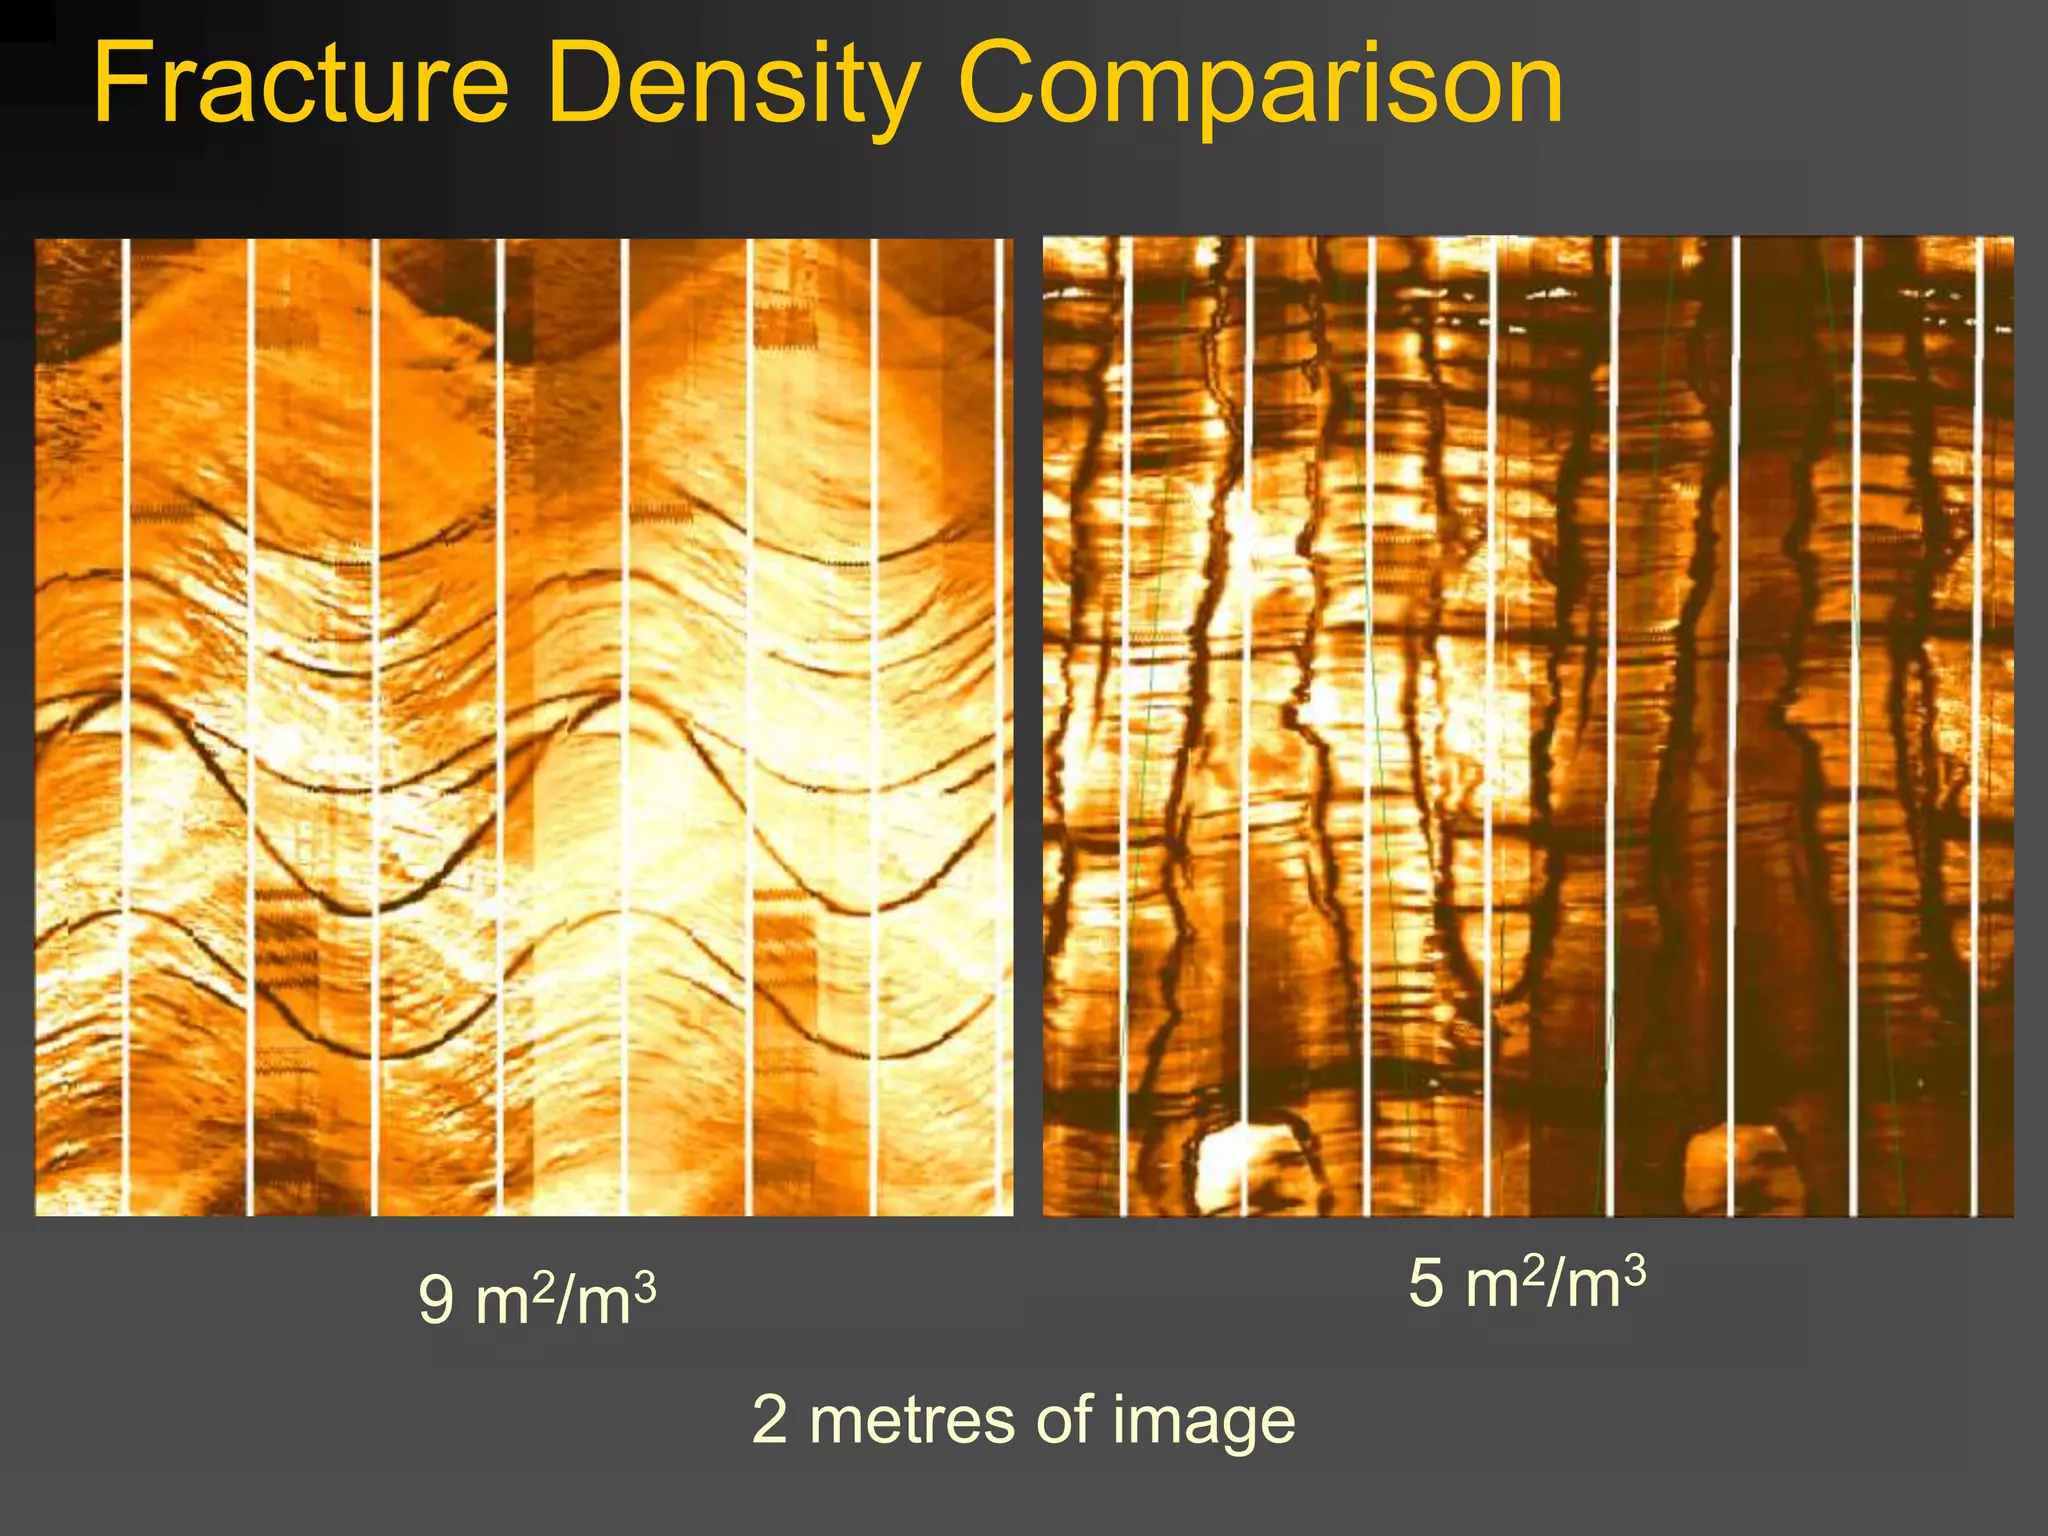
Fracture Density
Fracturedensity can be calculated a few ways:
As line-density 1-D
As tracelength density 2-D
As a modelled volumetric density 3D
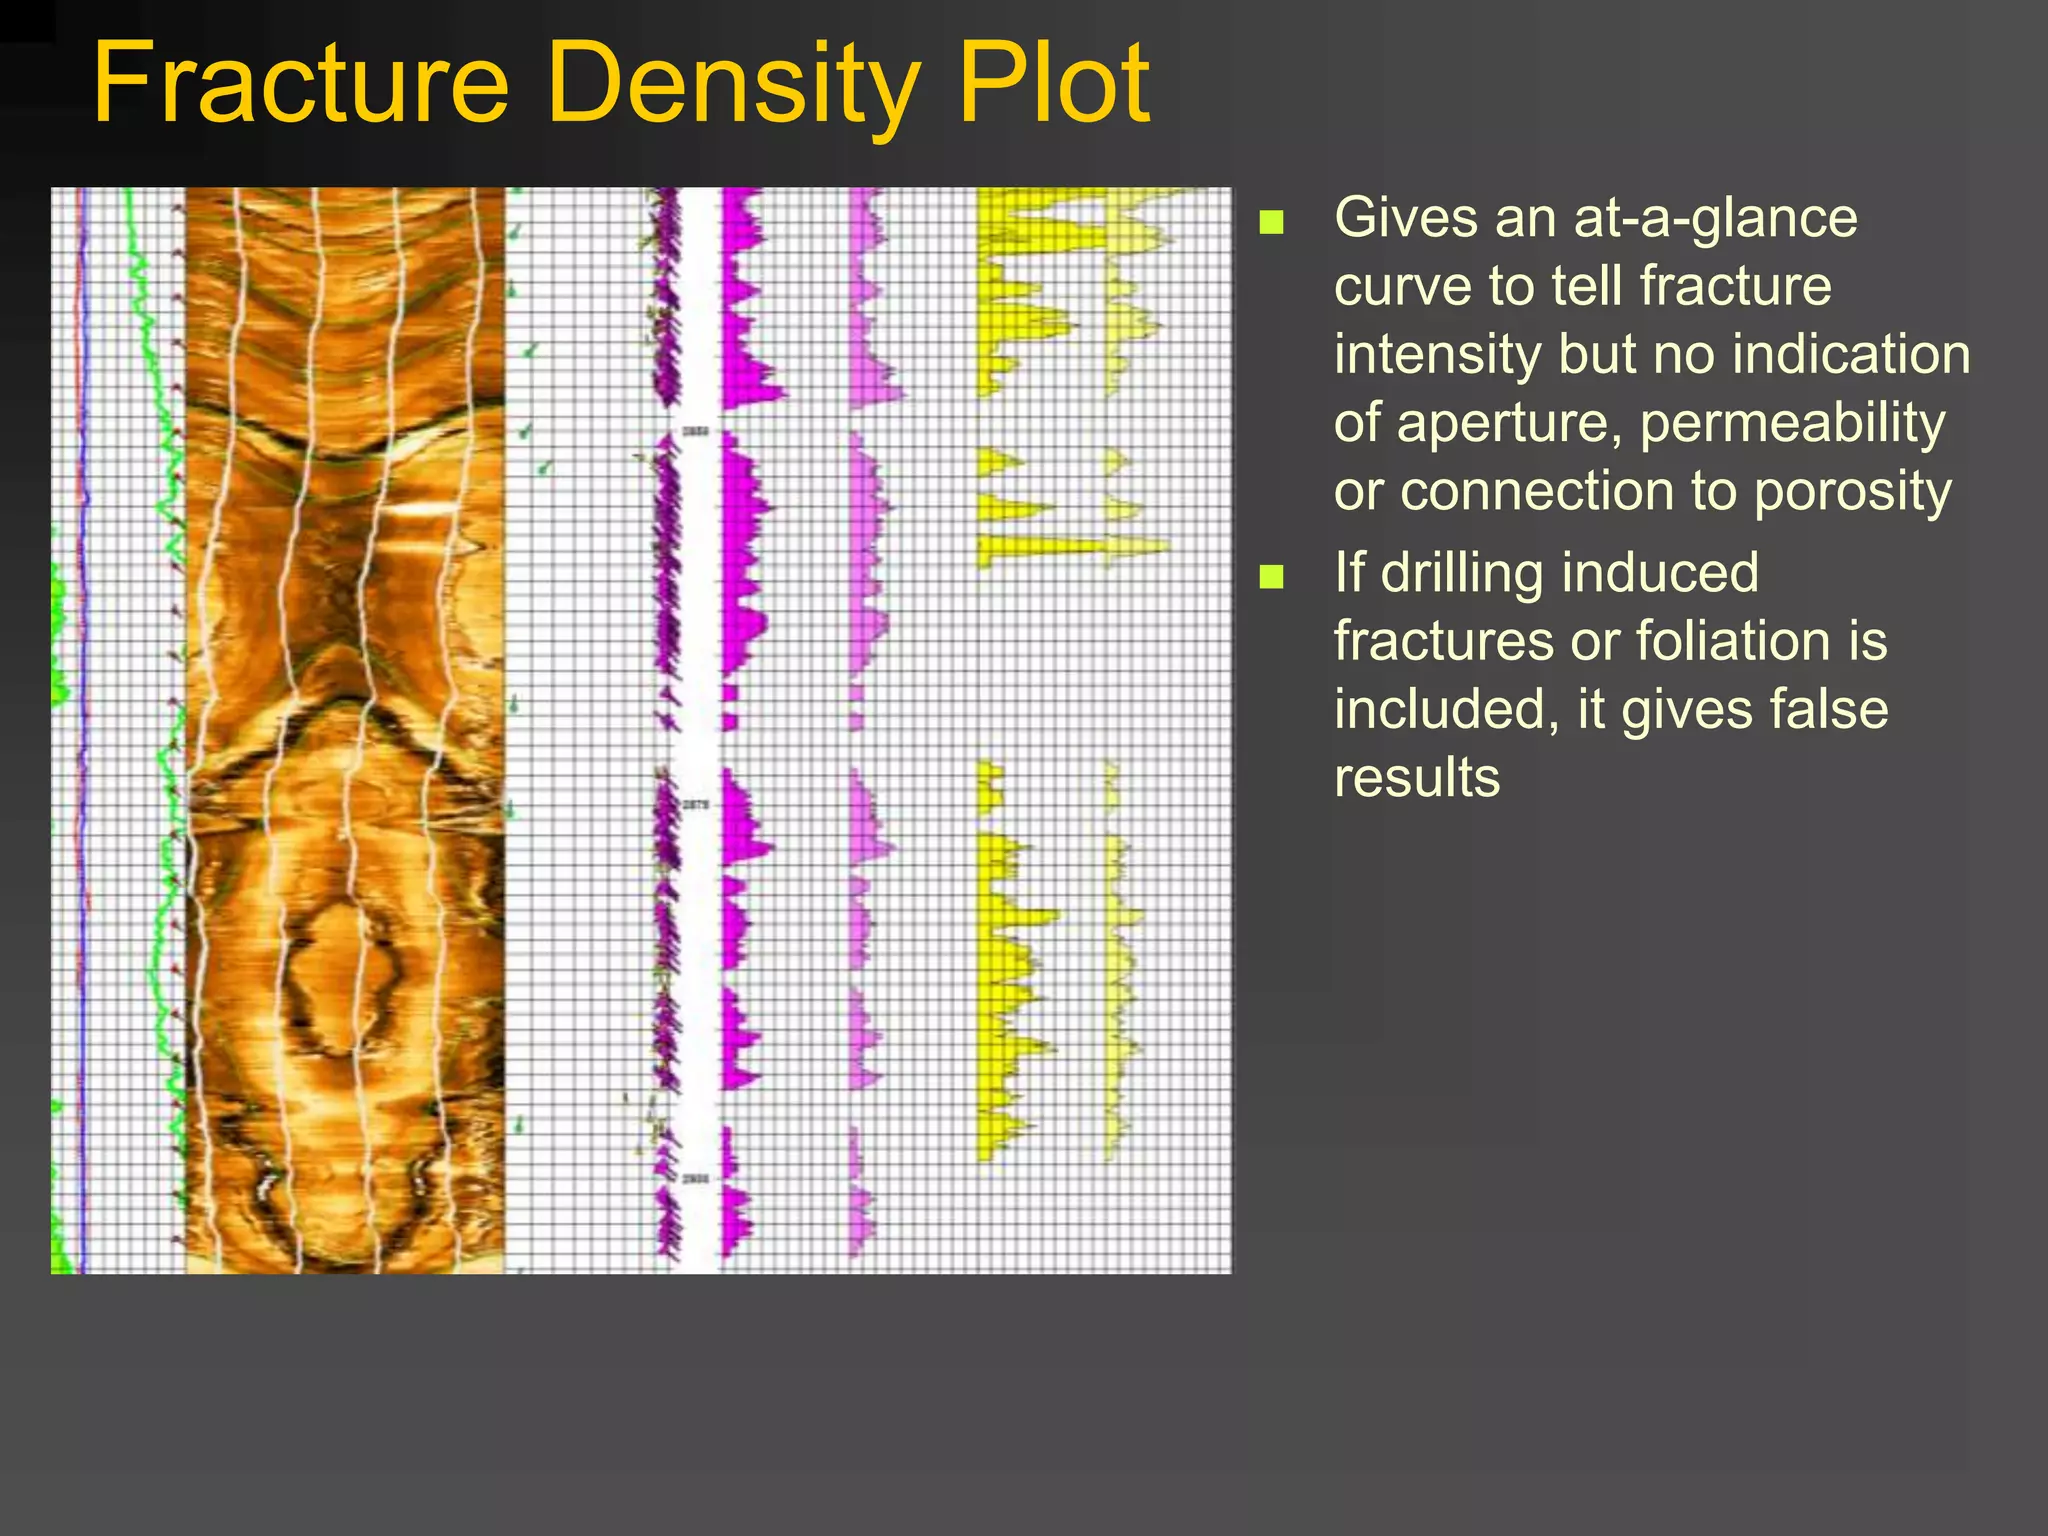
Fracture Density Plot
Gives an at-a-glance
curve to tell fracture
intensity but no indication
of aperture, permeability
or connection to porosity
If drilling induced
fractures or foliation is
included, it gives false
results
54.
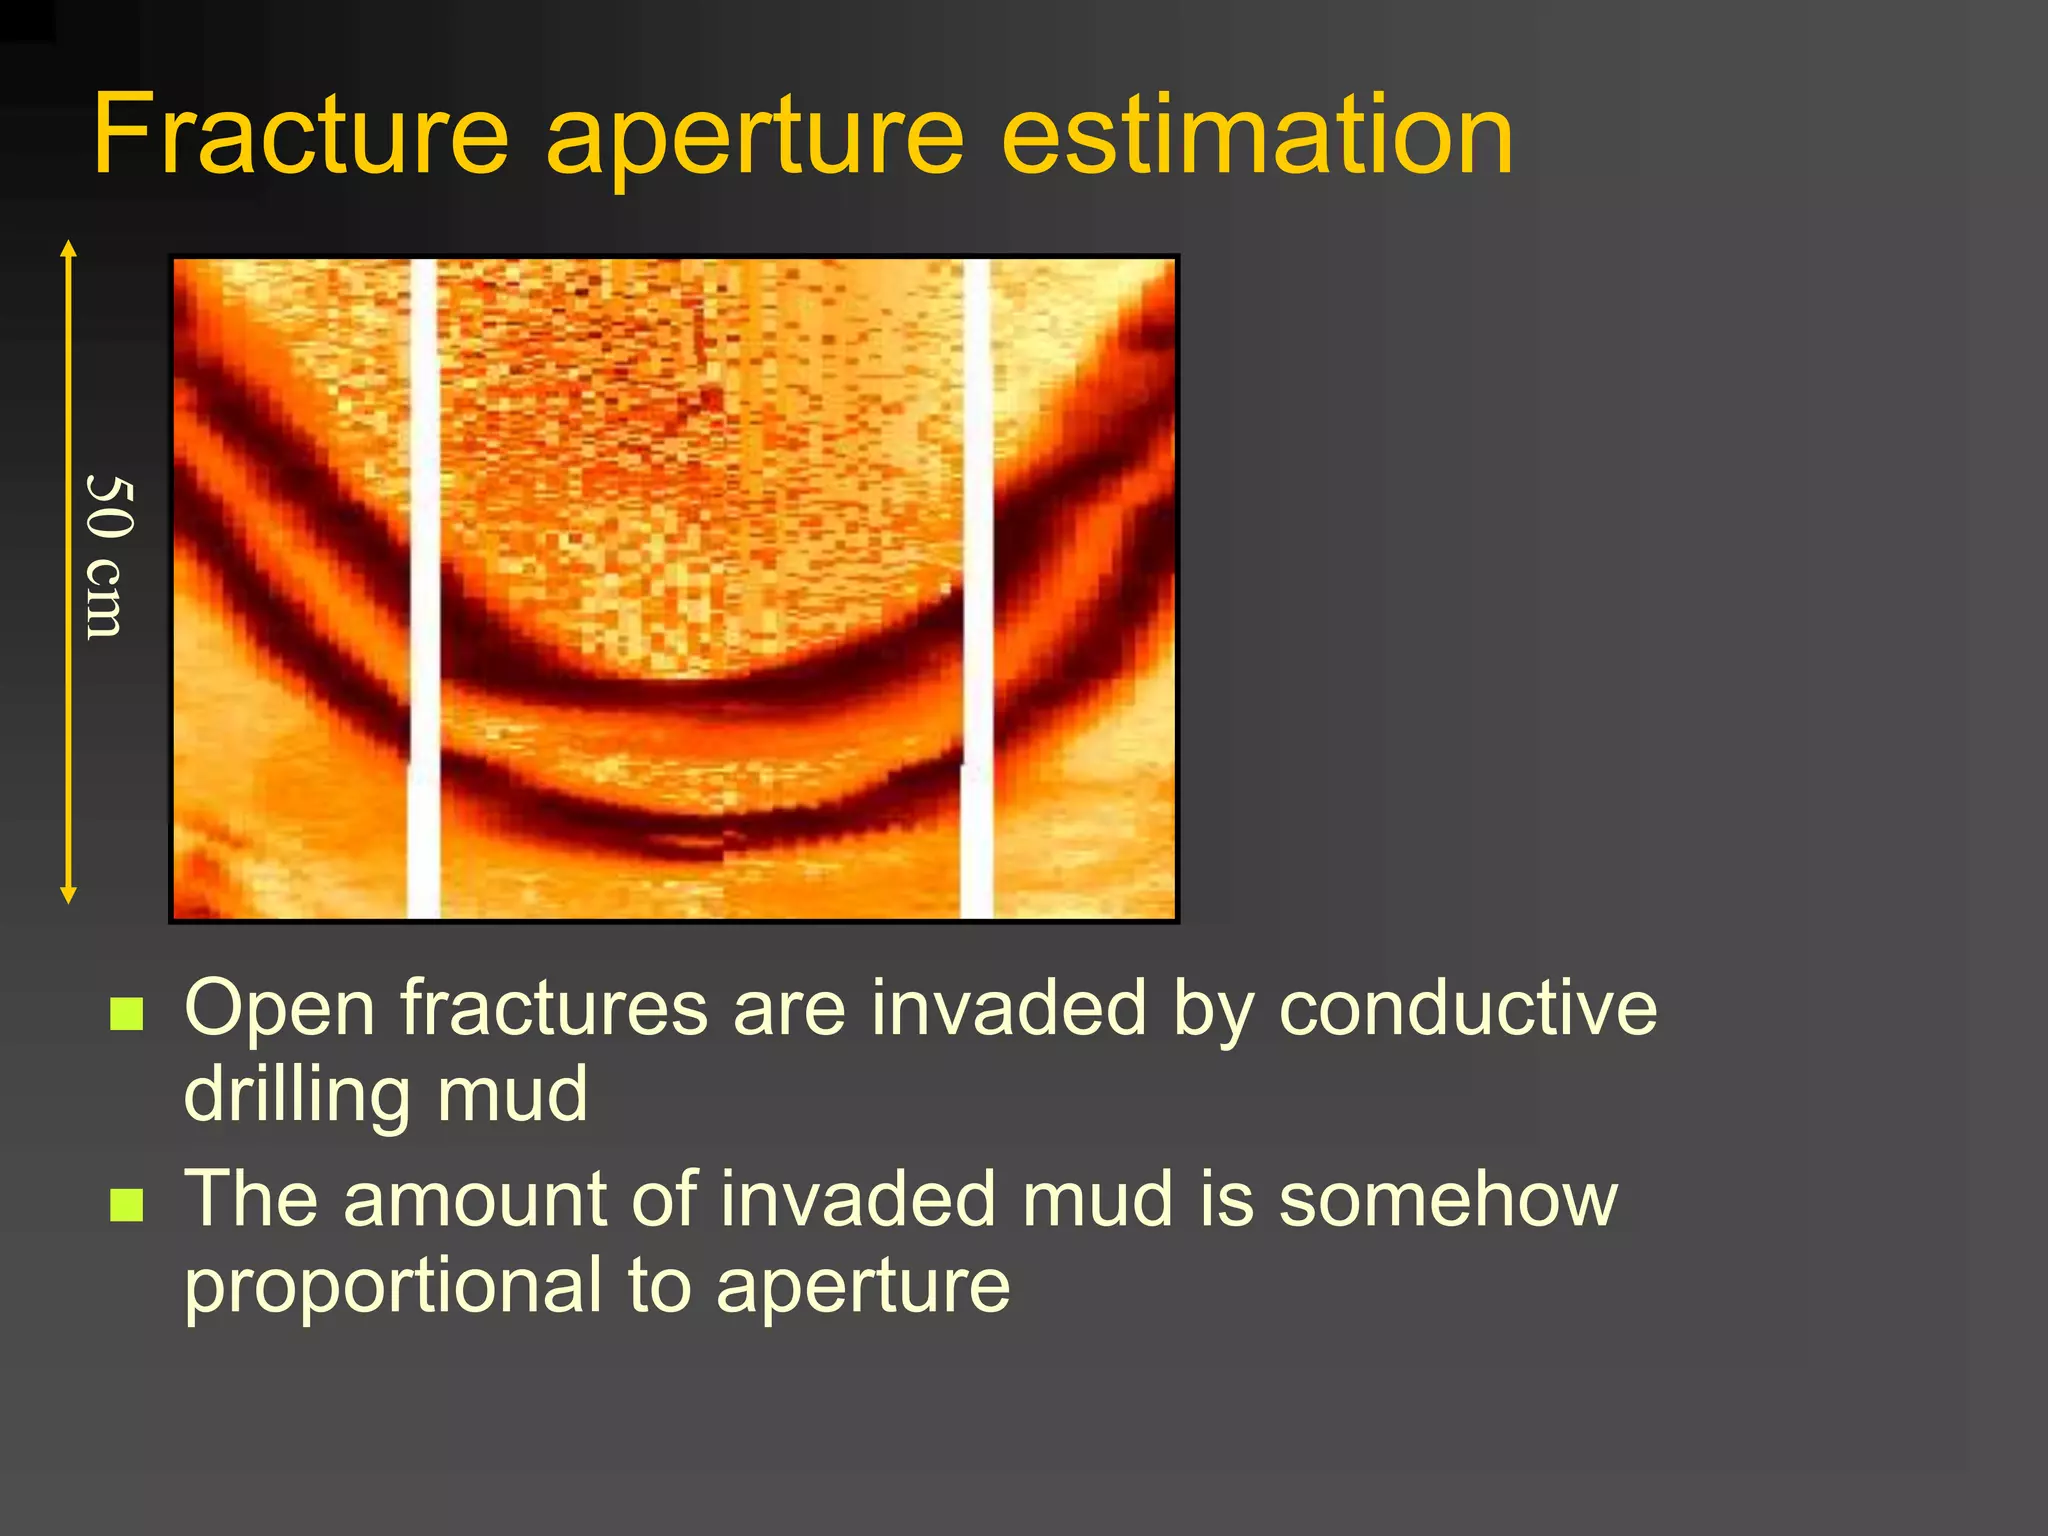
Fracture aperture estimation
50cm
Open fractures are invaded by conductive
drilling mud
The amount of invaded mud is somehow
proportional to aperture
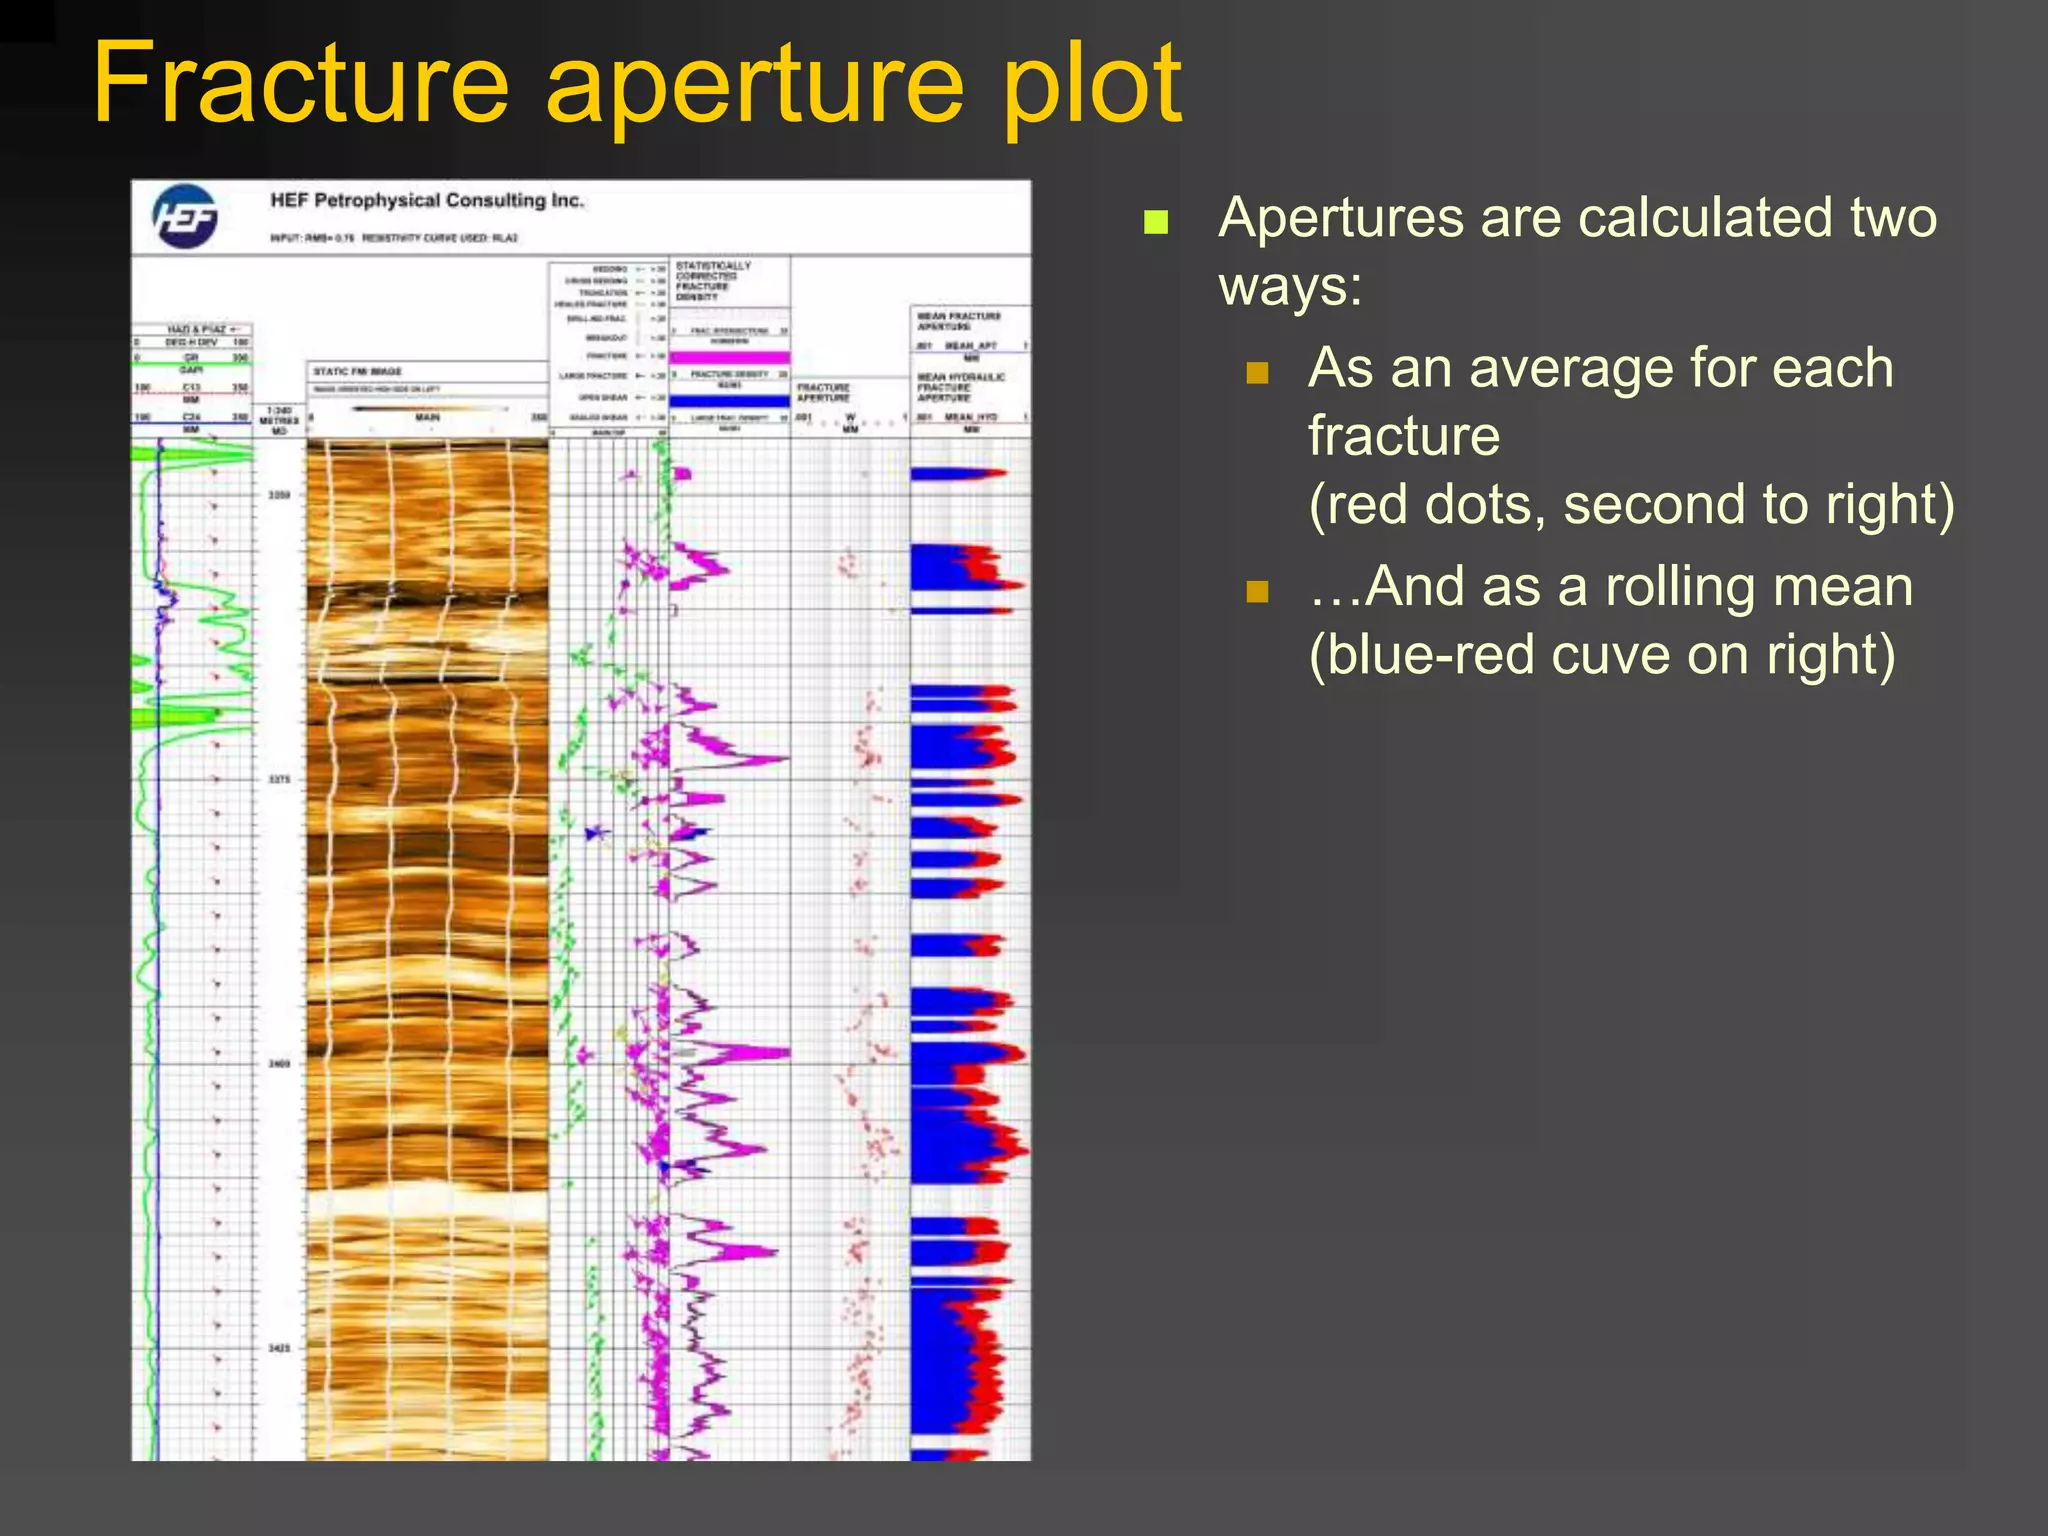
Fracture aperture plot
Apertures are calculated two
ways:
As an average for each
fracture
(red dots, second to right)
…And as a rolling mean
(blue-red cuve on right)
57.
Fracture Interpretation products
Fracture types on tadpole, image and stereonet
plots and in LAS / ASCII
Fracture density plot and LAS file
Fracture aperture plot and LAS file
Fracture statistics like trace length, minimum
radius, height and so on in LAS file
58.
Outline
Basics ofborehole image interpretation
Bedding and structural dip analysis
Natural fractures
Stress features
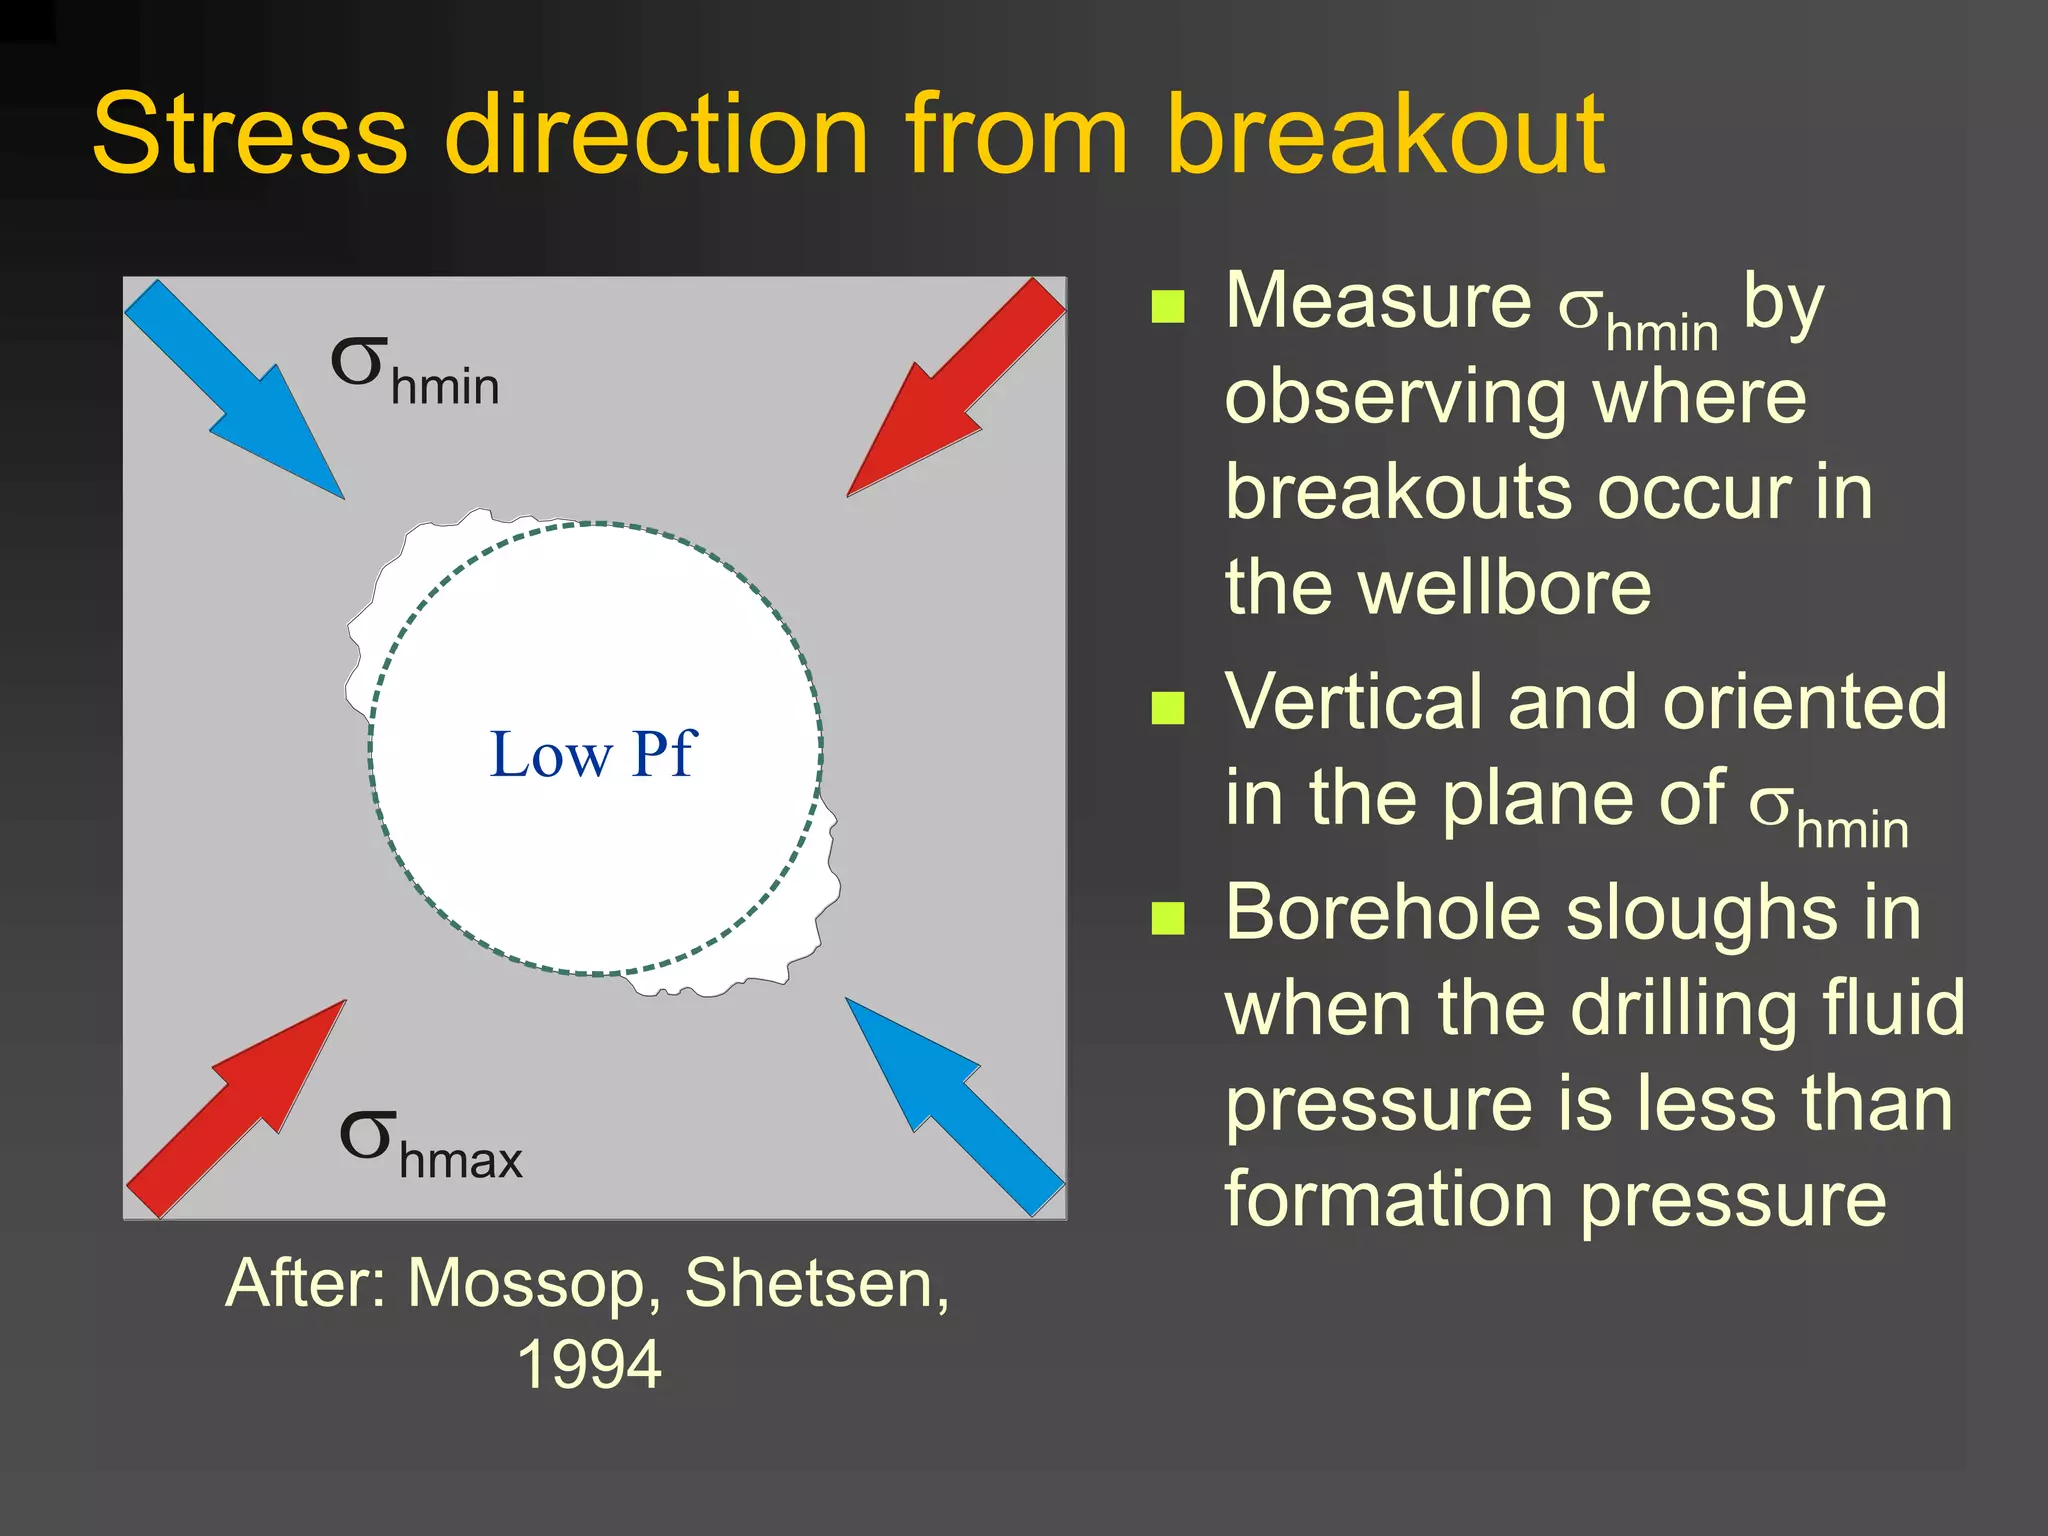
Stress direction frombreakout
Measure shmin by
observing where
breakouts occur in
the wellbore
Vertical and oriented
in the plane of shmin
Borehole sloughs in
when the drilling fluid
pressure is less than
formation pressure
shmax
shmin
After: Mossop, Shetsen,
1994
Low Pf
61.
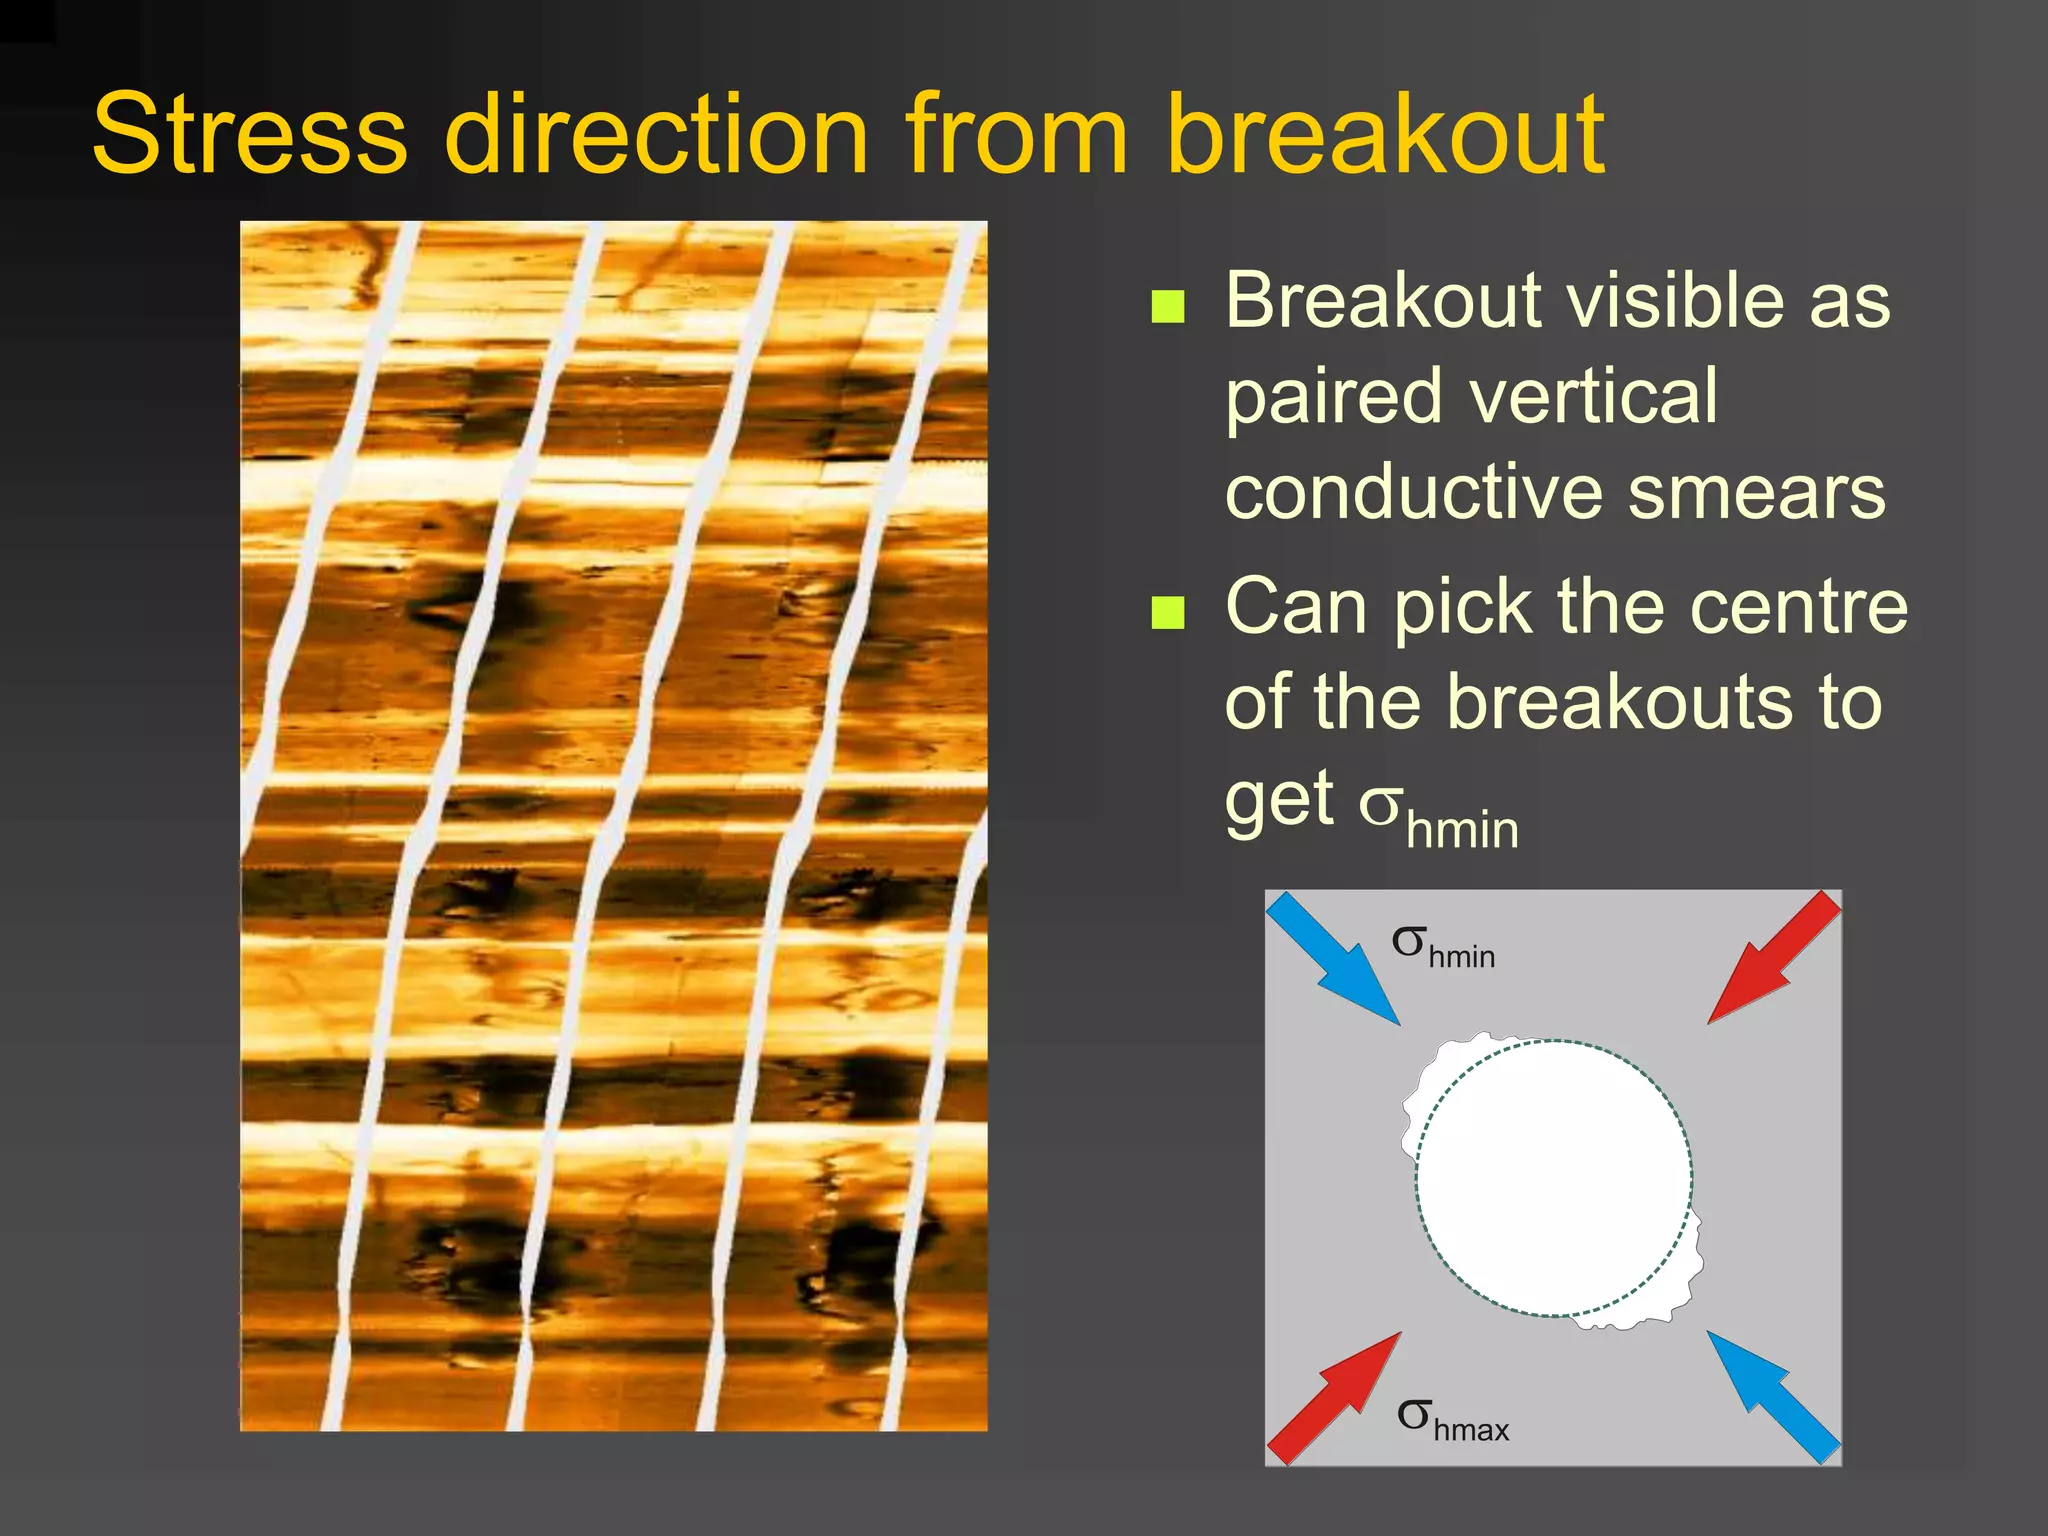
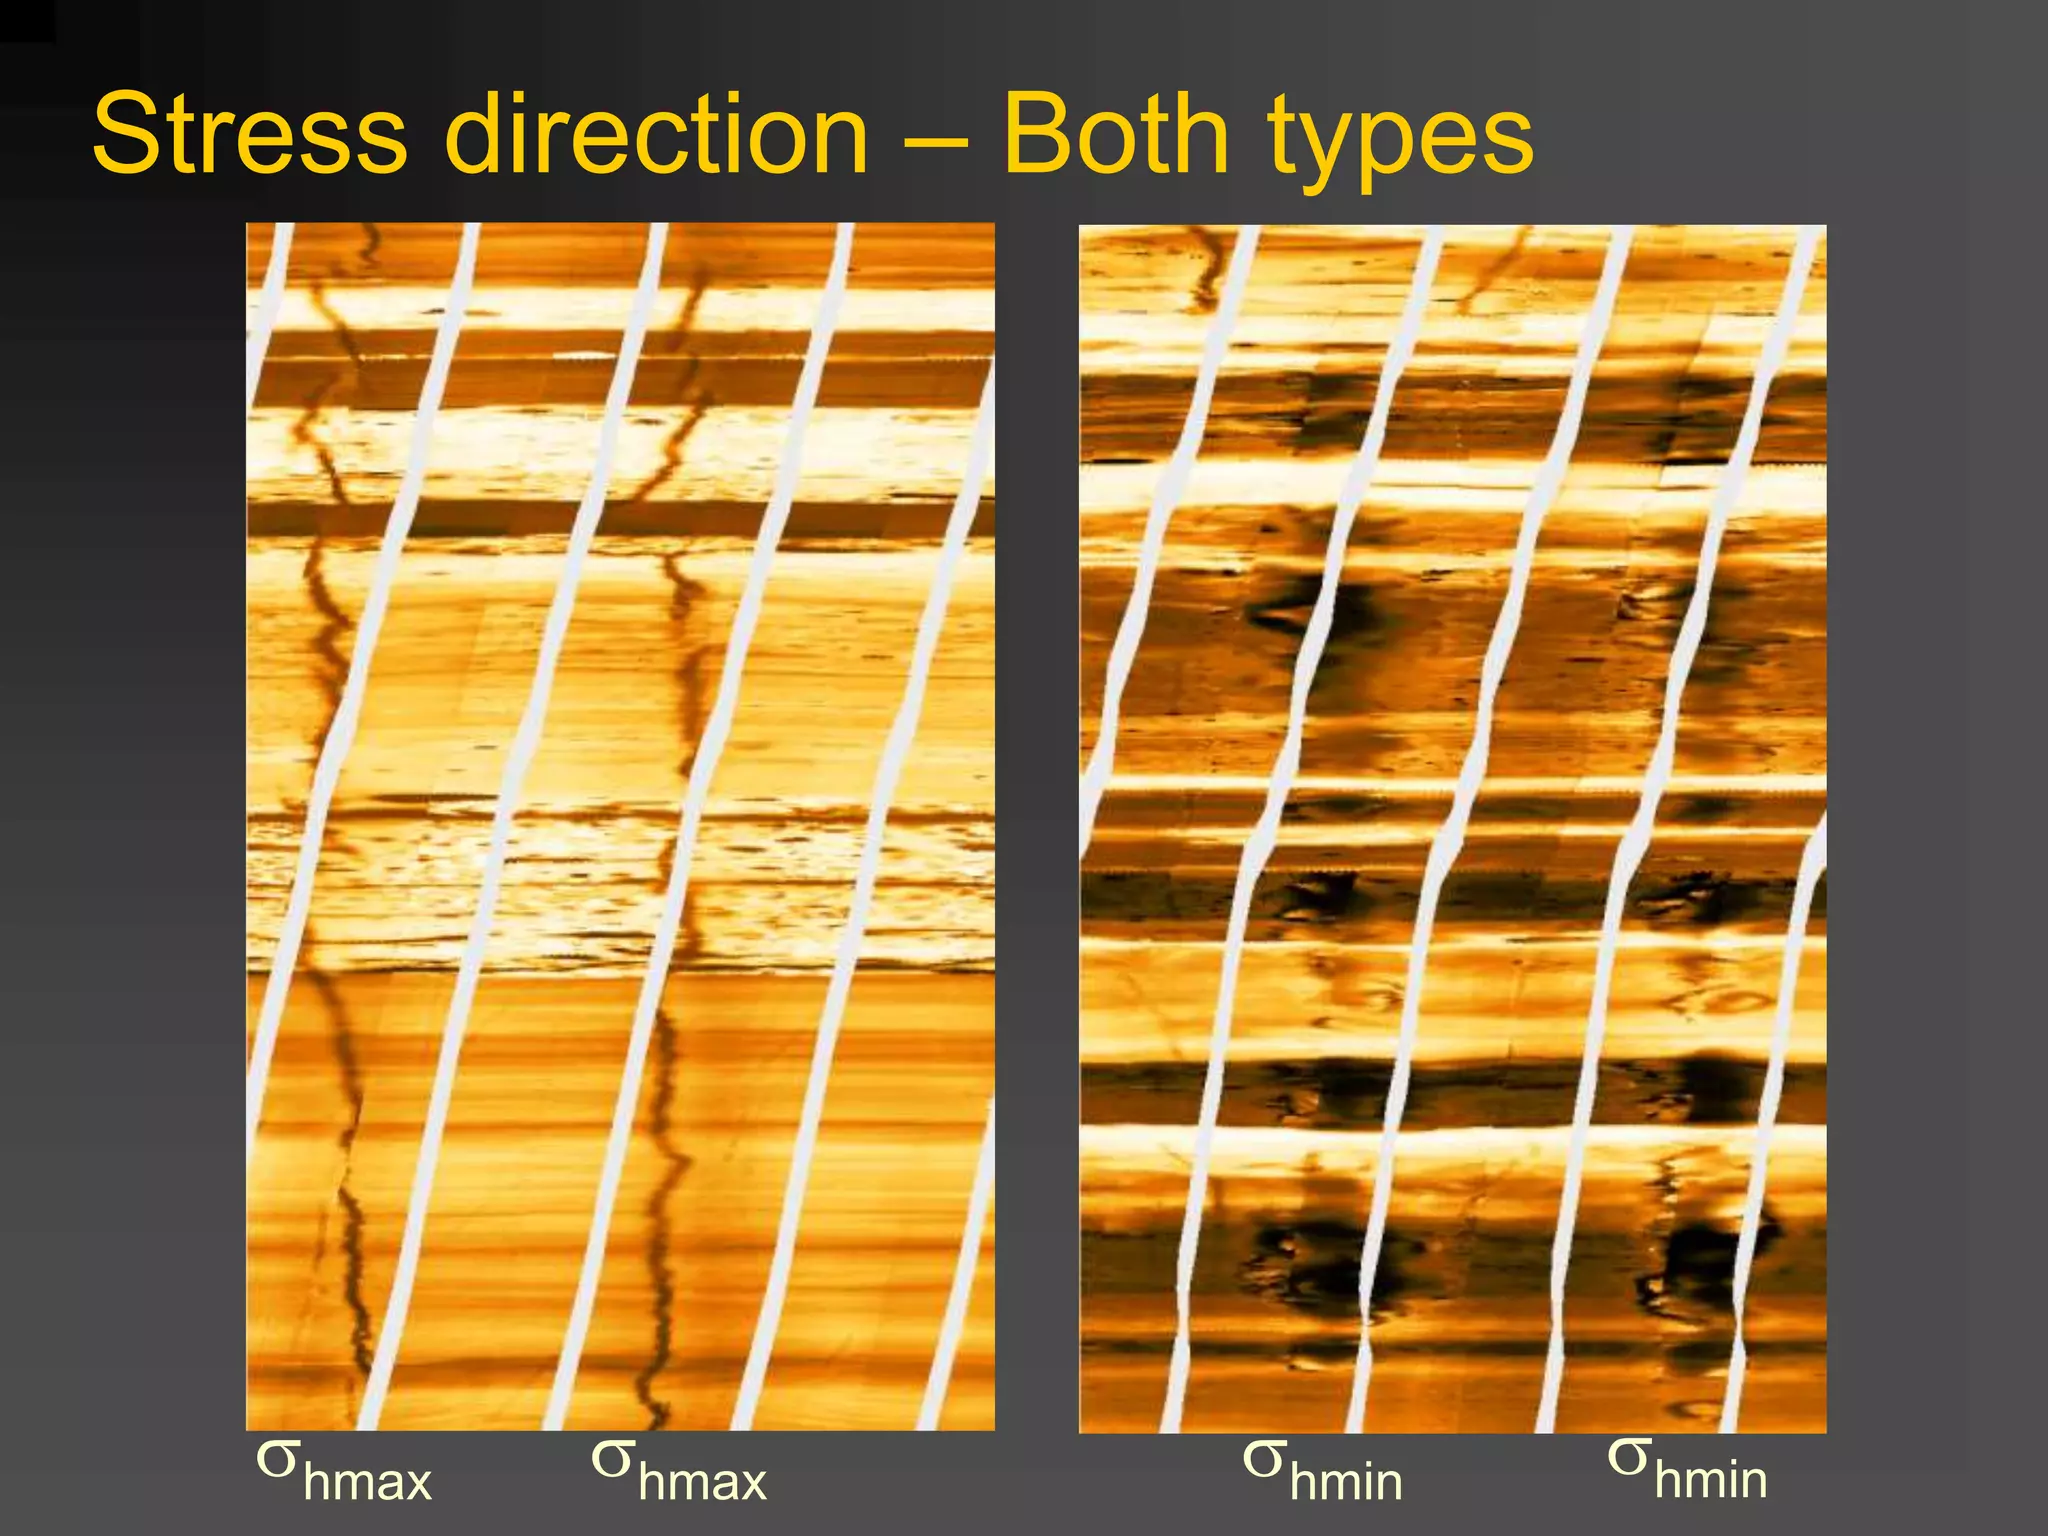
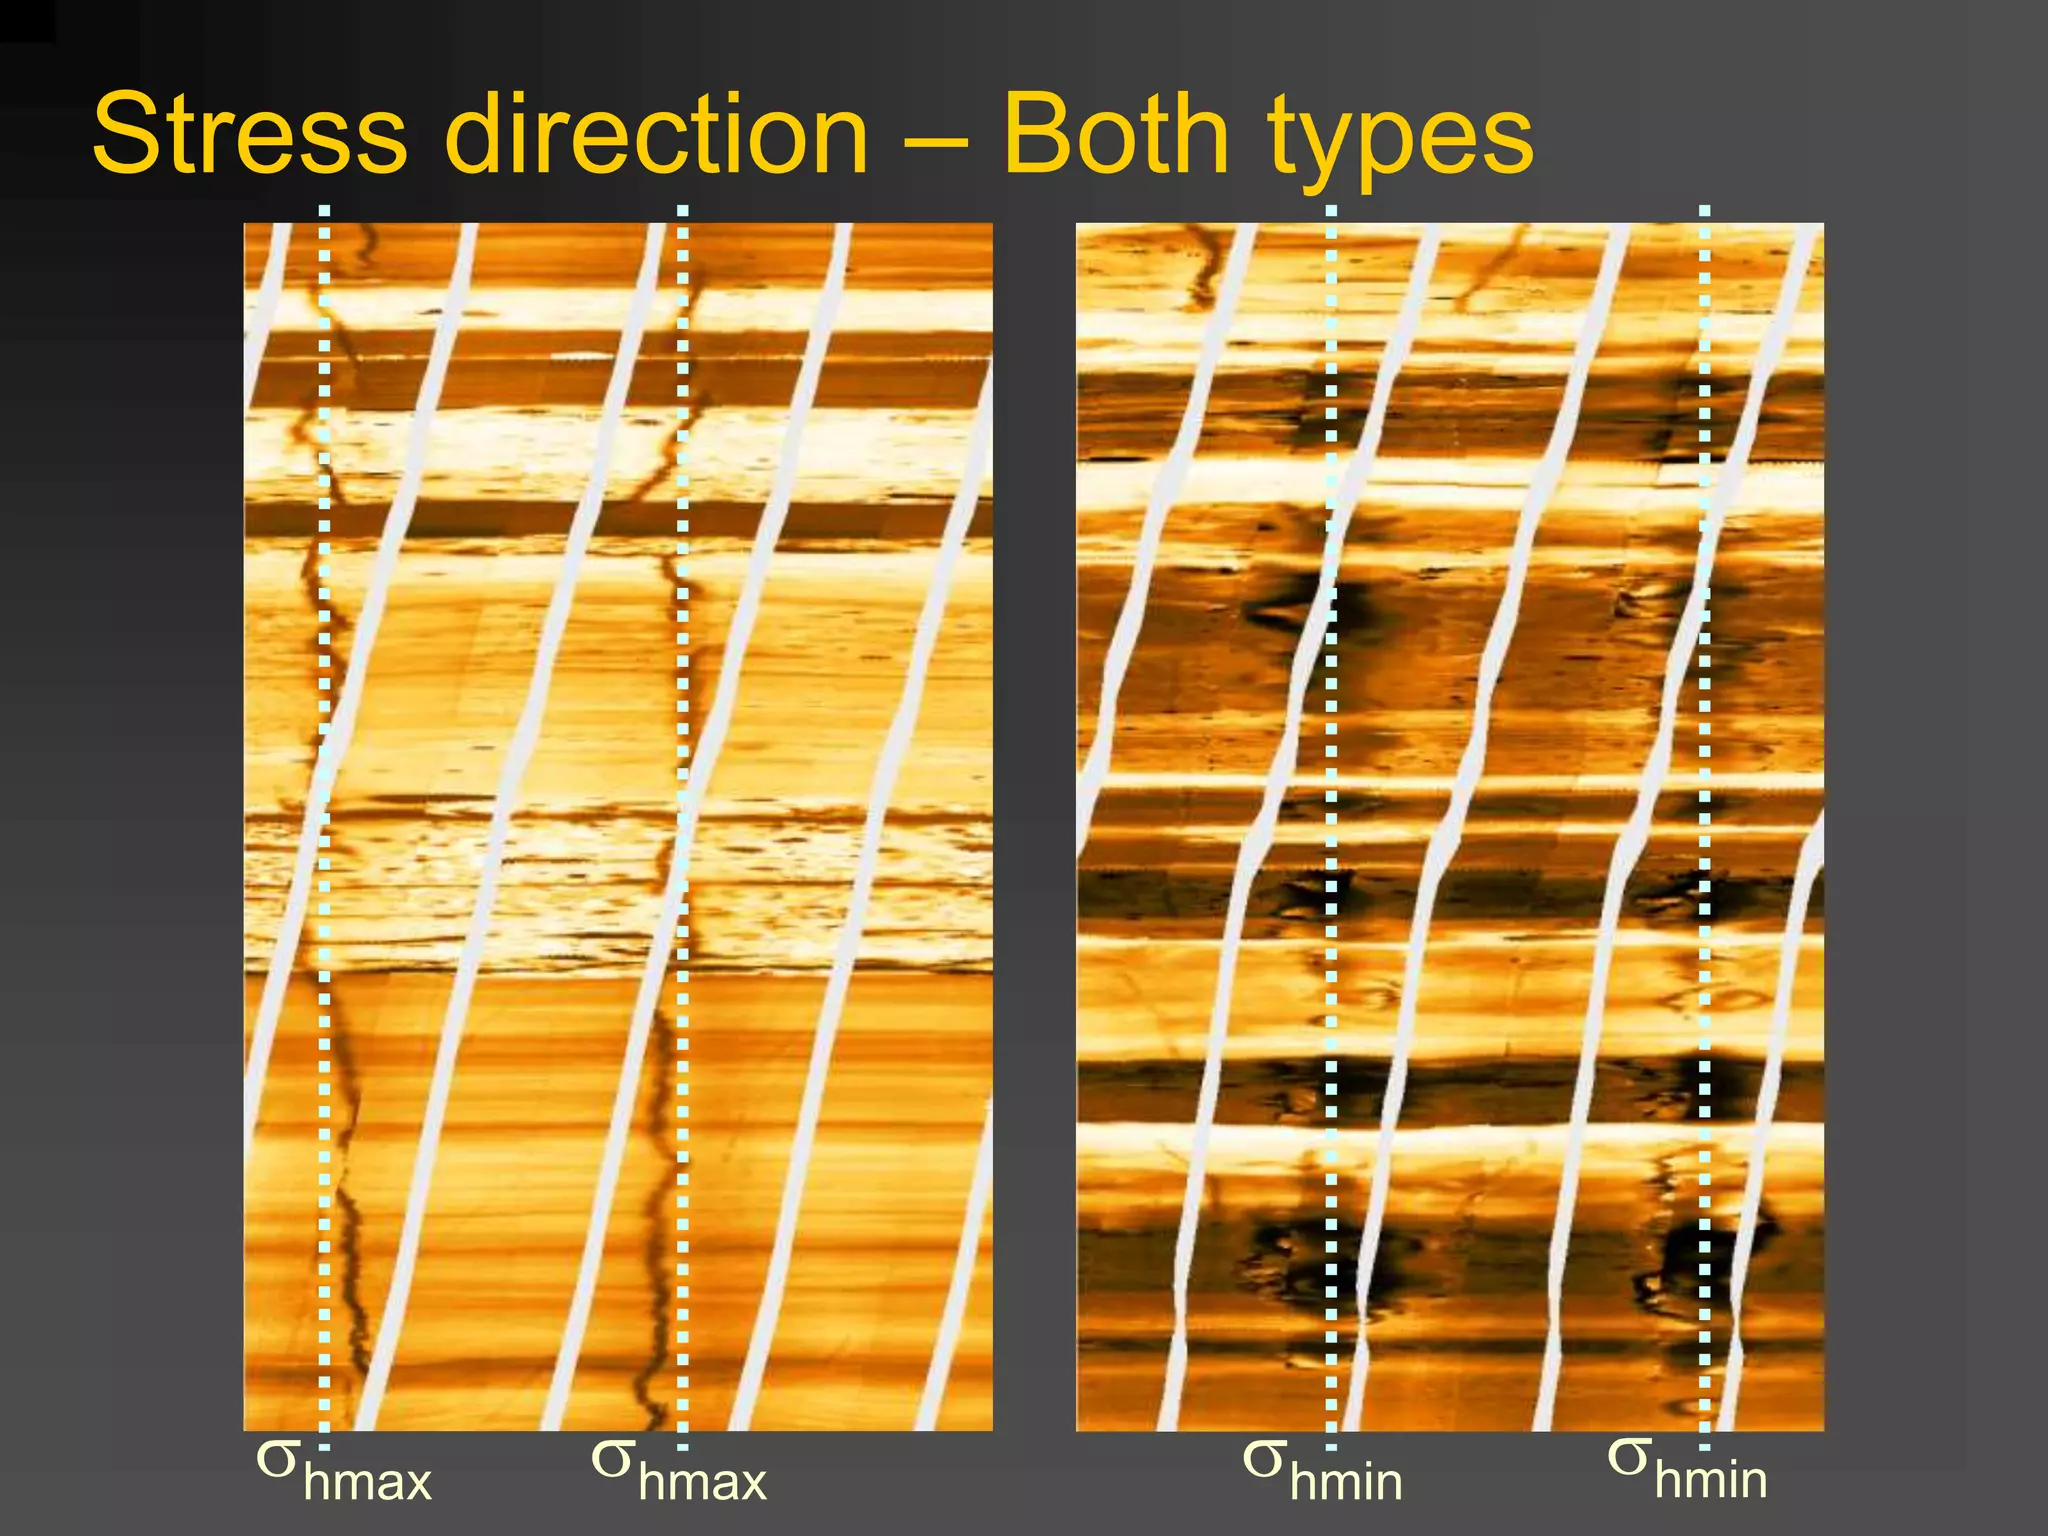
Stress direction frombreakout
shmax
shmin
Breakout visible as
paired vertical
conductive smears
Can pick the centre
of the breakouts to
get shmin
62.
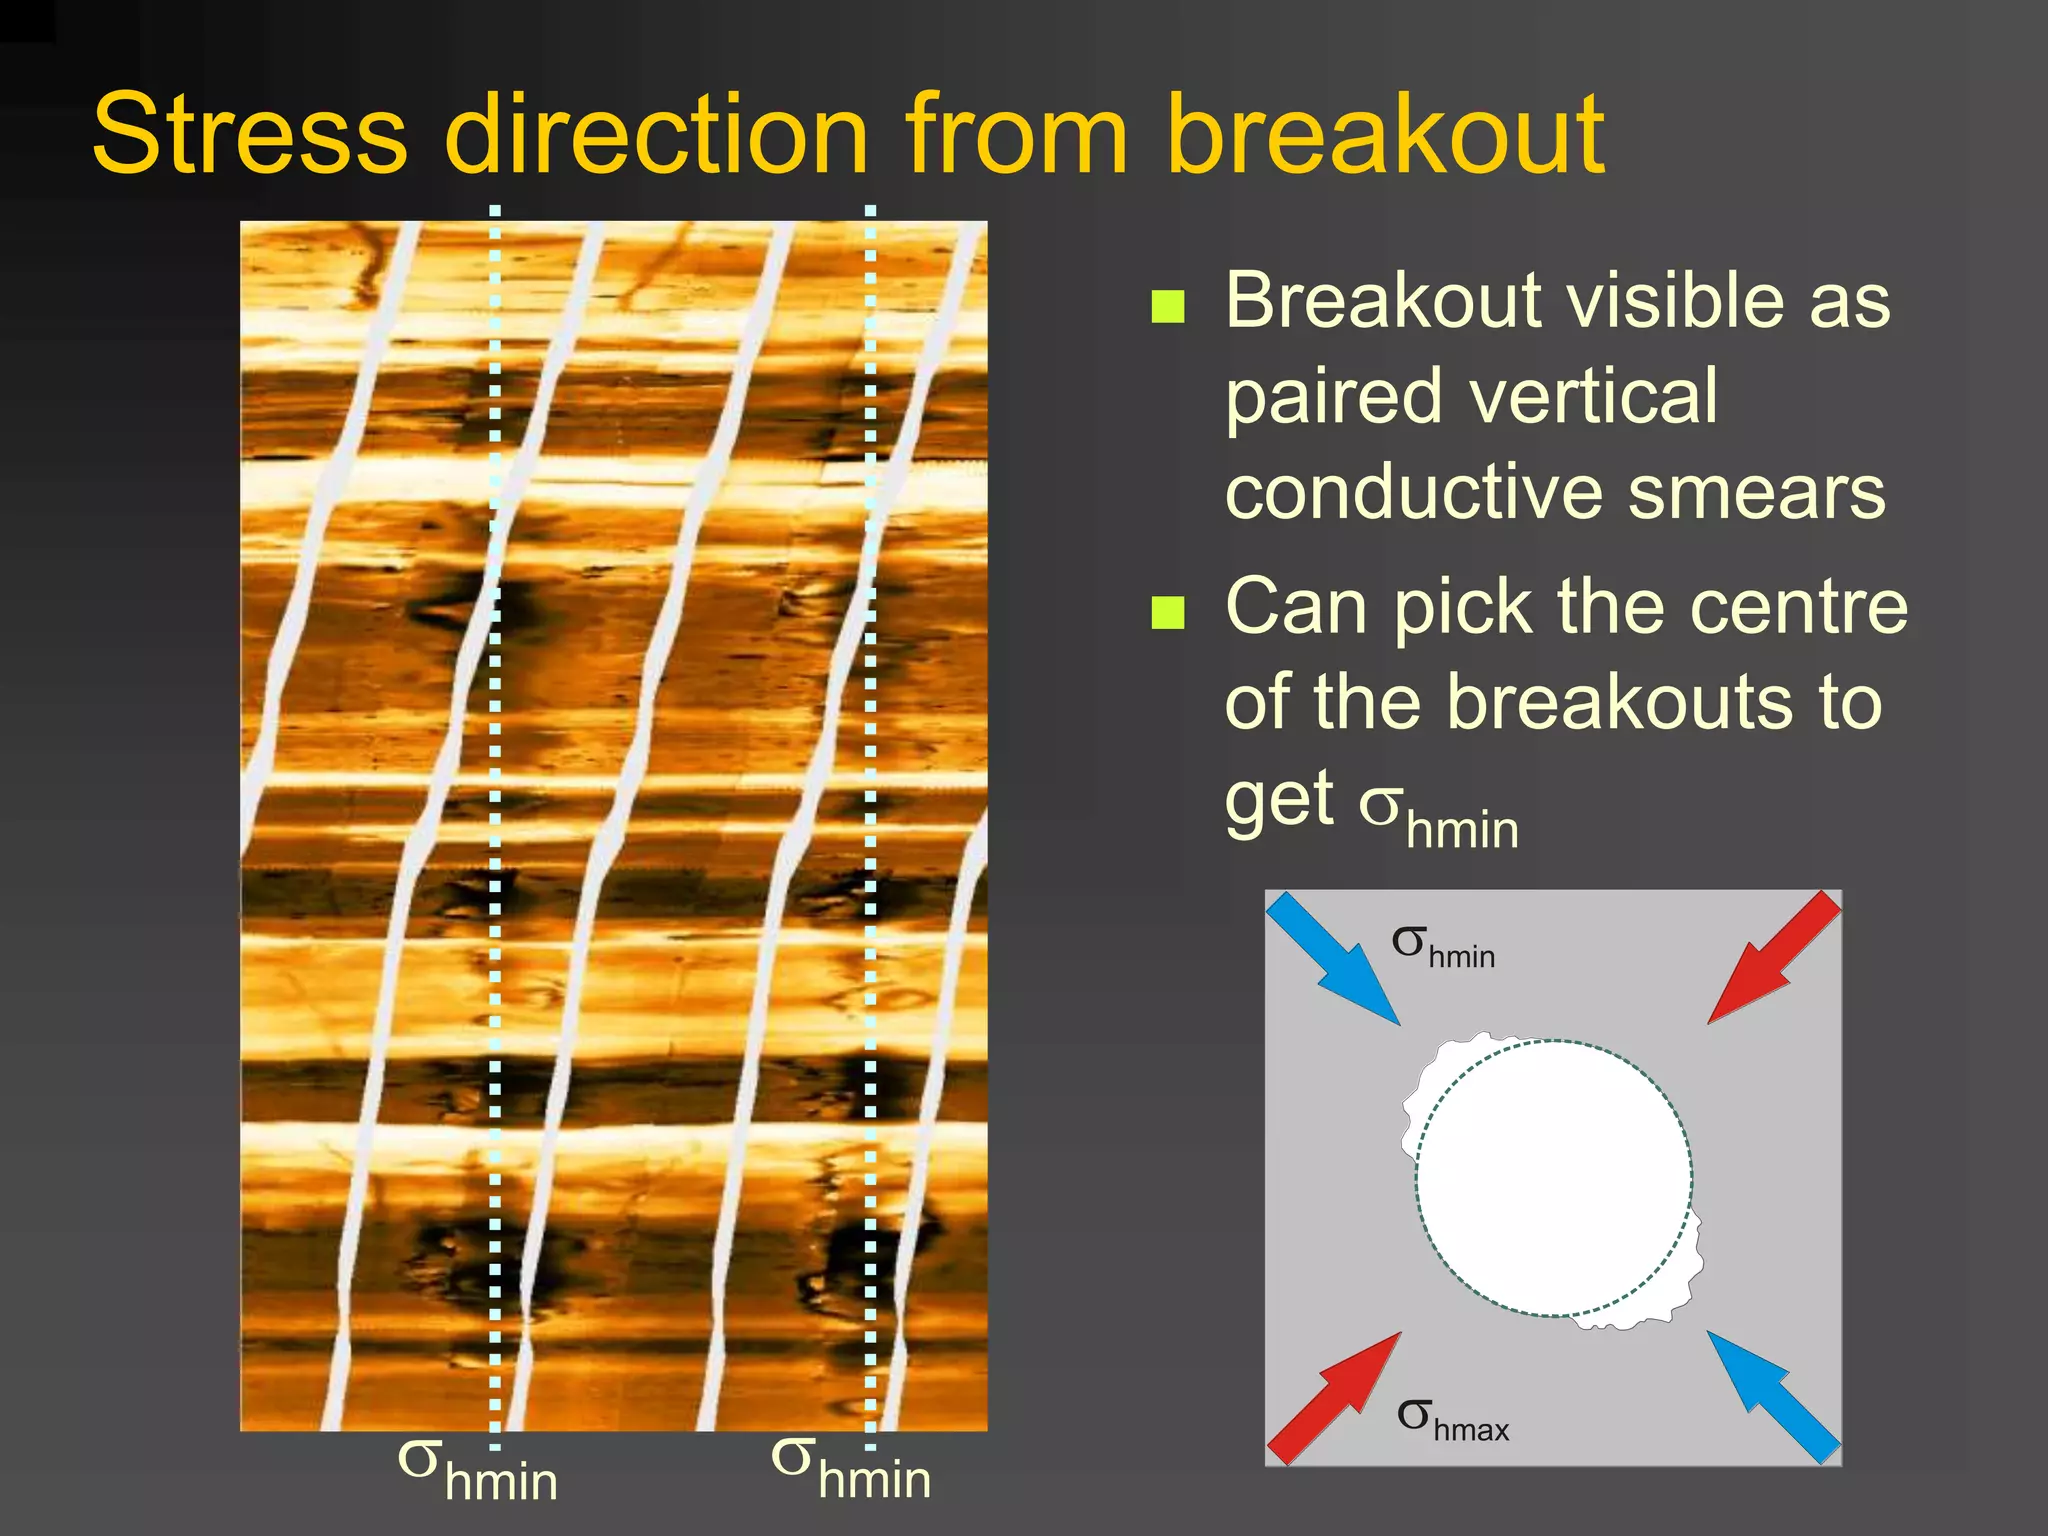
Stress direction frombreakout
shmax
shmin
Breakout visible as
paired vertical
conductive smears
Can pick the centre
of the breakouts to
get shmin
shmin shmin
63.
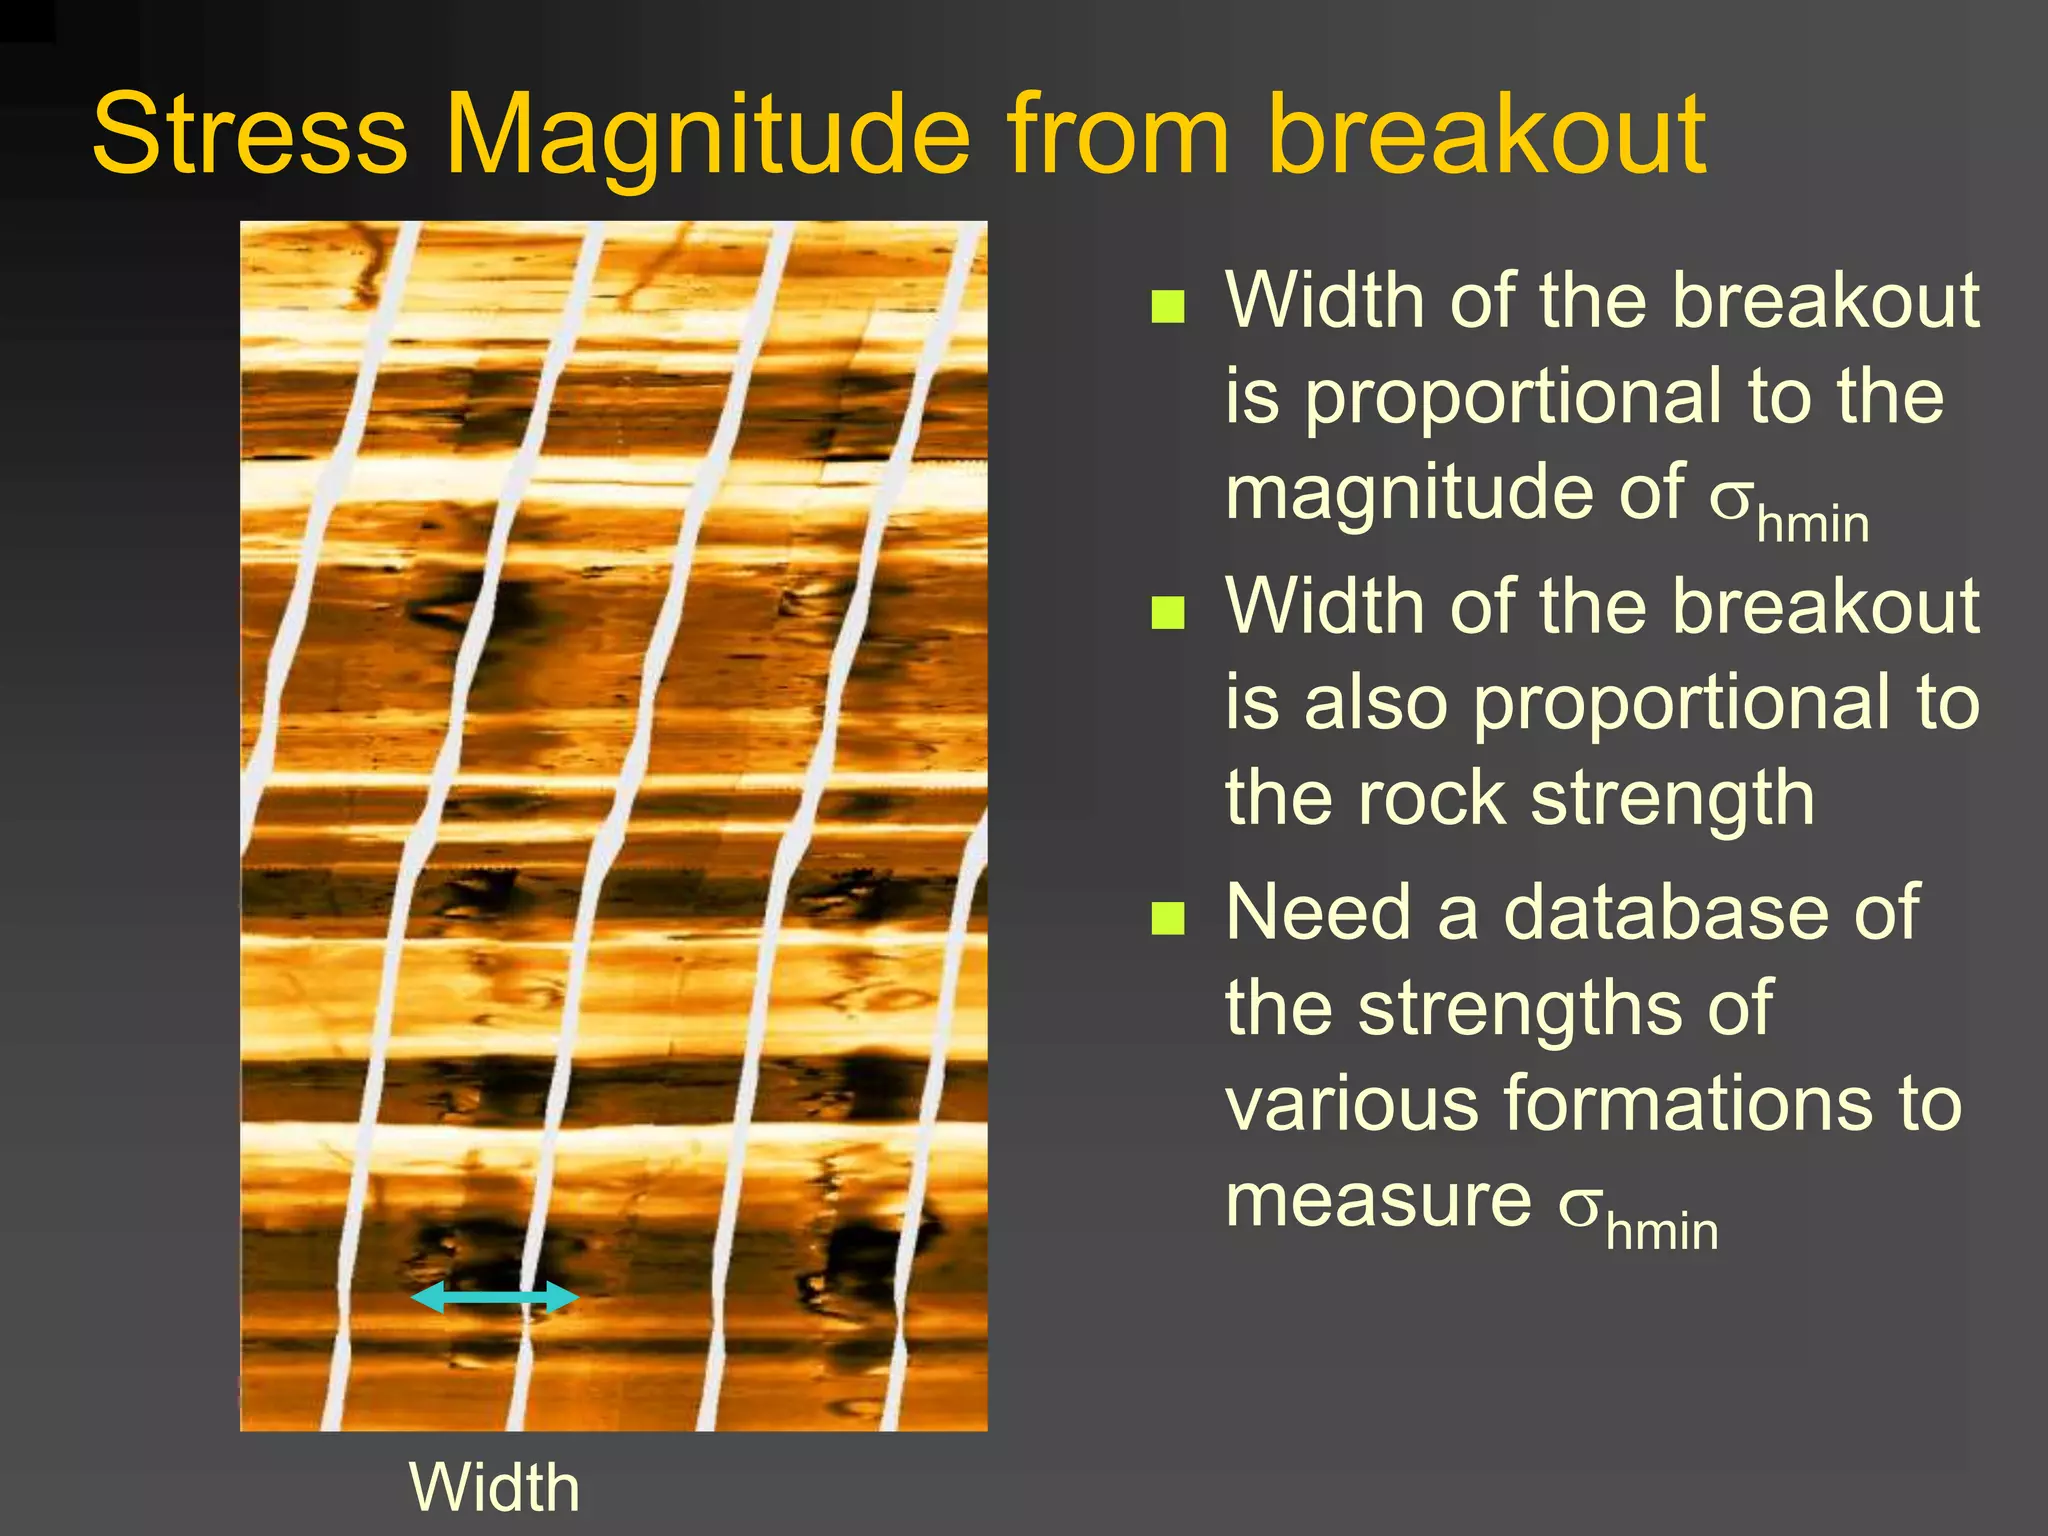
Stress Magnitude frombreakout
Width of the breakout
is proportional to the
magnitude of shmin
Width of the breakout
is also proportional to
the rock strength
Need a database of
the strengths of
various formations to
measure shmin
Width
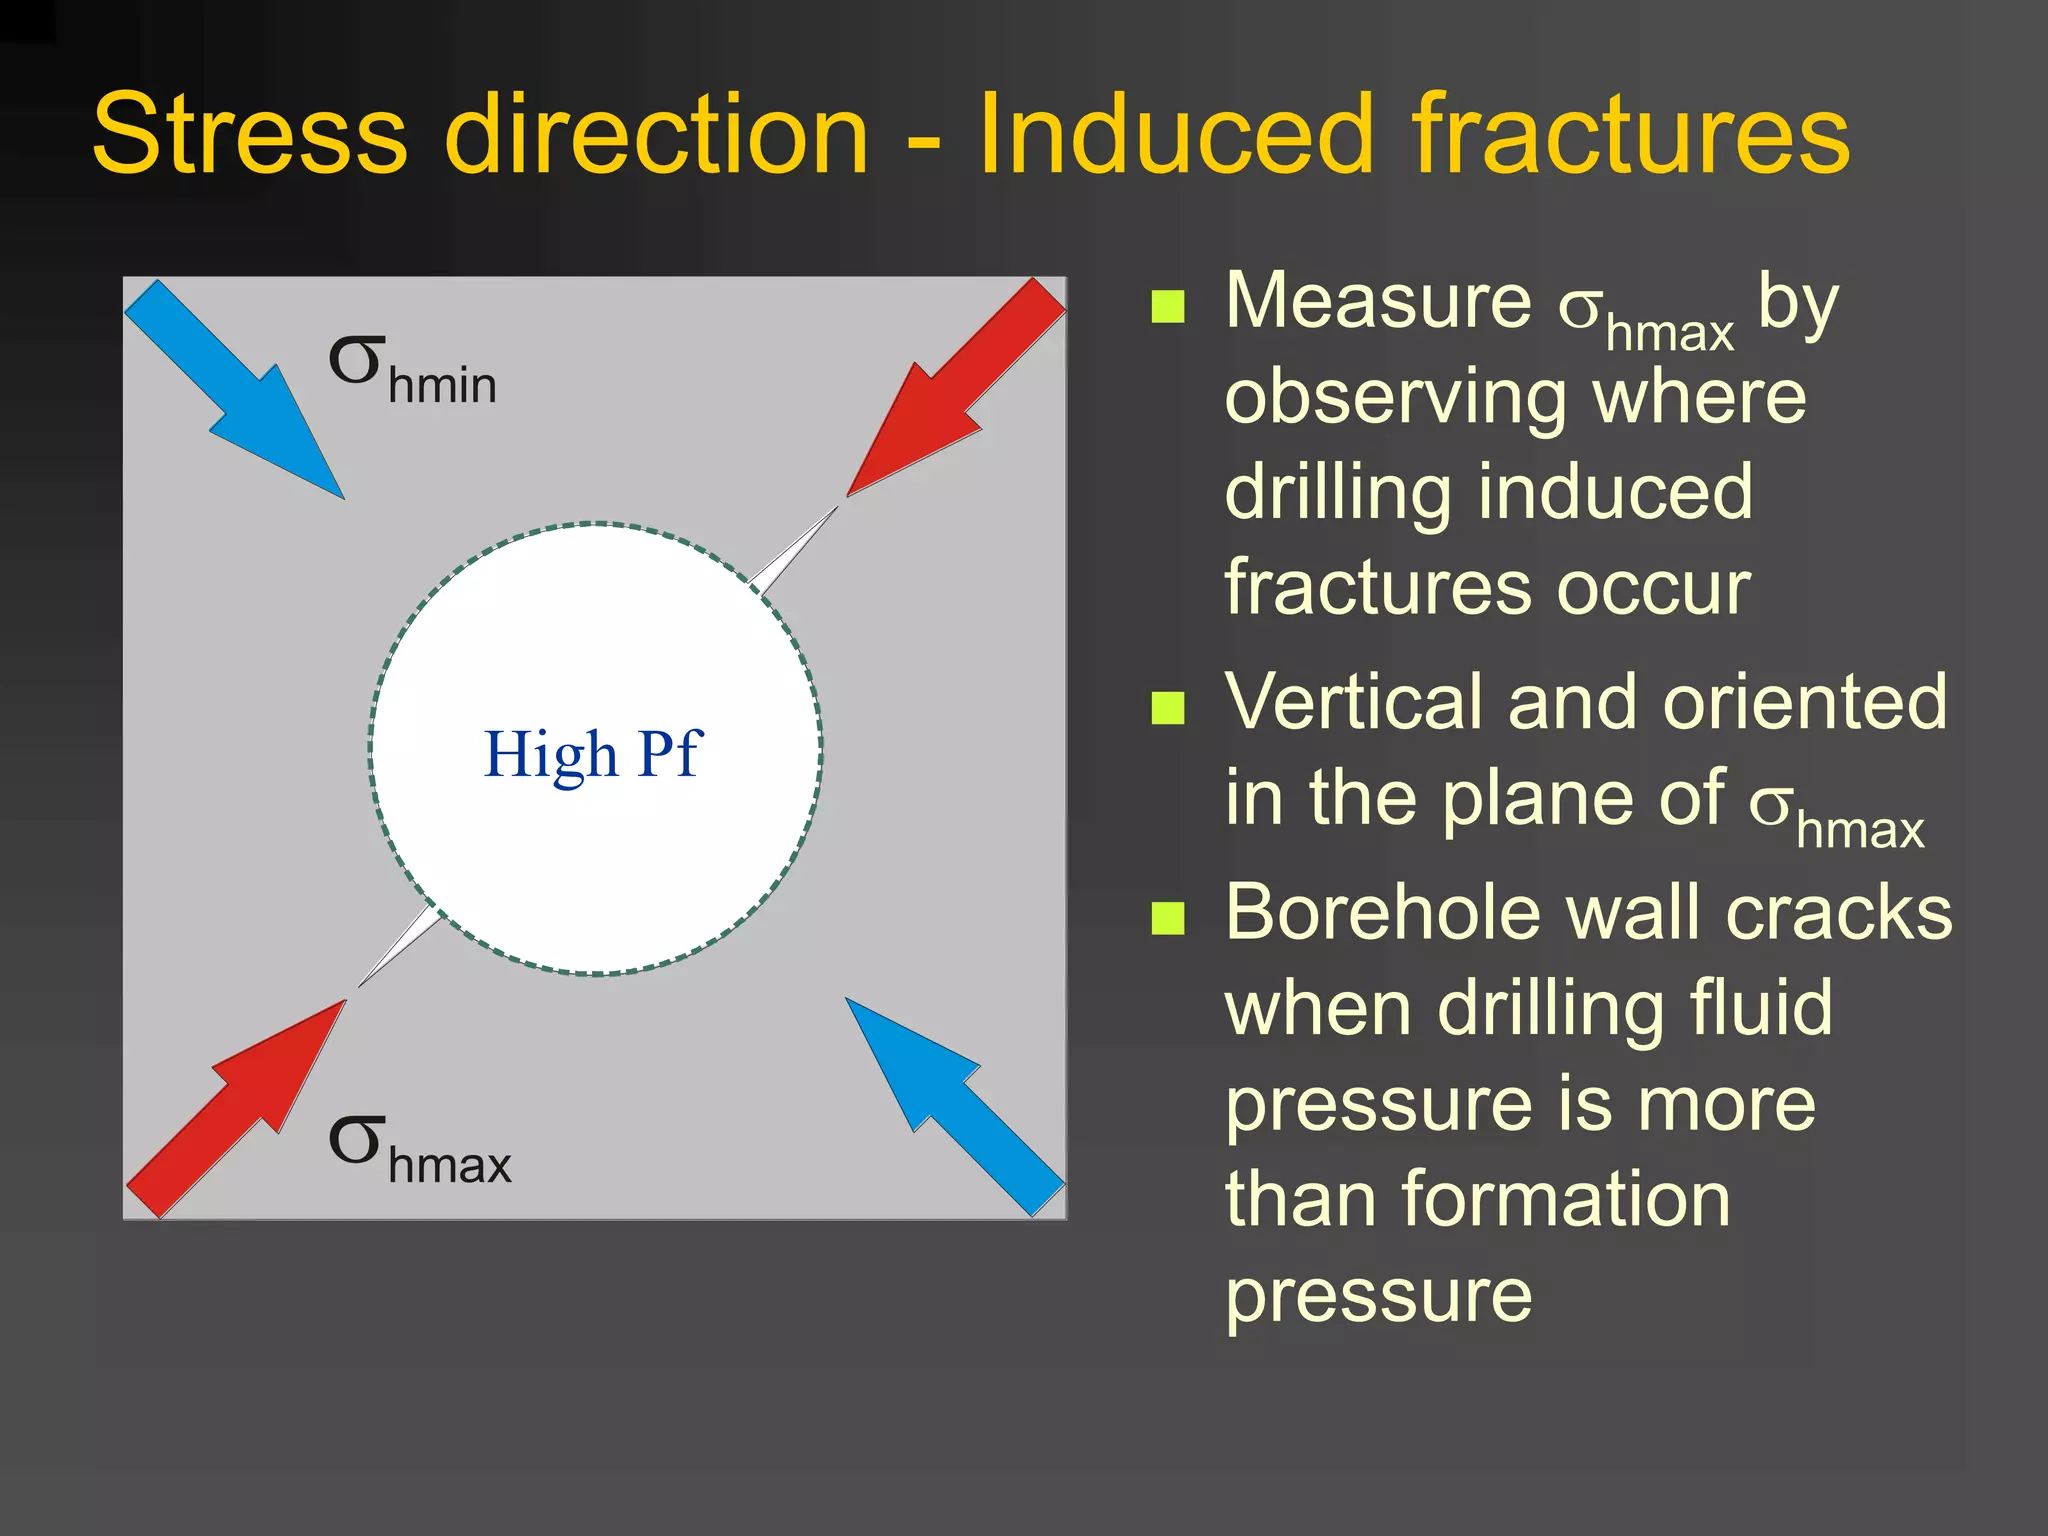
Stress direction -Induced fractures
Measure shmax by
observing where
drilling induced
fractures occur
Vertical and oriented
in the plane of shmax
Borehole wall cracks
when drilling fluid
pressure is more
than formation
pressure
shmax
shmin
High Pf
66.
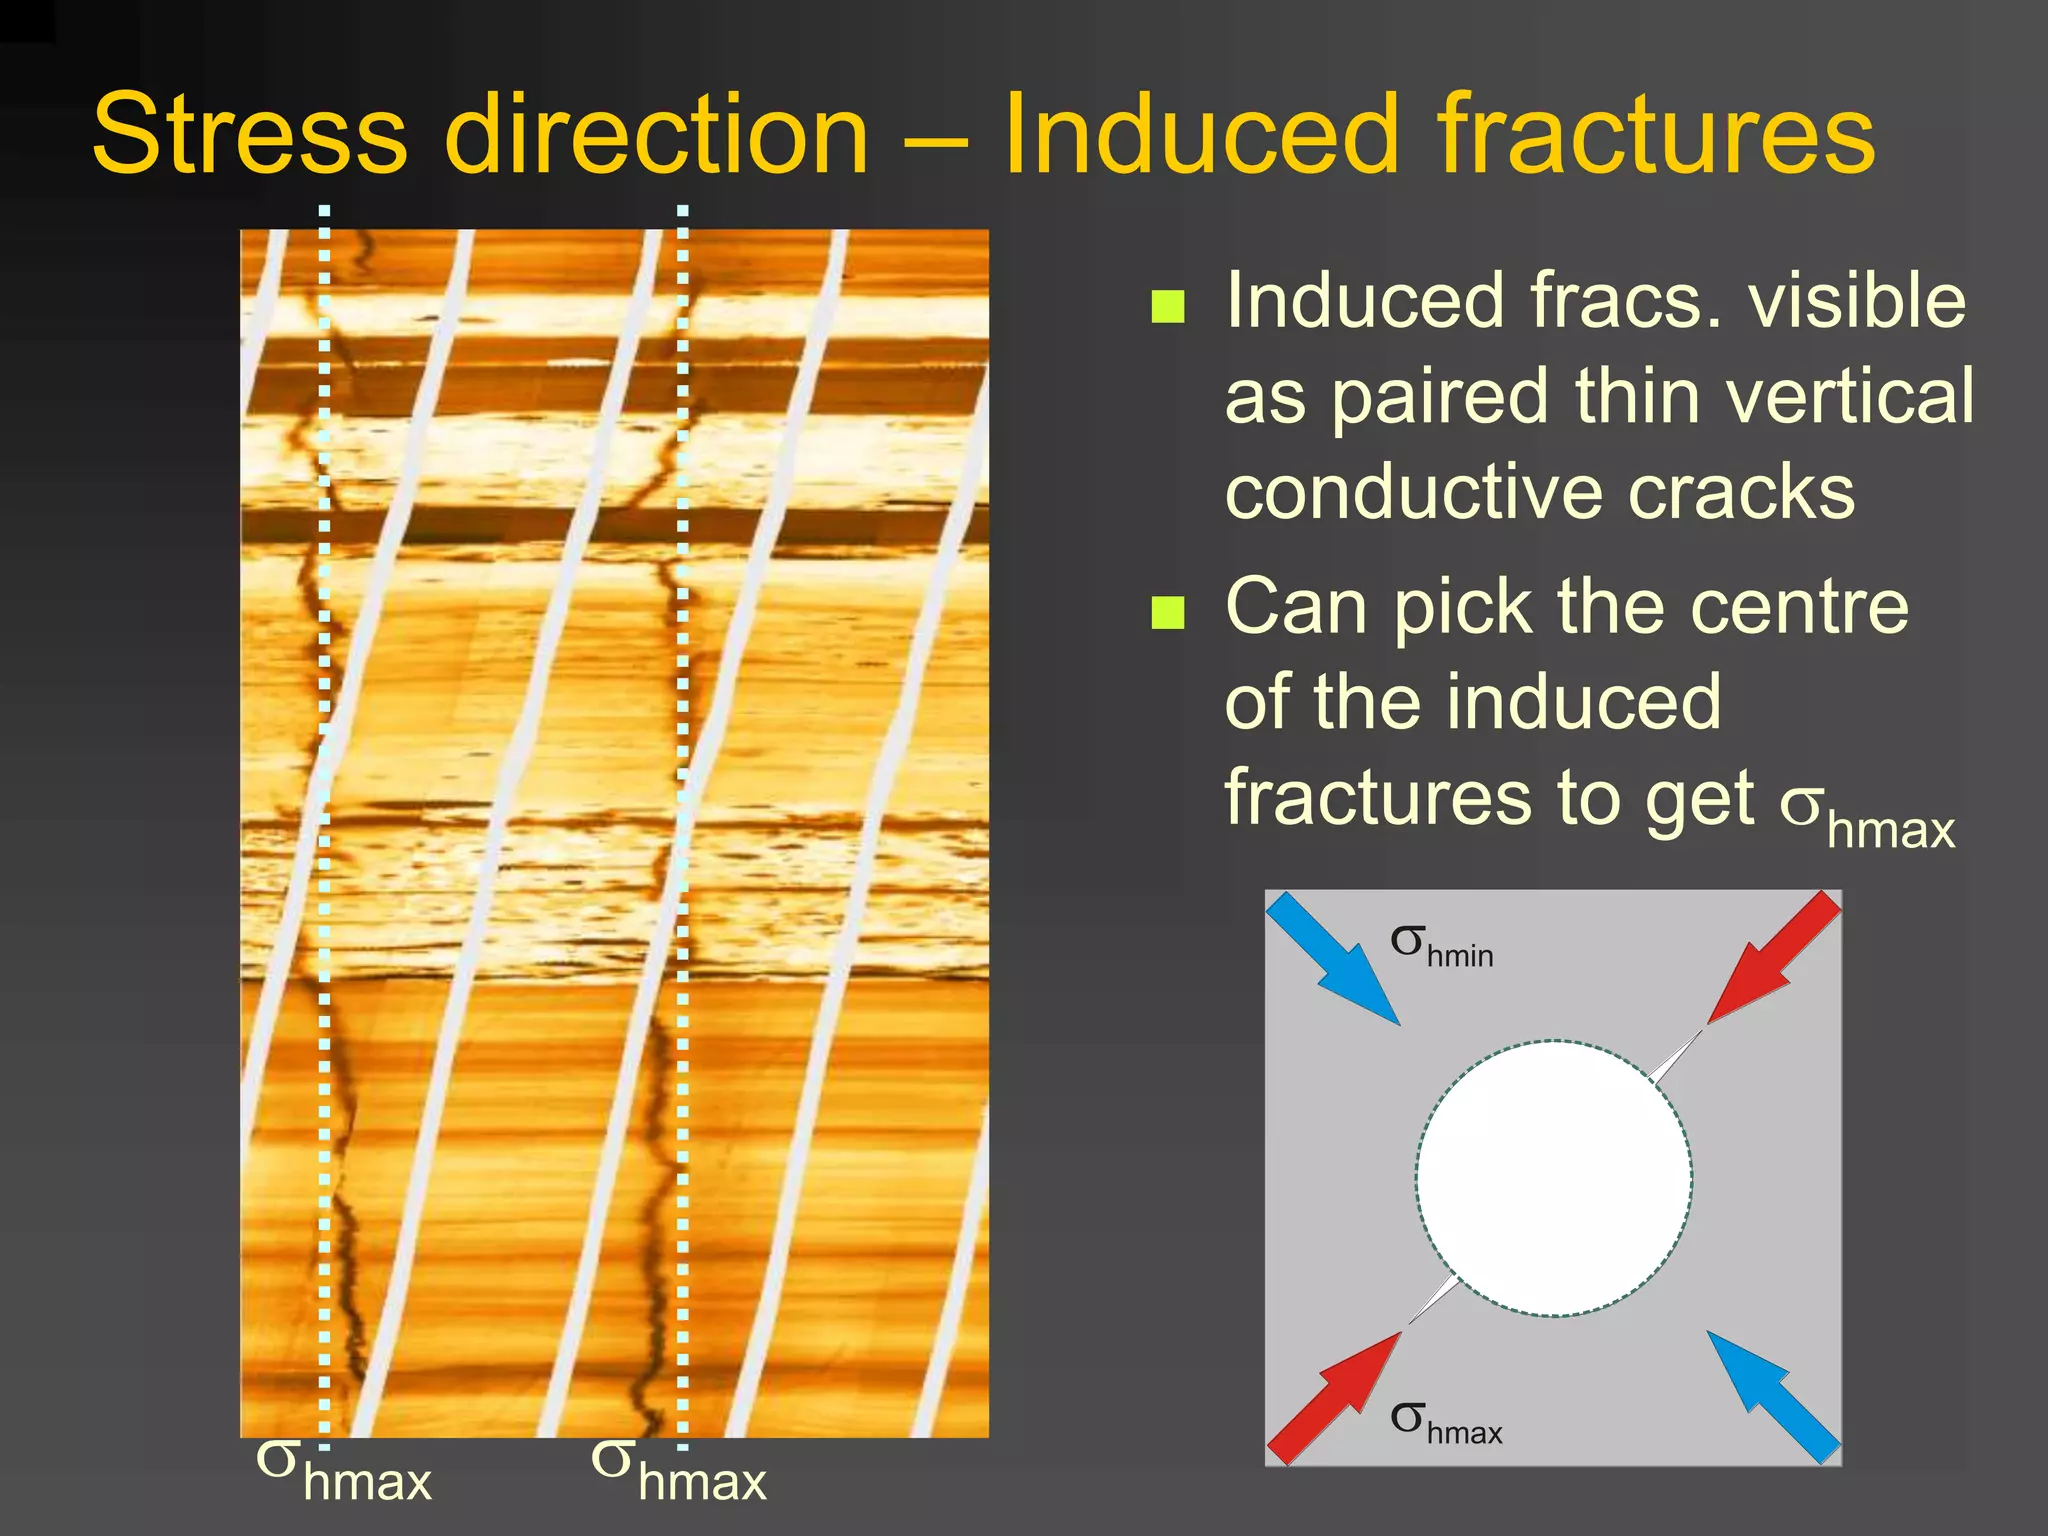
Stress direction –Induced fractures
Induced fracs. visible
as paired thin vertical
conductive cracks
Can pick the centre
of the induced
fractures to get shmax
shmax
shmin
67.
Stress direction –Induced fractures
Induced fracs. visible
as paired thin vertical
conductive cracks
Can pick the centre
of the induced
fractures to get shmax
shmax
shmin
shmaxshmax
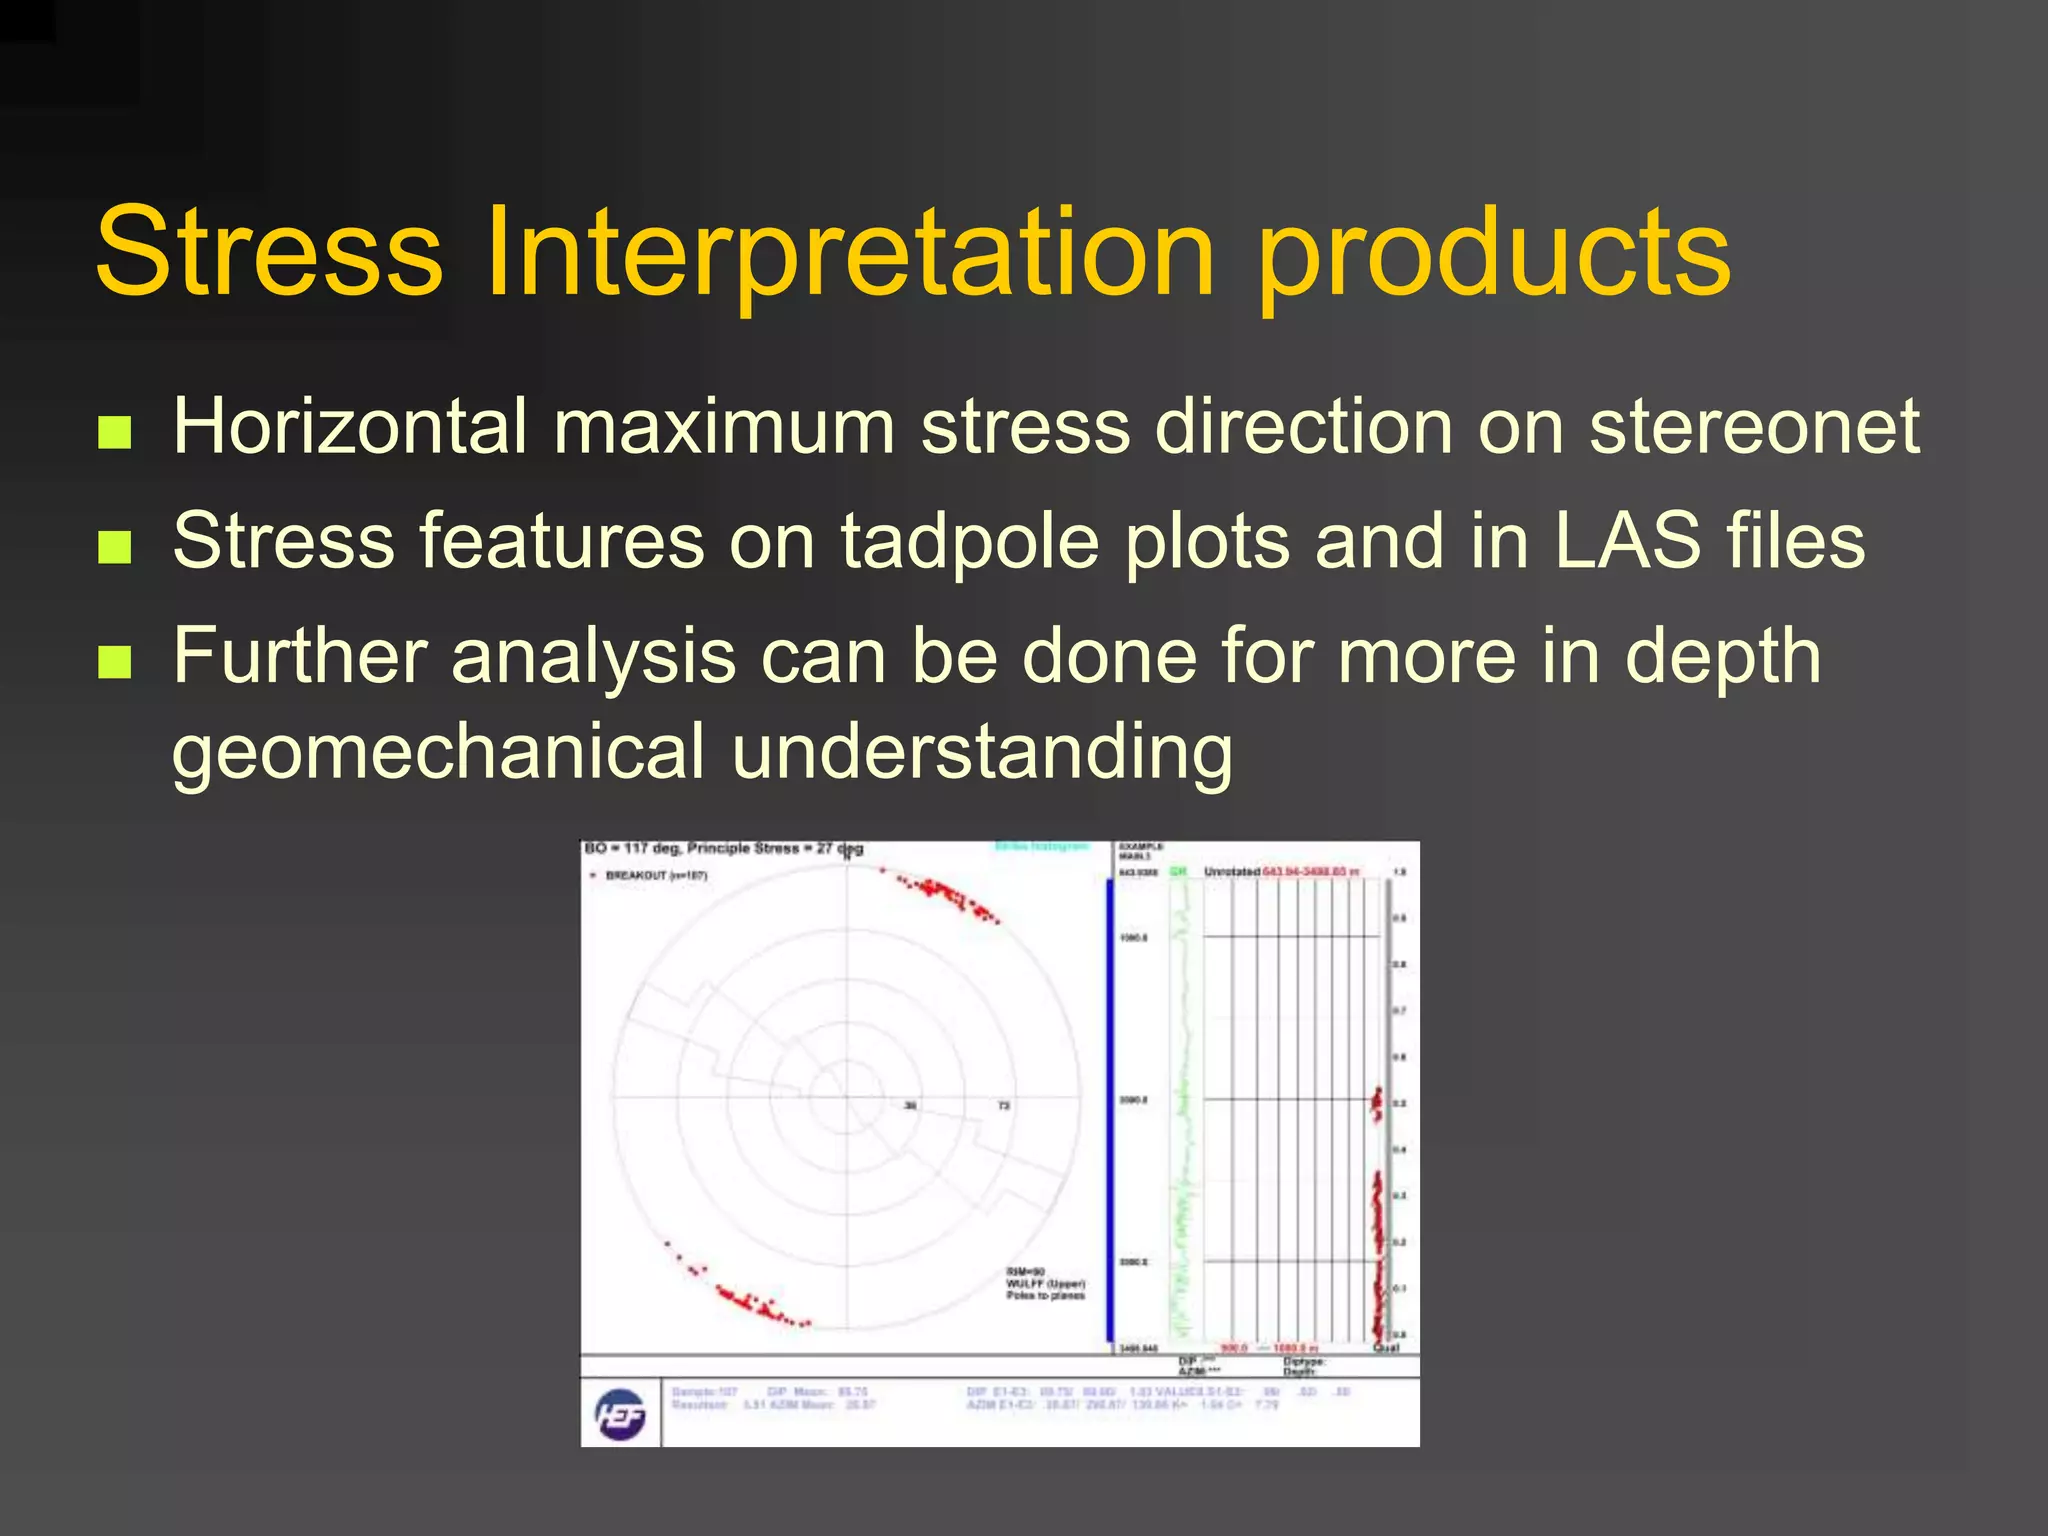
Stress Interpretation products
Horizontal maximum stress direction on stereonet
Stress features on tadpole plots and in LAS files
Further analysis can be done for more in depth
geomechanical understanding
71.
Interpreted boreholeimage data should always be
distributed as digital files (Downloaded via FTP/website or
on DVD)
Can be printed on paper
Can be supplied in a format that can be loaded into other
software packages (a DLIS array of the processed image)
Should be stored by the interpreter and logging contractor (if
different) in some permanent database (Recall, etc.)
Ideally should become part of government databases once
off confidential
Outtroduction – data outputs
72.
The wordsDipmeter and Borehole image log are pretty
loaded and can mean a lot of things
Depending on the questions, these logs can provide a large
suite of answers about the nature and textures of bedding
and fracturing in the subsurface
The products come in a wide and challenging variety of
plots, files and media
Conclusion