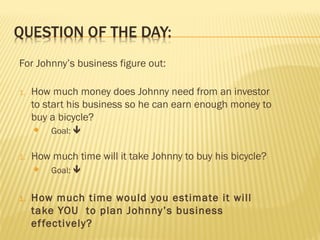
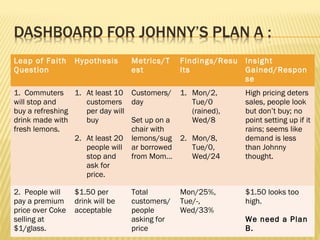
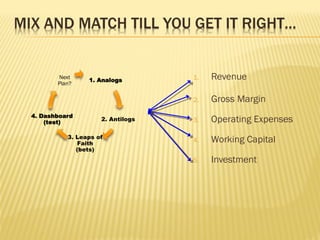
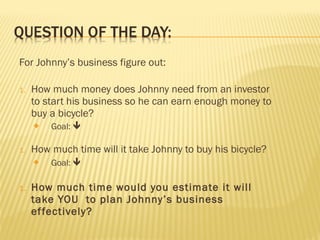
On Building a better business
model
Ziya G. Boyacigiller
This presentation was created and given by Ziya
Boyacigiller who was leading Angel Investor and a loved
mentor to many young entrepreneurs in Turkey. We have
shared it on the web for everyone’s benefit. It is free to
use but please cite Ziya Boyacigiller as the source when
you use any part of this presentation. For more about
Ziya Boyacigiller’s contributions to the start-up Ecosystem
of Turkey, please go to www.ziyaboyacigiller.com
(Based on Getting to Plan B, John Mullins, Randy Komisar)
For Johnny’s business figure out:
1. How much money does Johnny need from an investor
to start his business so he can earn enough money to
buy a bicycle?
 Goal: 
1. How much time will it take Johnny to buy his bicycle?
 Goal: 
1. How much time would you estimate it will
take YOU to plan Johnny’s business
effectively?
Use evidence to build confidence & credibility.
Hope
is not
a strategy !
Business
Model
Element
Analogs and
numbers
they provide
you
Antilogs and
numbers
they provide
you
Leap of Faith
(bets) around
which you
will build
your
dashboard
Hypothesis
that will
prove or
refute your
leaps of faith
Revenue Model
GM Model
Operating
Model
Working Capital
Model
Investment
Model
Ref: Getting to Plan B, J. Mullins / R. Komisar
The uncertainty that surrounds most innovations and
most new ventures can be significantly mitigated by
comparing the plan on the table to other businesses
already in existence.
Discovering or developing a business model that will work…
BUSINESS
MODEL means
the pattern of
economic activity
(cash flowing in and
out of your business
for various purposes
and the timing
thereof) that dictates
whether or not you
run out of cash and
whether or not you
deliver attractive
PROFITS to your
investors and
yourself.
ANALOGS to your idea are successful
predecessor companies that are worth
mimicking in some way.
There are many analogs out there, portions of which can be
borrowed or adapted to help you understand the economics and
various other facets of your proposed business and its business
model.
ANTILOGS are predecessor companies
compared to which you explicitly choose to do
things differently, perhaps because some
of what they did has been unsuccessful.
It is not what you know that will likely
make you fail, it is “what you don’t know
you don’t know”…
Identify the questions where analogs and antilogs don’t provide the
answers.
The questions you cannot answer from historical precedent lead you
to your leaps of faith – beliefs you hold about the answers
to your questions despite having no real evidence that these beliefs
are actually true.
Ref: Getting to Plan B, J. Mullins / R. Komisar
http://files.posterous.com/jaysteele Roger L. Martin
Figuring out what customers will buy is a process – not a guess.
Running out of cash isn’t a cause – it’s a symptom. It’s a symptom or signal
that the company’s business model didn’t work.
Business Model is the pattern of economic
activity – cash flowing into and out of your
business for various purposes and the timing
thereof – that dictates whether or not you run
out of cash and whether or not you deliver
attractive returns to your investors.
To address your leaps of
faith, you’ll have to leap…
that is, experiment.
A dashboard is a tool that drives an evidence-
based process to plan, guide, and track the
results of what you learn from your hypothesis
testing.
Leap of Faith
Question
Hypothesis Metrics/T
est
Findings/Resu
lts
Insight
Gained/Respon
se
1. Commuters
will stop and
buy a refreshing
drink made with
fresh lemons.
1. At least 10
customers
per day will
buy
2. At least 20
people will
stop and
ask for
price.
Customers/
day
Set up on a
chair with
lemons/sug
ar borrowed
from Mom…
1. Mon/2,
Tue/0
(rained),
Wed/8
2. Mon/8,
Tue/0,
Wed/24
High pricing deters
sales, people look
but don’t buy; no
point setting up if it
rains; seems like
demand is less
than Johnny
thought.
2. People will
pay a premium
price over Coke
selling at
$1/glass.
$1.50 per
drink will be
acceptable
Total
customers/
people
asking for
price
Mon/25%,
Tue/-,
Wed/33%
$1.50 looks too
high.
We need a Plan
B.
You are here.
TEST – EXPERIMENT … Use your creativity
and find a way to prove or disprove your hypothesis
before you waste too much of your time or your money.
Quantify if it is important for you to understand and control it --
1. Revenue
2. Gross Margin
3. Operating Expenses
4. Working Capital
5. Investment
1. Revenue
2. Gross Margin
3. Operating Expenses
4. Working Capital
5. Investment
1. Revenue
2. Gross Margin
3. Operating Expenses
4. Working Capital
5. Investment
1. Sales Revenue
2. Investors
If the customers don’t BUY and PAY you for what you sell them,
you can’t force them to...
1. Who will buy?
(who is your customer?)
2. What will customers buy?
(product/service)
3. What pain are you resolving for customers, or what delight are you offering?
(value proposition  important & not-available)
4. How soon, how often will customers buy?
(timing model)
5. How much, how many will customers buy?
(unit sales model)
6. At what price will customers buy, and on what basis will they pay?
(price model)
7. With what effort and cost on your part?
(cost of sales)
Business
Model
Element
Analogs and
the numbers
they give you
Antilogs and
numbers
they give you
Leap of Faith
(bets) around
which you
will build
your
dashboard
Hypothesis
that will
prove or
refute your
leaps of faith
Revenue Model $1 / glass $0.75-10gls/d ?
GM Model
Operating
Model
Working Capital
Model
Investment
Model
1. Revenue
2. Gross Margin
3. Operating Expenses
4. Working Capital
5. Investment
 Gross Margin (GM) =
 Revenue – Cost of Goods Sold (COGS) 
GM % = 100 X { (Revenue – COGS ) / Revenue }
Sometimes referred to as Gross Profit…
COGS includes all expenses directly related to producing or delivering
whatever it is that you sell -- what your customers actually buy .
GM ranges from 0% to ~100%
Question: What is a good GM% ? What is exceptional GM%?
How much money does it take for you to build the value for your customers?
1. “spread” between Price and COGS
2. Managing your product “mix”
3. Your “strategy”
(Example: build market-share or profit)
Business
Model
Element
Analogs and
the numbers
they give you
Antilogs and
numbers
they give you
Leap of Faith
(bets) around
which you
will build
your
dashboard
Hypothesis
that will
prove or
refute your
leaps of faith
Revenue Model
GM Model
Operating
Model
Working Capital
Model
Investment
Model
1. Revenue
2. Gross Margin
3. Operating Expenses
4. Working Capital
5. Investment
Operating Expenses (OPEX) are all the day-to-day cost of doing
business (running your business), not included in the costs of goods
sold (COGS).
Some costs can be included in either COGS or OPEX, and where you
include them is a choice you make when you define your accounting
system.
OPEX are also called “below the line expenses”.
Operating expenses are summarized in “chart of accounts” – key
expense categories defined for an industry. Every industry has one…
Example: Restaurant Industry?
First, start by getting a copy of the “chart of accounts” for your industry
(and/or your analog/antilog competitors).
1. What level of cost will you incur in each cost
category?
2. Which of these costs can be reduced or eliminated?
3. Which of these costs need to be increased or new
cost categories created, to execute your planned
strategy?
Business
Model
Element
Analogs and
the numbers
they give you
Antilogs and
numbers
they give you
Leap of Faith
(bets) around
which you
will build
your
dashboard
Hypothesis
that will
prove or
refute your
leaps of faith
Revenue Model
GM Model
Operating
Model
Working Capital
Model
Investment
Model
1. Revenue
2. Gross Margin
3. Operating Expenses
4. Working Capital
5. Investment
Where is your cash?
Staying in business over the long term – whether
getting past infancy in a new venture, or
steering an established company through times
of economic crisis – means not running
out of cash. Where is “cash balance”
found? It is on your balance sheet.
Working capital is the cash a company needs to have
on hand in the short term to keep the business running
– pay its employees, suppliers, etc.
Hard truth is when you run out of cash, the game is over –
you are out of business ! (Startups call this the “runway”
using airport/airplane metaphor, and keep an eye on
“burn-rate” and “months to financing”)
Timing of cash coming in and going out, “cash flow", is
important so you don’t run out of cash.
1. Current Assets (measured in days)
money soon to be available to company
such as cash, short-term bank deposits, accounts receivable (money customers
owe), and inventories (measured in days) you paid for and can sell.
2. Current Liabilities (measured in days)
money soon to be paid by the company
such as accounts payable (money you owe suppliers), short term debt.
3.  Working Capital =
 Current Assets (+/-Inventories ) – Current Liabilities 
QUESTION: Can you achieve Negative Working Capital position?
 NOTE: Non-cash elements only should be used for this
analysis.
• Current Assets = 37 days
• Inventory: 4 days
• Accounts Receivable: 33 days
(subscribers pay in advance, but advertisers pay arrear, this figure reflects the
later)
• Current Liabilities = 109 days
• Accounts Payable: 70 days
• Unearned Subscriptions: 39 days
(subscriptions paid for but not yet delivered)
• Net of these = --72 days
• That’s is 72 days of net free cash, (72/365 days = )20%
of 1992’s $1.8 billion in revenue, that Dow Jones could
use for other things. It is like having $360 million of free
money…
Capital always comes at a price: From investors or from banks…
Investors and you should care about Return on
Investment…because you can do other
investments with your money (“opportunity
cost”).
 Return on Investment (ROI) =
 Net Cash Flow (NCF) / Invested Capital 
1. Consistent with your revenue model, how soon
can you have customers pay you?
2. How soon do you need to pay supplier and
employees?
3. How much inventory do you need to hold to run
your business effectively?
Business
Model
Element
Analogs and
the numbers
they give you
Antilogs and
numbers
they give you
Leap of Faith
(bets) around
which you
will build
your
dashboard
Hypothesis
that will
prove or
refute your
leaps of faith
Revenue Model
GM Model
Operating
Model
Working Capital
Model
Investment
Model
1. Revenue
2. Gross Margin
3. Operating Expenses
4. Working Capital
5. Investment
Investment means the money you need to start your company…
1. Less investment means giving less of the
company to investors.
2. Less investment means less credibility lost when
you, almost inevitably, declare your Plan A is not
working, and you are switching to Plan B.
3. Less investment means fewer sleepless nights for
you, your employees, supplier, and investors.
How is it possible to need less investment?
1. How much cash you’ll need to get into business,
(including a modest cushion of spare cash to make
one or more transitions from Plan A to Plan B 
Plan N…)
2. How much cash you need to take your company to
break-even cash flow
(so that you don’t need to invest any more, except
perhaps, to grow the business, which by then, has
already been proven viable).
1. Prelaunch Phase:
 What are the hard assets you need, and what will they cost to buy,
rent, or lease?
 What are the development activities to complete, and what will they
cost?
 What are the leaps-of-faith you must test, and what will it cost?
 Which of the above can you delay, find a way to do without, do more
cheaply or simply?
2. Postlaunch Phase (until breakeven):
 What revenue and gross margin can you generate to compensate for
your ongoing costs?
 How lean an operating model can you run?
 Which key leaps of faith, if proven, will signal stepwise reductions in
risk? How much cash will it take to reach each of them, and how
much of your funding can be postponed until later?
Business
Model
Element
Analogs and
the numbers
they give you
Antilogs and
numbers
they give you
Leap of Faith
(bets) around
which you
will build
your
dashboard
Hypothesis
that will
prove or
refute your
leaps of faith
Revenue Model
GM Model
Operating
Model
Working Capital
Model
Investment
Model
For Johnny’s business figure out:
1. How much money does Johnny need from an investor
to start his business so he can earn enough money to
buy a bicycle?
 Goal: 
1. How much time will it take Johnny to buy his bicycle?
 Goal: 
1. How much time would you estimate it will
take YOU to plan Johnny’s business
effectively?

New2 building a business model

  • 1.
    On Building abetter business model Ziya G. Boyacigiller This presentation was created and given by Ziya Boyacigiller who was leading Angel Investor and a loved mentor to many young entrepreneurs in Turkey. We have shared it on the web for everyone’s benefit. It is free to use but please cite Ziya Boyacigiller as the source when you use any part of this presentation. For more about Ziya Boyacigiller’s contributions to the start-up Ecosystem of Turkey, please go to www.ziyaboyacigiller.com
  • 2.
    (Based on Gettingto Plan B, John Mullins, Randy Komisar)
  • 4.
    For Johnny’s businessfigure out: 1. How much money does Johnny need from an investor to start his business so he can earn enough money to buy a bicycle?  Goal:  1. How much time will it take Johnny to buy his bicycle?  Goal:  1. How much time would you estimate it will take YOU to plan Johnny’s business effectively?
  • 5.
    Use evidence tobuild confidence & credibility. Hope is not a strategy !
  • 7.
    Business Model Element Analogs and numbers they provide you Antilogsand numbers they provide you Leap of Faith (bets) around which you will build your dashboard Hypothesis that will prove or refute your leaps of faith Revenue Model GM Model Operating Model Working Capital Model Investment Model
  • 8.
    Ref: Getting toPlan B, J. Mullins / R. Komisar
  • 9.
    The uncertainty thatsurrounds most innovations and most new ventures can be significantly mitigated by comparing the plan on the table to other businesses already in existence.
  • 10.
    Discovering or developinga business model that will work…
  • 11.
    BUSINESS MODEL means the patternof economic activity (cash flowing in and out of your business for various purposes and the timing thereof) that dictates whether or not you run out of cash and whether or not you deliver attractive PROFITS to your investors and yourself.
  • 12.
    ANALOGS to youridea are successful predecessor companies that are worth mimicking in some way. There are many analogs out there, portions of which can be borrowed or adapted to help you understand the economics and various other facets of your proposed business and its business model.
  • 15.
    ANTILOGS are predecessorcompanies compared to which you explicitly choose to do things differently, perhaps because some of what they did has been unsuccessful.
  • 19.
    It is notwhat you know that will likely make you fail, it is “what you don’t know you don’t know”… Identify the questions where analogs and antilogs don’t provide the answers. The questions you cannot answer from historical precedent lead you to your leaps of faith – beliefs you hold about the answers to your questions despite having no real evidence that these beliefs are actually true.
  • 20.
    Ref: Getting toPlan B, J. Mullins / R. Komisar
  • 21.
  • 24.
    Figuring out whatcustomers will buy is a process – not a guess.
  • 25.
    Running out ofcash isn’t a cause – it’s a symptom. It’s a symptom or signal that the company’s business model didn’t work.
  • 26.
    Business Model isthe pattern of economic activity – cash flowing into and out of your business for various purposes and the timing thereof – that dictates whether or not you run out of cash and whether or not you deliver attractive returns to your investors.
  • 27.
    To address yourleaps of faith, you’ll have to leap… that is, experiment.
  • 29.
    A dashboard isa tool that drives an evidence- based process to plan, guide, and track the results of what you learn from your hypothesis testing.
  • 31.
    Leap of Faith Question HypothesisMetrics/T est Findings/Resu lts Insight Gained/Respon se 1. Commuters will stop and buy a refreshing drink made with fresh lemons. 1. At least 10 customers per day will buy 2. At least 20 people will stop and ask for price. Customers/ day Set up on a chair with lemons/sug ar borrowed from Mom… 1. Mon/2, Tue/0 (rained), Wed/8 2. Mon/8, Tue/0, Wed/24 High pricing deters sales, people look but don’t buy; no point setting up if it rains; seems like demand is less than Johnny thought. 2. People will pay a premium price over Coke selling at $1/glass. $1.50 per drink will be acceptable Total customers/ people asking for price Mon/25%, Tue/-, Wed/33% $1.50 looks too high. We need a Plan B.
  • 32.
  • 33.
    TEST – EXPERIMENT… Use your creativity and find a way to prove or disprove your hypothesis before you waste too much of your time or your money.
  • 34.
    Quantify if itis important for you to understand and control it --
  • 35.
    1. Revenue 2. GrossMargin 3. Operating Expenses 4. Working Capital 5. Investment
  • 36.
    1. Revenue 2. GrossMargin 3. Operating Expenses 4. Working Capital 5. Investment
  • 37.
    1. Revenue 2. GrossMargin 3. Operating Expenses 4. Working Capital 5. Investment
  • 39.
  • 40.
    If the customersdon’t BUY and PAY you for what you sell them, you can’t force them to...
  • 41.
    1. Who willbuy? (who is your customer?) 2. What will customers buy? (product/service) 3. What pain are you resolving for customers, or what delight are you offering? (value proposition  important & not-available) 4. How soon, how often will customers buy? (timing model) 5. How much, how many will customers buy? (unit sales model) 6. At what price will customers buy, and on what basis will they pay? (price model) 7. With what effort and cost on your part? (cost of sales)
  • 42.
    Business Model Element Analogs and the numbers theygive you Antilogs and numbers they give you Leap of Faith (bets) around which you will build your dashboard Hypothesis that will prove or refute your leaps of faith Revenue Model $1 / glass $0.75-10gls/d ? GM Model Operating Model Working Capital Model Investment Model
  • 43.
    1. Revenue 2. GrossMargin 3. Operating Expenses 4. Working Capital 5. Investment
  • 45.
     Gross Margin(GM) =  Revenue – Cost of Goods Sold (COGS)  GM % = 100 X { (Revenue – COGS ) / Revenue } Sometimes referred to as Gross Profit… COGS includes all expenses directly related to producing or delivering whatever it is that you sell -- what your customers actually buy . GM ranges from 0% to ~100% Question: What is a good GM% ? What is exceptional GM%?
  • 46.
    How much moneydoes it take for you to build the value for your customers?
  • 47.
    1. “spread” betweenPrice and COGS 2. Managing your product “mix” 3. Your “strategy” (Example: build market-share or profit)
  • 48.
    Business Model Element Analogs and the numbers theygive you Antilogs and numbers they give you Leap of Faith (bets) around which you will build your dashboard Hypothesis that will prove or refute your leaps of faith Revenue Model GM Model Operating Model Working Capital Model Investment Model
  • 49.
    1. Revenue 2. GrossMargin 3. Operating Expenses 4. Working Capital 5. Investment
  • 51.
    Operating Expenses (OPEX)are all the day-to-day cost of doing business (running your business), not included in the costs of goods sold (COGS). Some costs can be included in either COGS or OPEX, and where you include them is a choice you make when you define your accounting system. OPEX are also called “below the line expenses”. Operating expenses are summarized in “chart of accounts” – key expense categories defined for an industry. Every industry has one… Example: Restaurant Industry?
  • 52.
    First, start bygetting a copy of the “chart of accounts” for your industry (and/or your analog/antilog competitors). 1. What level of cost will you incur in each cost category? 2. Which of these costs can be reduced or eliminated? 3. Which of these costs need to be increased or new cost categories created, to execute your planned strategy?
  • 53.
    Business Model Element Analogs and the numbers theygive you Antilogs and numbers they give you Leap of Faith (bets) around which you will build your dashboard Hypothesis that will prove or refute your leaps of faith Revenue Model GM Model Operating Model Working Capital Model Investment Model
  • 54.
    1. Revenue 2. GrossMargin 3. Operating Expenses 4. Working Capital 5. Investment
  • 56.
  • 57.
    Staying in businessover the long term – whether getting past infancy in a new venture, or steering an established company through times of economic crisis – means not running out of cash. Where is “cash balance” found? It is on your balance sheet.
  • 59.
    Working capital isthe cash a company needs to have on hand in the short term to keep the business running – pay its employees, suppliers, etc. Hard truth is when you run out of cash, the game is over – you are out of business ! (Startups call this the “runway” using airport/airplane metaphor, and keep an eye on “burn-rate” and “months to financing”) Timing of cash coming in and going out, “cash flow", is important so you don’t run out of cash.
  • 60.
    1. Current Assets(measured in days) money soon to be available to company such as cash, short-term bank deposits, accounts receivable (money customers owe), and inventories (measured in days) you paid for and can sell. 2. Current Liabilities (measured in days) money soon to be paid by the company such as accounts payable (money you owe suppliers), short term debt. 3.  Working Capital =  Current Assets (+/-Inventories ) – Current Liabilities  QUESTION: Can you achieve Negative Working Capital position?
  • 61.
     NOTE: Non-cashelements only should be used for this analysis. • Current Assets = 37 days • Inventory: 4 days • Accounts Receivable: 33 days (subscribers pay in advance, but advertisers pay arrear, this figure reflects the later) • Current Liabilities = 109 days • Accounts Payable: 70 days • Unearned Subscriptions: 39 days (subscriptions paid for but not yet delivered) • Net of these = --72 days • That’s is 72 days of net free cash, (72/365 days = )20% of 1992’s $1.8 billion in revenue, that Dow Jones could use for other things. It is like having $360 million of free money…
  • 62.
    Capital always comesat a price: From investors or from banks…
  • 63.
    Investors and youshould care about Return on Investment…because you can do other investments with your money (“opportunity cost”).  Return on Investment (ROI) =  Net Cash Flow (NCF) / Invested Capital 
  • 64.
    1. Consistent withyour revenue model, how soon can you have customers pay you? 2. How soon do you need to pay supplier and employees? 3. How much inventory do you need to hold to run your business effectively?
  • 65.
    Business Model Element Analogs and the numbers theygive you Antilogs and numbers they give you Leap of Faith (bets) around which you will build your dashboard Hypothesis that will prove or refute your leaps of faith Revenue Model GM Model Operating Model Working Capital Model Investment Model
  • 66.
    1. Revenue 2. GrossMargin 3. Operating Expenses 4. Working Capital 5. Investment
  • 68.
    Investment means themoney you need to start your company…
  • 69.
    1. Less investmentmeans giving less of the company to investors. 2. Less investment means less credibility lost when you, almost inevitably, declare your Plan A is not working, and you are switching to Plan B. 3. Less investment means fewer sleepless nights for you, your employees, supplier, and investors.
  • 70.
    How is itpossible to need less investment?
  • 71.
    1. How muchcash you’ll need to get into business, (including a modest cushion of spare cash to make one or more transitions from Plan A to Plan B  Plan N…) 2. How much cash you need to take your company to break-even cash flow (so that you don’t need to invest any more, except perhaps, to grow the business, which by then, has already been proven viable).
  • 72.
    1. Prelaunch Phase: What are the hard assets you need, and what will they cost to buy, rent, or lease?  What are the development activities to complete, and what will they cost?  What are the leaps-of-faith you must test, and what will it cost?  Which of the above can you delay, find a way to do without, do more cheaply or simply?
  • 73.
    2. Postlaunch Phase(until breakeven):  What revenue and gross margin can you generate to compensate for your ongoing costs?  How lean an operating model can you run?  Which key leaps of faith, if proven, will signal stepwise reductions in risk? How much cash will it take to reach each of them, and how much of your funding can be postponed until later?
  • 74.
    Business Model Element Analogs and the numbers theygive you Antilogs and numbers they give you Leap of Faith (bets) around which you will build your dashboard Hypothesis that will prove or refute your leaps of faith Revenue Model GM Model Operating Model Working Capital Model Investment Model
  • 75.
    For Johnny’s businessfigure out: 1. How much money does Johnny need from an investor to start his business so he can earn enough money to buy a bicycle?  Goal:  1. How much time will it take Johnny to buy his bicycle?  Goal:  1. How much time would you estimate it will take YOU to plan Johnny’s business effectively?