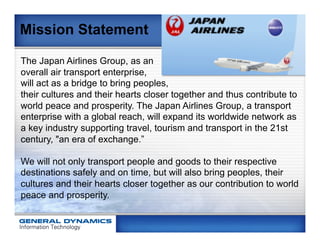
Mission Statement
The JapanAirlines Group, as an
overall air transport enterprise,
will act as a bridge to bring peoples,
their cultures and their hearts closer together and thus contribute to
world peace and prosperity. The Japan Airlines Group, a transport
enterprise with a global reach, will expand its worldwide network as
a key industry supporting travel, tourism and transport in the 21st
century, "an era of exchange.”
We will not only transport people and goods to their respective
destinations safely and on time, but will also bring peoples, their
cultures and their hearts closer together as our contribution to world
peace and prosperity.
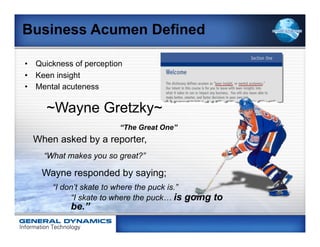
Business Acumen Defined
• Quickness of perception
• Keen insight
• Mental acuteness
~Wayne Gretzky~
“The Great One”
When asked by a reporter,
“What makes you so great?”
Wayne responded by saying;
“I don’t skate to where the puck is.”
“I skate to where the puck… is going to
be.”
5.
Business
Acumen?
• Quickness
of
perception
• Keen
insight
• Mental
acuteness
The image cannot be displayed. Your computer may not have enough memory to open the image, or the image may have been corrupted. Restart your computer, and then open the file again. If the red x still appears, you may have to
delete the image and then insert it again.
Business
Acumen
101
5
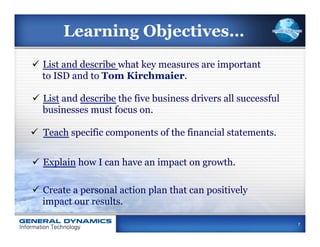
Learning Objectives…
ü Listand describe what key measures are important
to ISD and to Tom Kirchmaier.
ü List and describe the five business drivers all successful
businesses must focus on.
ü Teach specific components of the financial statements.
ü Explain how I can have an impact on growth.
ü Create a personal action plan that can positively
impact our results.
7
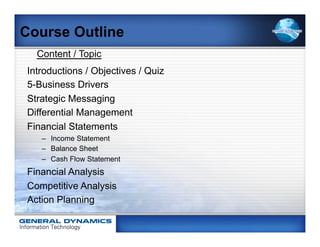
8.
Participant Guide Book
Write name & phone number
on the inside cover.
Write name & department
on the name tent.
8
9.
Welcome
ü Participationis encouraged
ü Please turn off phones, tablets, computers, and/
or any other devices that may distract during the
class.
ü Be sure to sign the roster for class recognition
and post class follow-up.
10.
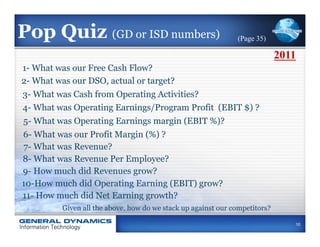
Pop Quiz (GDor ISD numbers) (Page 35)
2011
1- What was our Free Cash Flow?
2- What was our DSO, actual or target?
3- What was Cash from Operating Activities?
4- What was Operating Earnings/Program Profit (EBIT $) ?
5- What was Operating Earnings margin (EBIT %)?
6- What was our Profit Margin (%) ?
7- What was Revenue?
8- What was Revenue Per Employee?
9- How much did Revenues grow?
10-How much did Operating Earning (EBIT) grow?
11- How much did Net Earning growth?
Given all the above, how do we stack up against our competitors?
10
11.
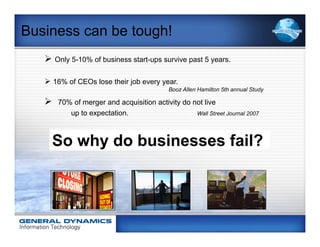
Business can betough!
Ø Only 5-10% of business start-ups survive past 5 years.
Ø 16% of CEOs lose their job every year.
Booz Allen Hamilton 5th annual Study
Ø 70% of merger and acquisition activity do not live
up to expectation. Wall Street Journal 2007
So why do businesses fail?
12.
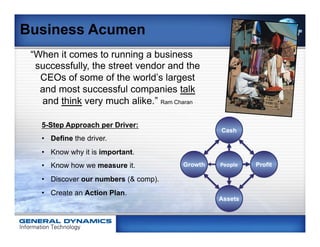
Business Acumen
“Whenit comes to running a business
successfully, the street vendor and the
CEOs of some of the world’s largest
and most successful companies talk
and think very much alike.” Ram Charan
5-Step Approach per Driver:
• Define the driver.
• Know why it is important.
• Know how we measure it.
• Discover our numbers (& comp).
• Create an Action Plan.
13.
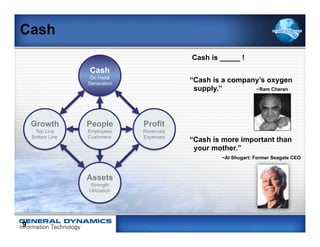
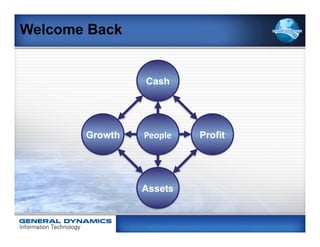
Cash
Cash is _____ !
Cash
On Hand
Generation
“Cash is a company’s oxygen
supply.” ~Ram Charan
Growth People Profit
Top Line Employees Revenues
Bottom Line Customers Expenses
“Cash is more important than
your mother.”
~Al Shugart: Former Seagate CEO
Assets
Strength
Utilization
9
14.
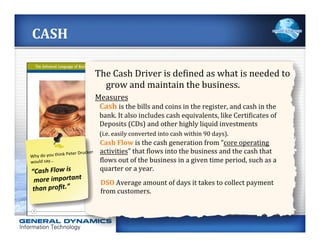
CASH
The
Cash
Driver
is
de;ined
as
what
is
needed
to
grow
and
maintain
the
business.
Measures
Cash
is
the
bills
and
coins
in
the
register,
and
cash
in
the
bank.
It
also
includes
cash
equivalents,
like
Certi;icates
of
Deposits
(CDs)
and
other
highly
liquid
investments
(i.e.
easily
converted
into
cash
within
90
days).
Cash
Flow
is
the
cash
generation
from
“core
operating
Peter
Drucker
activities”
that
;lows
into
the
business
and
the
cash
that
Why
do
you
think
would
say…
;lows
out
of
the
business
in
a
given
time
period,
such
as
a
“Cash
Flow
is
quarter
or
a
year.
more
important
DSO
Average
amount
of
days
it
takes
to
collect
payment
than
profit.”
from
customers.
15.
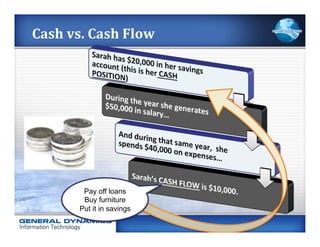
Cash
vs.
Cash
Flow
Pay off loans
Buy furniture
Put it in savings
16.
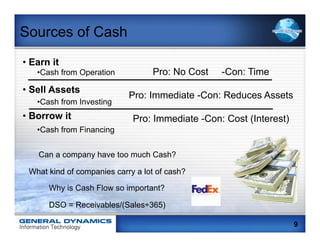
Sources of Cash
• Earn it
• Cash from Operation Pro: No Cost -Con: Time
• Sell Assets
Pro: Immediate -Con: Reduces Assets
• Cash from Investing
• Borrow it Pro: Immediate -Con: Cost (Interest)
• Cash from Financing
Can a company have too much Cash?
What kind of companies carry a lot of cash?
Why is Cash Flow so important?
DSO = Receivables/(Sales÷365)
9
17.
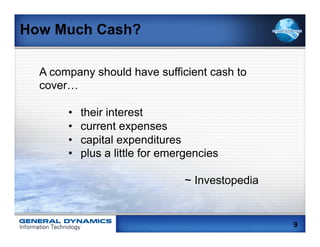
How Much Cash?
A company should have sufficient cash to
cover…
• their interest
• current expenses
• capital expenditures
• plus a little for emergencies
~ Investopedia
9
18.
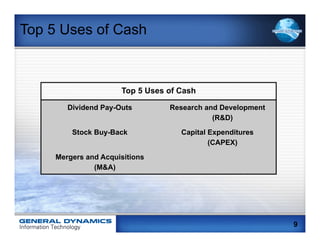
Top 5 Usesof Cash
Top 5 Uses of Cash
Dividend Pay-Outs Research and Development
(R&D)
Stock Buy-Back Capital Expenditures
(CAPEX)
Mergers and Acquisitions
(M&A)
9
19.
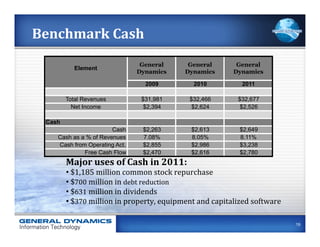
Benchmark
Cash
General General General
Element
Dynamics Dynamics Dynamics
2009 2010 2011
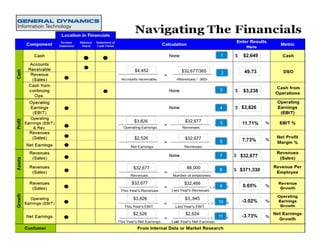
Total Revenues $31,981 $32,466 $32,677
Net Income $2,394 $2,624 $2,526
Cash
Cash $2,263 $2,613 $2,649
Cash as a % of Revenues 7.08% 8.05% 8.11%
Cash from Operating Act. $2,855 $2,986 $3,238
Free Cash Flow $2,470 $2,616 $2,780
Major
uses
of
Cash
in
2011:
•
$1,185
million
common
stock
repurchase
•
$700
million
in
debt
reduction
•
$631
million
in
dividends
•
$370
million
in
property,
equipment
and
capitalized
software
19
20.
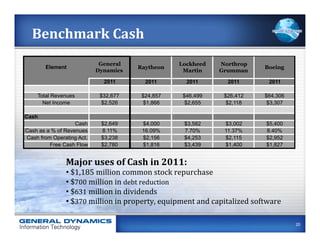
Benchmark
Cash
General Lockheed Northrop
Element Raytheon Boeing
Dynamics Martin Grumman
2011 2011 2011 2011 2011
Total Revenues $32,677 $24,857 $46,499 $26,412 $64,306
Net Income $2,526 $1,866 $2,655 $2,118 $3,307
Cash
Cash $2,649 $4,000 $3,582 $3,002 $5,400
Cash as a % of Revenues 8.11% 16.09% 7.70% 11.37% 8.40%
Cash from Operating Act. $3,238 $2,156 $4,253 $2,115 $2,952
Free Cash Flow $2,780 $1,816 $3,439 $1,400 $1,827
Major
uses
of
Cash
in
2011:
•
$1,185
million
common
stock
repurchase
•
$700
million
in
debt
reduction
•
$631
million
in
dividends
•
$370
million
in
property,
equipment
and
capitalized
software
20
21.
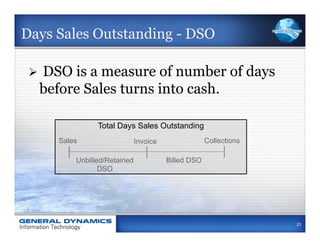
Days Sales Outstanding- DSO
Ø DSO is a measure of number of days
before Sales turns into cash.
Total Days Sales Outstanding
Sales Invoice Collections
Unbilled/Retained Billed DSO
DSO
21
22.
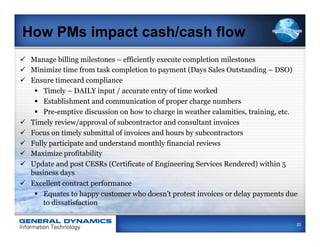
How PMs impactcash/cash flow
ü Manage billing milestones – efficiently execute completion milestones
ü Minimize time from task completion to payment (Days Sales Outstanding – DSO)
ü Ensure timecard compliance
§ Timely – DAILY input / accurate entry of time worked
§ Establishment and communication of proper charge numbers
§ Pre-emptive discussion on how to charge in weather calamities, training, etc.
ü Timely review/approval of subcontractor and consultant invoices
ü Focus on timely submittal of invoices and hours by subcontractors
ü Fully participate and understand monthly financial reviews
ü Maximize profitability
ü Update and post CESRs (Certificate of Engineering Services Rendered) within 5
business days
ü Excellent contract performance
§ Equates to happy customer who doesn’t protest invoices or delay payments due
to dissatisfaction
22
23.
Impacting the CashDriver
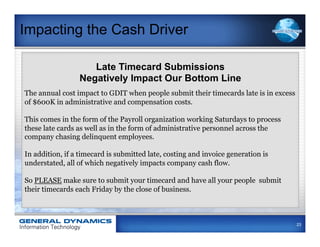
Late Timecard Submissions
Negatively Impact Our Bottom Line
The annual cost impact to GDIT when people submit their timecards late is in excess
of $600K in administrative and compensation costs.
This comes in the form of the Payroll organization working Saturdays to process
these late cards as well as in the form of administrative personnel across the
company chasing delinquent employees.
In addition, if a timecard is submitted late, costing and invoice generation is
understated, all of which negatively impacts company cash flow.
So PLEASE make sure to submit your timecard and have all your people submit
their timecards each Friday by the close of business.
23
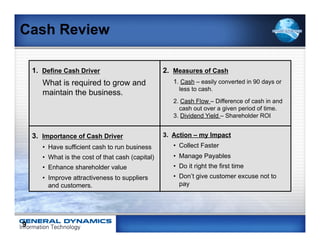
Cash Review
1. Define Cash Driver 2. Measures of Cash
What is required to grow and 1. Cash – easily converted in 90 days or
less to cash.
maintain the business.
2. Cash Flow – Difference of cash in and
cash out over a given period of time.
3. Dividend Yield – Shareholder ROI
3. Importance of Cash Driver 3. Action – my Impact
• Have sufficient cash to run business • Collect Faster
• What is the cost of that cash (capital) • Manage Payables
• Enhance shareholder value • Do it right the first time
• Improve attractiveness to suppliers • Don’t give customer excuse not to
and customers. pay
9
26.
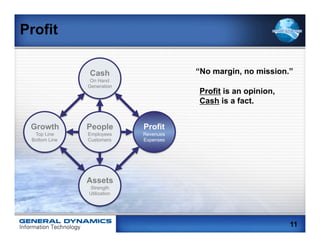
Profit
Cash “No margin, no mission.”
On Hand
Generation
Profit is an opinion,
Cash is a fact.
Growth People Profit
Top Line Employees Revenues
Bottom Line Customers Expenses
Assets
Strength
Utilization
11
27.
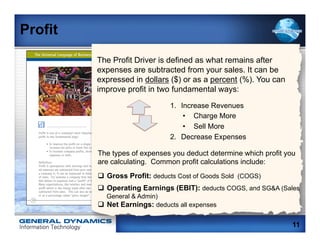
Profit
The Profit Driver is defined as what remains after
expenses are subtracted from your sales. It can be
expressed in dollars ($) or as a percent (%). You can
improve profit in two fundamental ways:
1. Increase Revenues
• Charge More
• Sell More
2. Decrease Expenses
The types of expenses you deduct determine which profit you
are calculating. Common profit calculations include:
q Gross Profit: deducts Cost of Goods Sold (COGS)
q Operating Earnings (EBIT): deducts COGS, and SG&A (Sales
General & Admin)
q Net Earnings: deducts all expenses
11
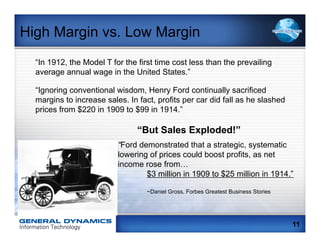
High Margin vs.Low Margin
“In 1912, the Model T for the first time cost less than the prevailing
average annual wage in the United States.”
“Ignoring conventional wisdom, Henry Ford continually sacrificed
margins to increase sales. In fact, profits per car did fall as he slashed
prices from $220 in 1909 to $99 in 1914.”
“But Sales Exploded!”
“Ford demonstrated that a strategic, systematic
lowering of prices could boost profits, as net
income rose from…
$3 million in 1909 to $25 million in 1914.”
~Daniel Gross, Forbes Greatest Business Stories
11
30.
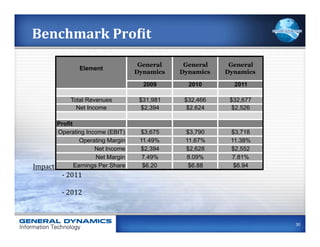
Benchmark
ProCit
General General General
Element
Dynamics Dynamics Dynamics
2009 2010 2011
Total Revenues $31,981 $32,466 $32,677
Net Income $2,394 $2,624 $2,526
Profit
Operating Income (EBIT) $3,675 $3,790 $3,718
Operating Margin 11.49% 11.67% 11.38%
Net Income $2,394 $2,628 $2,552
Net Margin 7.49% 8.09% 7.81%
Impact
to
Pro;it:
Reduce
Share and
drive
operational
excellence
$6.94
Earnings Per costs
$6.20 $6.88
-‐
2011
-‐
2012
30
31.
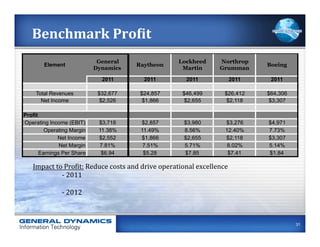
Benchmark
ProCit
General Lockheed Northrop
Element Raytheon Boeing
Dynamics Martin Grumman
2011 2011 2011 2011 2011
Total Revenues $32,677 $24,857 $46,499 $26,412 $64,306
Net Income $2,526 $1,866 $2,655 $2,118 $3,307
Profit
Operating Income (EBIT) $3,718 $2,857 $3,980 $3,276 $4,971
Operating Margin 11.38% 11.49% 8.56% 12.40% 7.73%
Net Income $2,552 $1,866 $2,655 $2,118 $3,307
Net Margin 7.81% 7.51% 5.71% 8.02% 5.14%
Earnings Per Share $6.94 $5.28 $7.85 $7.41 $1.84
Impact
to
Pro;it:
Reduce
costs
and
drive
operational
excellence
-‐
2011
-‐
2012
31
32.
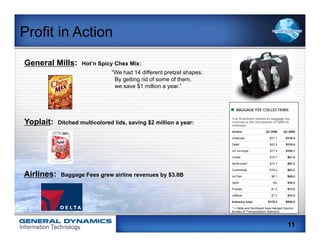
Profit in Action
GeneralMills: Hot’n Spicy Chex Mix:
“We had 14 different pretzel shapes.
By getting rid of some of them,
we save $1 million a year.”
Yoplait: Ditched multicolored lids, saving $2 million a year:
Airlines: Baggage Fees grew airline revenues by $3.8B
11
33.
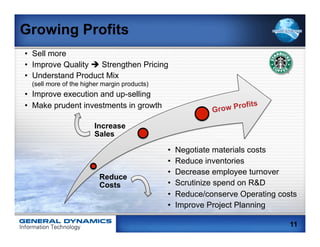
Growing Profits
• Sellmore
• Improve Quality è Strengthen Pricing
• Understand Product Mix
(sell more of the higher margin products)
• Improve execution and up-selling
• Make prudent investments in growth fits
Gr ow Pro
Increase
Sales
• Negotiate materials costs
• Reduce inventories
• Decrease employee turnover
Reduce
Costs • Scrutinize spend on R&D
• Reduce/conserve Operating costs
• Improve Project Planning
11
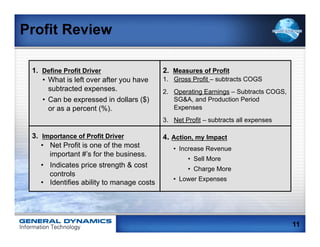
Profit Review
1.Define Profit Driver 2. Measures of Profit
• What is left over after you have 1. Gross Profit – subtracts COGS
subtracted expenses. 2. Operating Earnings – Subtracts COGS,
• Can be expressed in dollars ($) SG&A, and Production Period
or as a percent (%). Expenses
3. Net Profit – subtracts all expenses
3. Importance of Profit Driver 4. Action, my Impact
• Net Profit is one of the most • Increase Revenue
important #’s for the business.
• Sell More
• Indicates price strength & cost • Charge More
controls
• Lower Expenses
• Identifies ability to manage costs
11
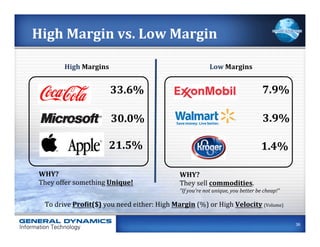
36.
High
Margin
vs.
Low
Margin
High
Margins
Low
Margins
33.6%
7.9%
30.0%
3.9%
21.5%
1.4%
WHY?
WHY?
They
offer
something
Unique!
They
sell
commodities.
“If
you’re
not
unique,
you
better
be
cheap!”
To
drive
ProCit($)
you
need
either:
High
Margin
(%)
or
High
Velocity
(Volume)
36
37.
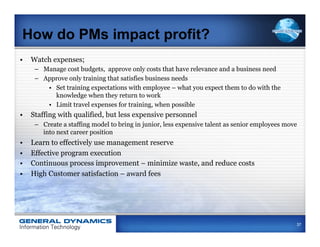
How do PMsimpact profit?
• Watch expenses;
– Manage cost budgets, approve only costs that have relevance and a business need
– Approve only training that satisfies business needs
• Set training expectations with employee – what you expect them to do with the
knowledge when they return to work
• Limit travel expenses for training, when possible
• Staffing with qualified, but less expensive personnel
– Create a staffing model to bring in junior, less expensive talent as senior employees move
into next career position
• Learn to effectively use management reserve
• Effective program execution
• Continuous process improvement – minimize waste, and reduce costs
• High Customer satisfaction – award fees
37
38.
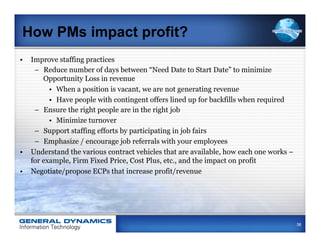
How PMs impactprofit?
• Improve staffing practices
– Reduce number of days between “Need Date to Start Date” to minimize
Opportunity Loss in revenue
• When a position is vacant, we are not generating revenue
• Have people with contingent offers lined up for backfills when required
– Ensure the right people are in the right job
• Minimize turnover
– Support staffing efforts by participating in job fairs
– Emphasize / encourage job referrals with your employees
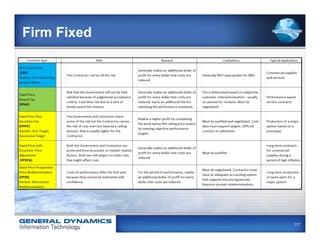
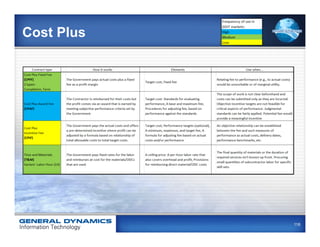
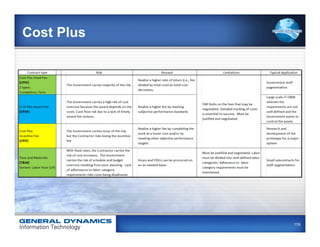
• Understand the various contract vehicles that are available, how each one works –
for example, Firm Fixed Price, Cost Plus, etc., and the impact on profit
• Negotiate/propose ECPs that increase profit/revenue
38
39.
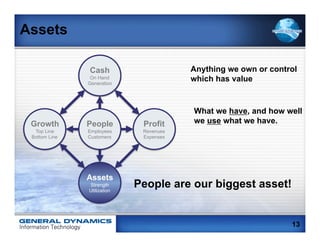
Assets
Cash Anything we own or control
On Hand
Generation
which has value
What we have, and how well
Growth People Profit we use what we have.
Top Line Employees Revenues
Bottom Line Customers Expenses
Assets
Strength
Utilization
People are our biggest asset!
13
40.
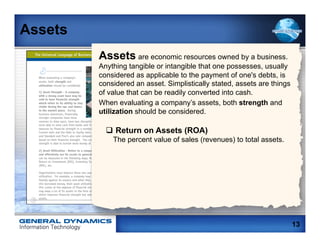
Assets
Assets are economic resources owned by a business.
Anything tangible or intangible that one possesses, usually
considered as applicable to the payment of one's debts, is
considered an asset. Simplistically stated, assets are things
of value that can be readily converted into cash.
When evaluating a company’s assets, both strength and
utilization should be considered.
q Return on Assets (ROA)
The percent value of sales (revenues) to total assets.
13
41.
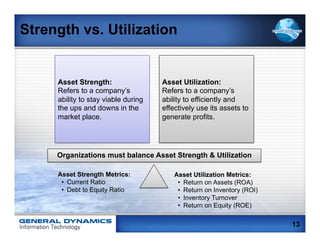
Strength vs. Utilization
Asset Strength: Asset Utilization:
Refers to a company’s Refers to a company’s
ability to stay viable during ability to efficiently and
the ups and downs in the effectively use its assets to
market place. generate profits.
Organizations must balance Asset Strength & Utilization
Asset Strength Metrics: Asset Utilization Metrics:
• Current Ratio • Return on Assets (ROA)
• Debt to Equity Ratio • Return on Inventory (ROI)
• Inventory Turnover
• Return on Equity (ROE)
13
42.
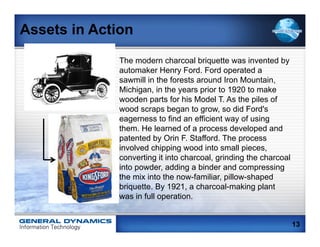
Assets in Action
The modern charcoal briquette was invented by
automaker Henry Ford. Ford operated a
sawmill in the forests around Iron Mountain,
Michigan, in the years prior to 1920 to make
wooden parts for his Model T. As the piles of
wood scraps began to grow, so did Ford's
eagerness to find an efficient way of using
them. He learned of a process developed and
patented by Orin F. Stafford. The process
involved chipping wood into small pieces,
converting it into charcoal, grinding the charcoal
into powder, adding a binder and compressing
the mix into the now-familiar, pillow-shaped
briquette. By 1921, a charcoal-making plant
was in full operation.
13
43.
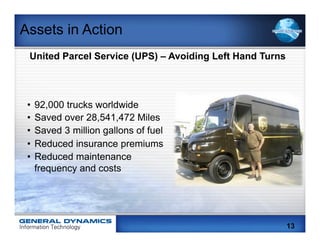
Assets in Action
United Parcel Service (UPS) – Avoiding Left Hand Turns
• 92,000 trucks worldwide
• Saved over 28,541,472 Miles
• Saved 3 million gallons of fuel
• Reduced insurance premiums
• Reduced maintenance
frequency and costs
13
44.
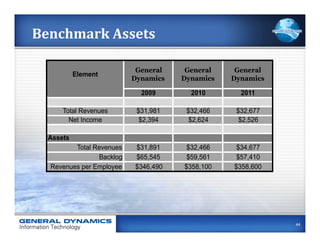
Benchmark
Assets
General General General
Element
Dynamics Dynamics Dynamics
2009 2010 2011
Total Revenues $31,981 $32,466 $32,677
Net Income $2,394 $2,624 $2,526
Assets
Total Revenues $31,891 $32,466 $34,677
Backlog $65,545 $59,561 $57,410
Revenues per Employee $346,490 $358,100 $358,600
44
45.
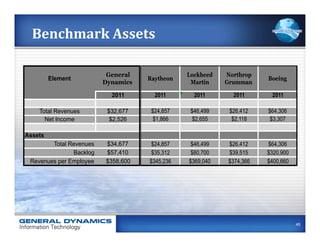
Benchmark
Assets
General Lockheed Northrop
Element Raytheon Boeing
Dynamics Martin Grumman
2011 2011 2011 2011 2011
Total Revenues $32,677 $24,857 $46,499 $26,412 $64,306
Net Income $2,526 $1,866 $2,655 $2,118 $3,307
Assets
Total Revenues $34,677 $24,857 $46,499 $26,412 $64,306
Backlog $57,410 $35,312 $80,700 $39,515 $320,900
Revenues per Employee $358,600 $345,236 $369,040 $374,366 $400,660
45
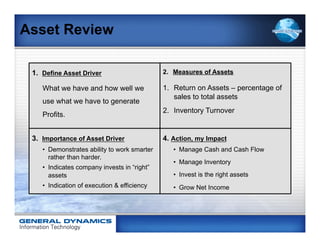
Asset Review
1.Define Asset Driver 2. Measures of Assets
What we have and how well we 1. Return on Assets – percentage of
sales to total assets
use what we have to generate
2. Inventory Turnover
Profits.
3. Importance of Asset Driver 4. Action, my Impact
• Demonstrates ability to work smarter • Manage Cash and Cash Flow
rather than harder.
• Manage Inventory
• Indicates company invests in “right”
assets • Invest is the right assets
• Indication of execution & efficiency • Grow Net Income
48.
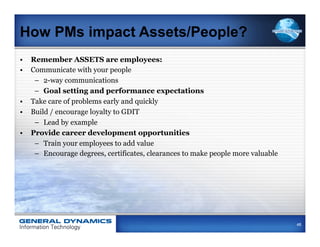
How PMs impactAssets/People?
• Remember ASSETS are employees:
• Communicate with your people
– 2-way communications
– Goal setting and performance expectations
• Take care of problems early and quickly
• Build / encourage loyalty to GDIT
– Lead by example
• Provide career development opportunities
– Train your employees to add value
– Encourage degrees, certificates, clearances to make people more valuable
48
49.
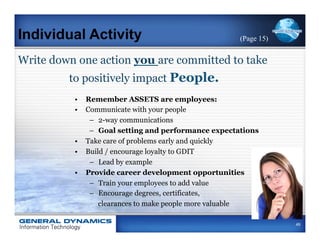
Individual Activity (Page 15)
Write down one action you are committed to take
to positively impact People.
• Remember ASSETS are employees:
• Communicate with your people
– 2-way communications
– Goal setting and performance expectations
• Take care of problems early and quickly
• Build / encourage loyalty to GDIT
– Lead by example
• Provide career development opportunities
– Train your employees to add value
– Encourage degrees, certificates,
clearances to make people more valuable
49
50.
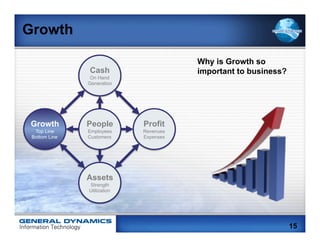
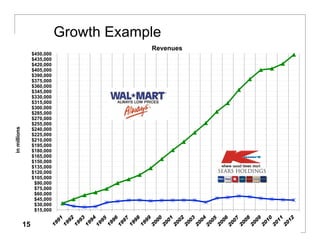
Growth
Why is Growth so
Cash important to business?
On Hand
Generation
Growth People Profit
Top Line Employees Revenues
Bottom Line Customers Expenses
Assets
Strength
Utilization
15
51.
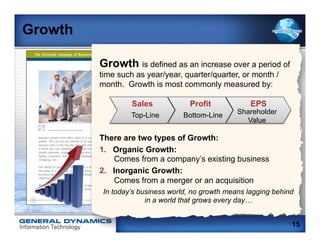
Growth
Growth is defined as an increase over a period of
time such as year/year, quarter/quarter, or month /
month. Growth is most commonly measured by:
Sales Profit EPS
Top-Line Bottom-Line Shareholder
Value
There are two types of Growth:
1. Organic Growth:
Comes from a company’s existing business
2. Inorganic Growth:
Comes from a merger or an acquisition
In today’s business world, no growth means lagging behind
in a world that grows every day…
15
52.
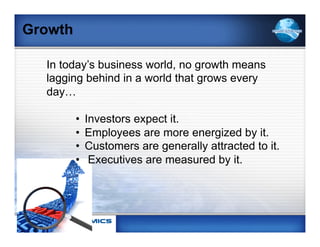
Growth
Intoday’s business world, no growth means
lagging behind in a world that grows every
day…
• Investors expect it.
• Employees are more energized by it.
• Customers are generally attracted to it.
• Executives are measured by it.
53.
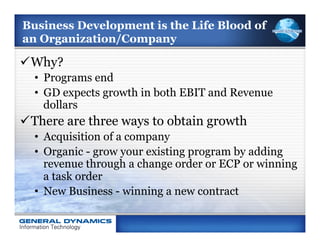
Business Development isthe Life Blood of
an Organization/Company
ü Why?
• Programs end
• GD expects growth in both EBIT and Revenue
dollars
ü There are three ways to obtain growth
• Acquisition of a company
• Organic - grow your existing program by adding
revenue through a change order or ECP or winning
a task order
• New Business - winning a new contract
54.
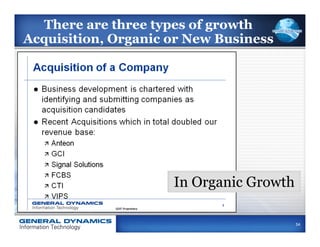
There are threetypes of growth
Acquisition, Organic or New Business
In Organic Growth
54
55.
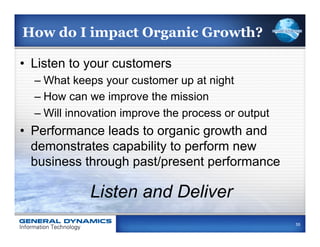
How do Iimpact Organic Growth?
• Listen to your customers
– What keeps your customer up at night
– How can we improve the mission
– Will innovation improve the process or output
• Performance leads to organic growth and
demonstrates capability to perform new
business through past/present performance
Listen and Deliver
55
56.
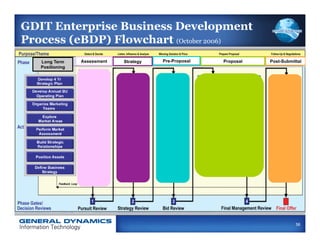
GDIT Enterprise BusinessDevelopment
Process (eBDP) Flowchart (October 2006)
Long Term Assessment Strategy Pre-Proposal Proposal Post-Submittal
Positioning
56
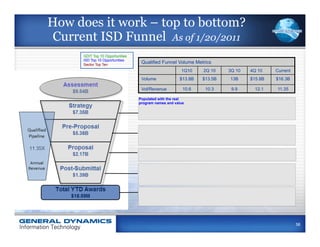
How does itwork – top to bottom?
Current ISD Funnel As of 1/20/2011
GDIT Top 10 Opportunities
ISD Top 10 Opportunities
Sector Top Ten
Qualified Funnel Volume Metrics
1Q10 2Q 10 3Q 10 4Q 10 Current
Volume $13.8B $13.5B 13B $15.8B $16.3B
Vol/Revenue 10.6 10.3 9.9 12.1 11.35
Populated with the real
program names and value
58
Program Manager Roleand
Responsibility in BD Process
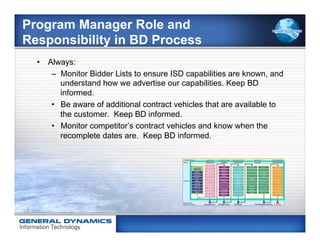
• Always:
– Monitor Bidder Lists to ensure ISD capabilities are known, and
understand how we advertise our capabilities. Keep BD
informed.
• Be aware of additional contract vehicles that are available to
the customer. Keep BD informed.
• Monitor competitor’s contract vehicles and know when the
recomplete dates are. Keep BD informed.
61.
Program Manager Roleand
Responsibility in BD Process (cont.)
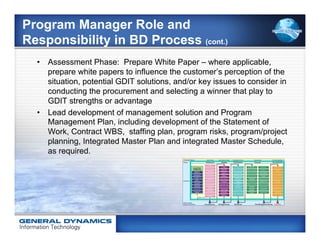
• Assessment Phase: Prepare White Paper – where applicable,
prepare white papers to influence the customer’s perception of the
situation, potential GDIT solutions, and/or key issues to consider in
conducting the procurement and selecting a winner that play to
GDIT strengths or advantage
• Lead development of management solution and Program
Management Plan, including development of the Statement of
Work, Contract WBS, staffing plan, program risks, program/project
planning, Integrated Master Plan and integrated Master Schedule,
as required.
62.
Program Manager Roleand
Responsibility in BD Process (cont.)
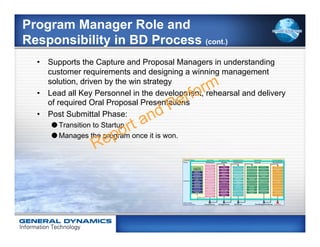
• Supports the Capture and Proposal Managers in understanding
customer requirements and designing a winning management
solution, driven by the win strategy
• Lead all Key Personnel in the development, rehearsal and delivery
of required Oral Proposal Presentations
• Post Submittal Phase:
Transition to Startup
Manages the program once it is won.
63.
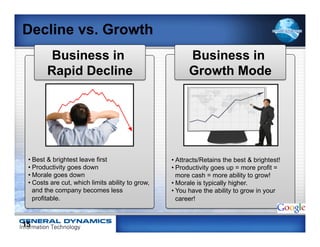
Decline vs. Growth
Business in Business in
Rapid Decline Growth Mode
• Best & brightest leave first • Attracts/Retains the best & brightest!
• Productivity goes down • Productivity goes up = more profit =
• Morale goes down more cash = more ability to grow!
• Costs are cut, which limits ability to grow, • Morale is typically higher.
and the company becomes less • You have the ability to grow in your
profitable. career!
15
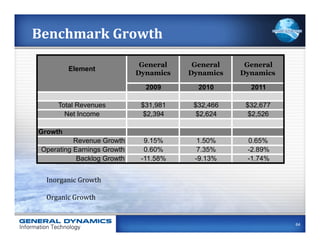
64.
Benchmark
Growth
General General General
Element
Dynamics Dynamics Dynamics
2009 2010 2011
Total Revenues $31,981 $32,466 $32,677
How do we compare?
Net Income $2,394 $2,624 $2,526
Growth
Revenue Growth 9.15% 1.50% 0.65%
Operating Earnings Growth 0.60% 7.35% -2.89%
Backlog Growth -11.58% -9.13% -1.74%
Inorganic
Growth
Organic
Growth
64
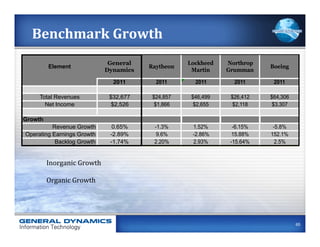
65.
Benchmark
Growth
General Lockheed Northrop
Element Raytheon Boeing
Dynamics Martin Grumman
2011 2011 2011 2011 2011
Total Revenues $32,677 $24,857 $46,499 $26,412 $64,306
Net Income $2,526 $1,866 $2,655 $2,118 $3,307
How do we compare?
Growth
Revenue Growth 0.65% -1.3% 1.52% -6.15% -5.8%
Operating Earnings Growth -2.89% 9.6% -2.86% 15.88% 152.1%
Backlog Growth -1.74% 2.20% 2.93% -15.64% 2.5%
Inorganic
Growth
Organic
Growth
65
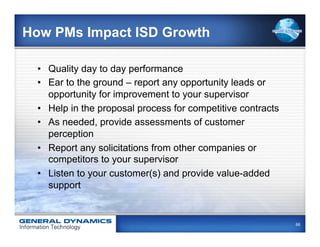
66.
How PMs ImpactISD Growth
• Quality day to day performance
• Ear to the ground – report any opportunity leads or
opportunity for improvement to your supervisor
• Help in the proposal process for competitive contracts
• As needed, provide assessments of customer
perception
• Report any solicitations from other companies or
competitors to your supervisor
• Listen to your customer(s) and provide value-added
support
66
67.
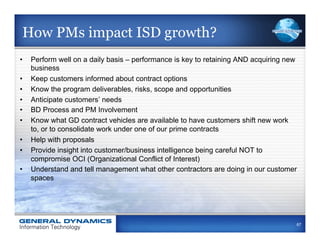
How PMs impactISD growth?
• Perform well on a daily basis – performance is key to retaining AND acquiring new
business
• Keep customers informed about contract options
• Know the program deliverables, risks, scope and opportunities
• Anticipate customers’ needs
• BD Process and PM Involvement
• Know what GD contract vehicles are available to have customers shift new work
to, or to consolidate work under one of our prime contracts
• Help with proposals
• Provide insight into customer/business intelligence being careful NOT to
compromise OCI (Organizational Conflict of Interest)
• Understand and tell management what other contractors are doing in our customer
spaces
67
Growth Review
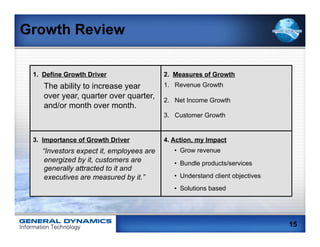
1.Define Growth Driver 2. Measures of Growth
The ability to increase year 1. Revenue Growth
over year, quarter over quarter, 2. Net Income Growth
and/or month over month.
3. Customer Growth
3. Importance of Growth Driver 4. Action, my Impact
“Investors expect it, employees are • Grow revenue
energized by it, customers are • Bundle products/services
generally attracted to it and
executives are measured by it.” • Understand client objectives
• Solutions based
15
70.
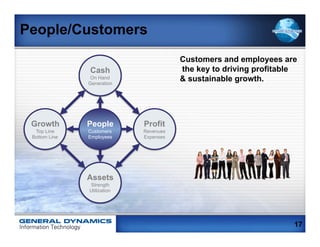
People/Customers
Customers and employees are
Cash the key to driving profitable
On Hand
Generation
& sustainable growth.
Growth People Profit
Top Line Customers Revenues
Bottom Line Employees Expenses
Assets
Strength
Utilization
17
71.
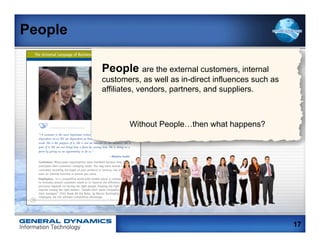
People
People are the external customers, internal
customers, as well as in-direct influences such as
affiliates, vendors, partners, and suppliers.
Without People…then what happens?
17
72.
People
“Culture eats strategy for breakfast!”
~Peter Drucker
17
73.
Internal People
A’shire A+’s and B’s hire C’s
What is the #1 reason a person
will leave a company?
17
74.
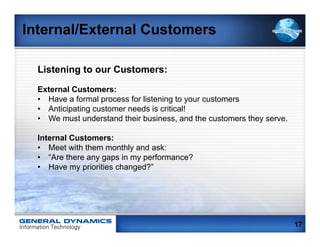
Internal/External Customers
Listening to our Customers:
External Customers:
• Have a formal process for listening to your customers
• Anticipating customer needs is critical!
• We must understand their business, and the customers they serve.
Internal Customers:
• Meet with them monthly and ask:
• “Are there any gaps in my performance?
• Have my priorities changed?”
17
75.
External People
“If Iwould have asked
my customers what
they wanted, they
would have told me a
faster horse!”
Henry Ford
17
76.
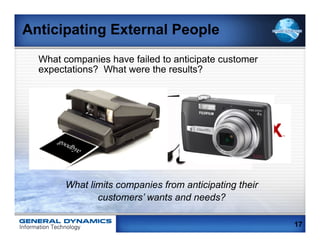
Anticipating External People
What companies have failed to anticipate customer
expectations? What were the results?
What limits companies from anticipating their
customers’ wants and needs?
17
77.
Listen to yourcustomers!
The #1 reason for rework or
losing an opportunity is
not listening to your customer.
BD Process and Program Manager Involvement
January 2011
77
78.
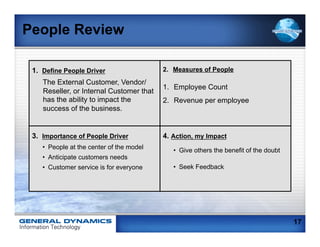
People Review
1.Define People Driver 2. Measures of People
The External Customer, Vendor/
1. Employee Count
Reseller, or Internal Customer that
has the ability to impact the 2. Revenue per employee
success of the business.
3. Importance of People Driver 4. Action, my Impact
• People at the center of the model • Give others the benefit of the doubt
• Anticipate customers needs
• Customer service is for everyone • Seek Feedback
17
79.
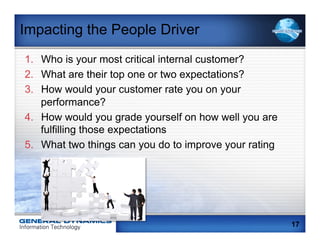
Impacting the PeopleDriver
1. Who is your most critical internal customer?
2. What are their top one or two expectations?
3. How would your customer rate you on your
performance?
4. How would you grade yourself on how well you are
fulfilling those expectations
5. What two things can you do to improve your rating
17
80.
Impacting the PeopleDriver
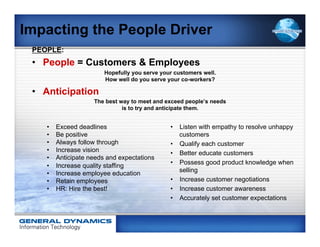
PEOPLE:
• People = Customers & Employees
Hopefully you serve your customers well.
How well do you serve your co-workers?
• Anticipation
The best way to meet and exceed people’s needs
is to try and anticipate them.
• Exceed deadlines • Listen with empathy to resolve unhappy
• Be positive customers
• Always follow through • Qualify each customer
• Increase vision • Better educate customers
• Anticipate needs and expectations
• Possess good product knowledge when
• Increase quality staffing
selling
• Increase employee education
• Retain employees • Increase customer negotiations
• HR: Hire the best! • Increase customer awareness
• Accurately set customer expectations
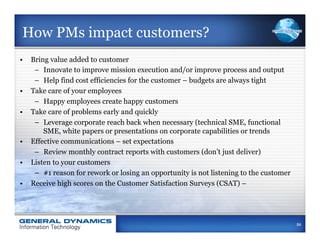
How PMs impactcustomers?
• Bring value added to customer
– Innovate to improve mission execution and/or improve process and output
– Help find cost efficiencies for the customer – budgets are always tight
• Take care of your employees
– Happy employees create happy customers
• Take care of problems early and quickly
– Leverage corporate reach back when necessary (technical SME, functional
SME, white papers or presentations on corporate capabilities or trends
• Effective communications – set expectations
– Review monthly contract reports with customers (don’t just deliver)
• Listen to your customers
– #1 reason for rework or losing an opportunity is not listening to the customer
• Receive high scores on the Customer Satisfaction Surveys (CSAT) –
84
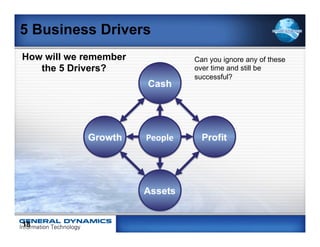
5 Business Drivers
Howwill we remember Can you ignore any of these
the 5 Drivers? over time and still be
successful?
18
87.
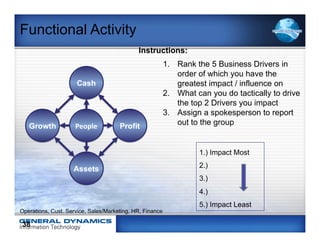
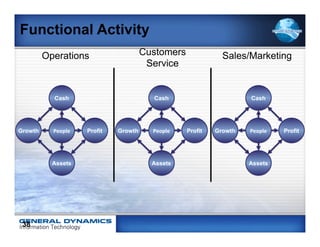
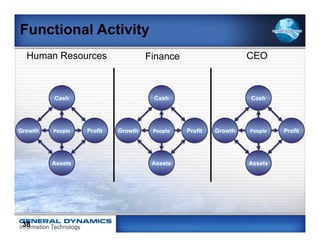
Functional Activity
Instructions:
1. Rank the 5 Business Drivers in
order of which you have the
greatest impact / influence on
2. What can you do tactically to drive
the top 2 Drivers you impact
3. Assign a spokesperson to report
out to the group
1.) Impact Most
2.)
3.)
4.)
5.) Impact Least
Operations, Cust. Service, Sales/Marketing, HR, Finance
38
Preparation for Tomorrow
1. Come ready to teach one of the 5 Drivers to your
group
2. Come ready to learn and teach all three financial
statements
3. We will be doing analysis on one of the
competitor/benchmark entities….choose which
one you would like to analyze (Boeing, Raytheon,
Northrop Grumman, Lockheed Martin)
Day 1 Quiz
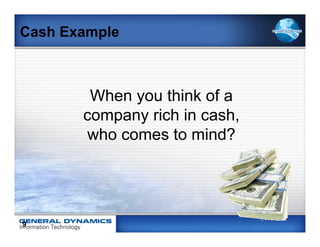
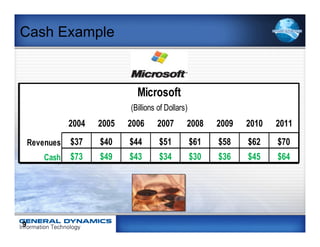
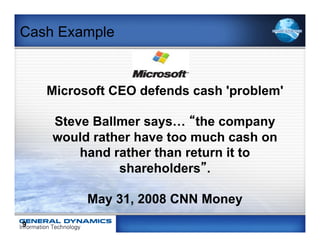
Cash Example
Microsoft CEO defends cash 'problem'
Steve Ballmer says… “the company
would rather have too much cash on
hand rather than return it to
shareholders”.
May 31, 2008 CNN Money
9
95.
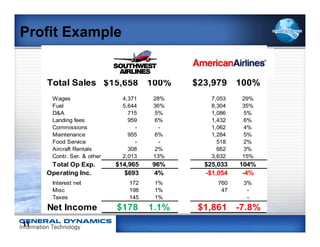
Profit Example
Company A Company B
2011 2011
Total Sales $15,658 100% $23,979 100%
Wages 4,371 28% 7,053 29%
Fuel 5,644 36% 8,304 35%
D&A 715 5% 1,086 5%
Landing fees 959 6% 1,432 6%
Commissions - - 1,062 4%
Maintenance 955 6% 1,284 5%
Food Service - - 518 2%
Aircraft Rentals 308 2% 662 3%
Contr. Ser. & other 2,013 13% 3,632 15%
Total Op Exp. $14,965 96% $25,033 104%
Operating Inc. $693 4% -$1,054 -4%
Interest net 172 1% 760 3%
Misc 198 1% 47 -
Taxes 145 1% -
Net Income $178 1.1% $1,861 -7.8%
11
96.
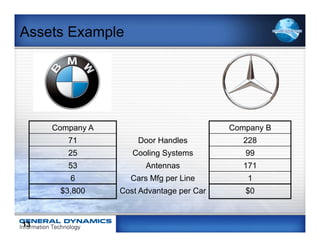
Assets Example
Company A Company B
71 Door Handles 228
25 Cooling Systems 99
53 Antennas 171
6 Cars Mfg per Line 1
$3,800 Cost Advantage per Car $0
13
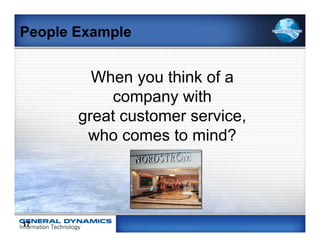
People Example
When you think of a
company with
great customer service,
who comes to mind?
17
99.
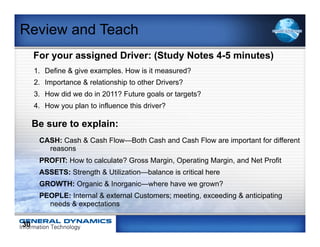
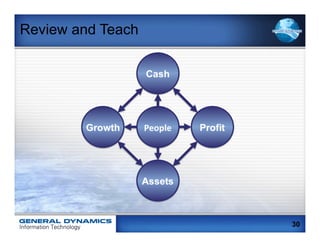
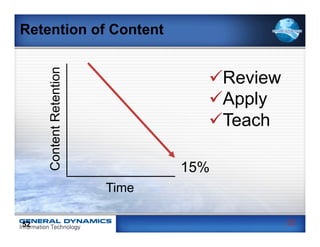
Review and Teach
For your assigned Driver: (Study Notes 4-5 minutes)
1. Define & give examples. How is it measured?
2. Importance & relationship to other Drivers?
3. How did we do in 2011? Future goals or targets?
4. How you plan to influence this driver?
Be sure to explain:
CASH: Cash & Cash Flow—Both Cash and Cash Flow are important for different
reasons
PROFIT: How to calculate? Gross Margin, Operating Margin, and Net Profit
ASSETS: Strength & Utilization—balance is critical here
GROWTH: Organic & Inorganic—where have we grown?
PEOPLE: Internal & external Customers; meeting, exceeding & anticipating
needs & expectations
30
100.
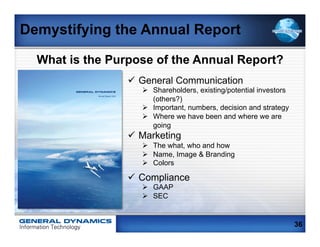
Demystifying the AnnualReport
What is the Purpose of the Annual Report?
ü General Communication
GENERAL DYNAMICS Ø Shareholders, existing/potential investors
(others?)
Annual Report 2011
Ø Important, numbers, decision and strategy
Ø Where we have been and where we are
going
ü Marketing
Ø The what, who and how
Ø Name, Image & Branding
Ø Colors
ü Compliance
Ø GAAP
Ø SEC
36
101.
Executive Communication
• FinancialHi-lights
• To Our Shareholders GENERAL DYNAMICS
Annual Report 2011
• Strategic Overview
• Financial Statement
• Income Statement
• Balance Sheet
• Statement of Cash Flows
• Notes to the Financial Section
36 22
102.
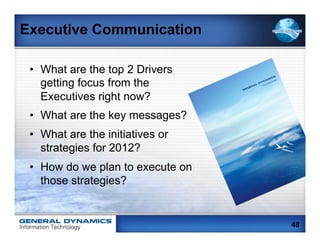
Executive Communication
• What are the top 2 Drivers
getting focus from the
Executives right now?
• What are the key messages?
• What are the initiatives or
strategies for 2012?
• How do we plan to execute on
those strategies?
48
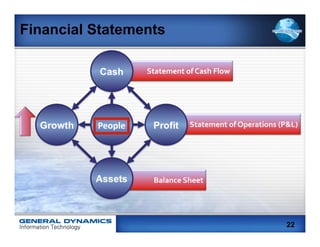
Financial Statements
Statement
of
Cash
Flow
Statement
of
Operations
(P&L)
Balance
Sheet
22
105.
Financial Statements
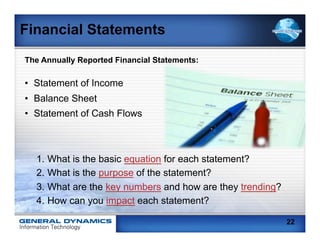
The AnnuallyReported Financial Statements:
• Statement of Income
• Balance Sheet
• Statement of Cash Flows
1. What is the basic equation for each statement?
2. What is the purpose of the statement?
3. What are the key numbers and how are they trending?
4. How can you impact each statement?
22
106.
ITEM 8. FINANCIALSTATEMENTS AND SUPPLEMENTARY DATA
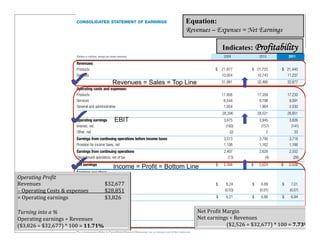
CONSOLIDATED STATEMENT OF EARNINGS Equation:
Revenues – Expenses = Net Earnings
Income
Statement
Indicates: Profitability
Y e ar E nd e d D ec e m b e r 3 1
(Dollars in millions, except per-share amounts) 2009 2010 2011
Revenues:
Products $ 21,977 $ 21,723 $ 21,440
Services 10,004 10,743 11,237
Revenues = Sales = Top Line 31,981 32,466 32,677
Operating costs and expenses:
Products 17,808 17,359 17,230
Services 8,544 9,198 9,591
General and administrative 1,954 1,964 2,030
28,306 28,521 28,851
Operating earnings EBIT 3,675 3,945 3,826
Interest, net (160) (157) (141)
Other, net (2) 2 33
Earnings from continuing operations before income taxes 3,513 3,790 3,718
Provision for income taxes, net 1,106 1,162 1,166
Earnings from continuing operations 2,407 2,628 2,552
Discontinued operations, net of tax (13) (4) (26)
Net earnings $ 2,394 $ 2,624 $ 2,526
Income = Profit = Bottom Line
Earnings per share
Operating
Pro:it
Basic:
Revenues
operations
Continuing
$32,677
$ 6.24 $ 6.89 $ 7.01
–
Operating
Costs
&
expenses Discontinued operations
$28,851
(0.03) (0.01) (0.07)
=
Operating
earnings
Net
earnings
$3,826
$ 6.21 $ 6.88 $ 6.94
Diluted:
Turning
into
a
%
Continuing operations Net
Pro;it
M6.20
$ argin
$ 6.82 $ 6.94
Discontinued operations (0.03)Revenues
(0.01)
Net
earnings
÷
(0.07)
Operating
earnings
÷
Revenues
Net earnings
($3,826
÷
$32,677)
*
100
=
11.71%
$
6.17
($2,526
÷
$32,677)
*
100
=6.87
$ 6.81 $
7.73%
106
The accompanying Notes to Consolidated Financial Statements are an integral part of this statement.
107.
ITEM 8. FINANCIALSTATEMENTS AND SUPPLEMENTARY DATA
ITEM 8. FINANCIAL STATEMENTS AND SUPPLEMENTARY DATA
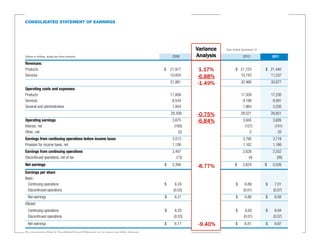
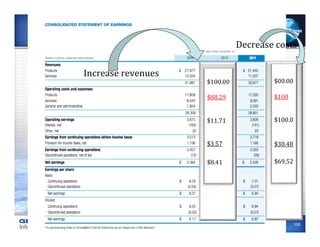
CONSOLIDATED STATEMENT OF EARNINGS OF EARNINGS
CONSOLIDATED STATEMENT
Variance
Year Ended December 31 Year Ended December 31
(Dollars in millions, except per-share amounts)
(Dollars in millions, except per-share amounts) 2009 Analysis
2009
2010 2011
2010 2011
Revenues: Revenues:
Products Products $ 21,977 1.17%
$$ 21,977
21,723 $ 21,440
$ 21,723 $ 21,440
Services Services 10,004 10,004
10,743
-6.88% 11,237
10,743 11,237
31,981 31,981
32,466
-1.49% 32,677
32,466 32,677
Operating costs and expenses: costs and expenses:
Operating
Products Products 17,808 17,808
17,359 17,230
17,359 17,230
Services Services 8,544 8,544
9,198 9,591
9,198 9,591
General and administrative
General and administrative 1,954 1,954
1,964 2,030
1,964 2,030
28,306 -0.75%6
28,30
28,521 28,851
28,521 28,851
Operating earnings Operating earnings 3,675 -6.84%
3,675
3,945 3,826
3,945 3,826
Interest, net Interest, net (160) (160)
(157) (141)
(157) (141)
Other, net Other, net (2) (2)
2 33 2 33
Earnings from continuing operations continuing operations before income taxes
Earnings from before income taxes 3,513 3,513
3,790 3,718
3,790 3,718
Provision for income taxes, net for income taxes, net
Provision 1,106 1,106
1,162 1,166
1,162 1,166
Earnings from continuing operations continuing operations
Earnings from 2,407 2,407
2,628 2,552
2,628 2,552
Discontinued operations, Discontinued operations, net of tax
net of tax (13) (13)
(4) (26) (4) (26)
Net earnings Net earnings $ 2,394 $ 2,394
$ 2,624
-8.77% $ $ 2,526
2,624 $ 2,526
Earnings per share Earnings per share
Basic: Basic:
Continuing operations Continuing operations $ 6.24 $$ 6.89
6.24 $ $ 7.016.89 $ 7.01
Discontinued operations Discontinued operations (0.03) (0.01)
(0.03) (0.07)
(0.01) (0.07)
Net earnings Net earnings $ 6.21 $$ 6.88
6.21 $ $ 6.94
6.88 $ 6.94
Diluted: Diluted:
Continuing operations Continuing operations $ 6.20 $$ 6.20
6.82 $ $ 6.946.82 $ 6.94
Discontinued operations Discontinued operations (0.03) (0.01)
(0.03) (0.07)
(0.01) (0.07)
Net earnings Net earnings $ 6.17 -9.40%
$$ 6.81
6.17 $ $ 6.87
6.81 $ 6.87
The accompanying Notes to Consolidated FinancialNotes to Consolidated Financial Statements are an integral part of this statement.
The accompanying Statements are an integral part of this statement.
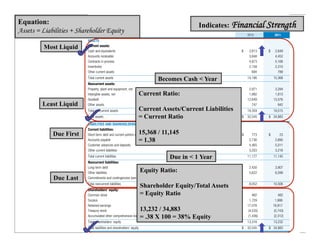
CONSOLIDATED BALANCE SHEET
Equation: Indicates: Financial Strength
Assets = Liabilities + Shareholder Equity December 31
Balance
Sheet
Most Liquid
(Dollars in millions)
ASSETS
Current assets:
2010 2011
Cash and equivalents $ 2,613 $ 2,649
Accounts receivable 3,848 4,452
Contracts in process 4,873 5,168
Inventories 2,158 2,310
Other current assets 694 789
Total current assets
Becomes Cash < Year 14,186 15,368
Noncurrent assets:
Property, plant and equipment, net 2,971 3,284
Intangible assets, net Current Ratio: 1,992 1,813
Goodwill 12,649 13,576
Least Liquid Other assets 747 842
Total noncurrent assets Current Assets/Current Liabilities 18,359 19,515
Total assets = Current Ratio $ 32,545 $ 34,883
LIABILITIES AND SHAREHOLDERS’ EQUITY
Current liabilities:
Due First 15,368 / 11,145
Short-term debt and current portion of long-term debt $ 773 $ 23
Accounts payable = 1.38 2,736 2,895
Customer advances and deposits 4,465 5,011
Other current liabilities 3,203 3,216
Total current liabilities Due in < 1 Year 11,177 11,145
Noncurrent liabilities:
Long-term debt 2,430 3,907
Other liabilities Equity Ratio: 5,622 6,599
Due Last Commitments and contingencies (see Note N)
Total noncurrent liabilities 8,052 10,506
Shareholder Equity/Total Assets
Shareholders’ equity:
Common stock = Equity Ratio 482 482
Surplus 1,729 1,888
Retained earnings 17,076 18,917
Treasury stock 13,232 / 34,883 (4,535) (5,743)
Accumulated other comprehensive loss = .38 X 100 = 38% Equity (1,436) (2,312)
Total shareholders’ equity 13,316 13,232
109
Total liabilities and shareholders’ equity $ 32,545 $ 34,883
The accompanying Notes to Consolidated Financial Statements are an integral part of this statement.
110.
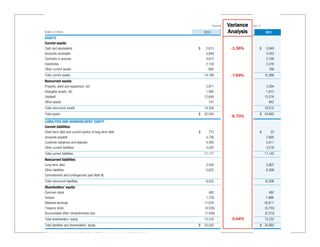
CONSOLIDATED BALANCE SHEETBALANCE SHEET
CONSOLIDATED
December 31 Variance e c e m b e r 3 1
D
(Dollars in millions) (Dollars in millions) 2010 Analysis
2011 2010 2011
ASSETS ASSETS
Current assets: Current assets:
Cash and equivalents Cash and equivalents $ 2,613 $ -1.36%
2,649 2,613
$ $ 2,649
Accounts receivable Accounts receivable 3,848 4,452 3,848 4,452
Contracts in process Contracts in process 4,873 5,168 4,873 5,168
Inventories Inventories 2,158 2,310 2,158 2,310
Other current assets Other current assets 694 789 694 789
Total current assets Total current assets 14,186 -7.69%
15,368
14,186 15,368
Noncurrent assets: Noncurrent assets:
Property, plant and equipment, net plant and equipment, net
Property, 2,971 3,284 2,971 3,284
Intangible assets, net Intangible assets, net 1,992 1,813 1,992 1,813
Goodwill Goodwill 12,649 13,576
12,649 13,576
Other assets Other assets 747 842 747 842
Total noncurrent assets Total noncurrent assets 18,359 19,515
18,359 19,515
Total assets Total assets $ 32,545 $ 34,883
$ 32,545 $ 34,883
-6.70%
LIABILITIES AND SHAREHOLDERS’ EQUITY
LIABILITIES AND SHAREHOLDERS’ EQUITY
Current liabilities: Current liabilities:
Short-term debt and current portion ofdebt and current portion of long-term debt
Short-term long-term debt $ 773 $ $ 23 773 $ 23
Accounts payable Accounts payable 2,736 2,895 2,736 2,895
Customer advances and deposits advances and deposits
Customer 4,465 5,011 4,465 5,011
Other current liabilities Other current liabilities 3,203 3,216 3,203 3,216
Total current liabilities Total current liabilities 11,177 11,145
11,177 11,145
Noncurrent liabilities: Noncurrent liabilities:
Long-term debt Long-term debt 2,430 3,907 2,430 3,907
Other liabilities Other liabilities 5,622 6,599 5,622 6,599
Commitments and contingencies (see Note N)contingencies (see Note N)
Commitments and
Total noncurrent liabilities Total noncurrent liabilities 8,052 10,506 8,052 10,506
Shareholders’ equity: Shareholders’ equity:
Common stock Common stock 482 482 482 482
Surplus Surplus 1,729 1,888 1,729 1,888
Retained earnings Retained earnings 17,076 18,91717,076 18,917
Treasury stock Treasury stock (4,535) (5,743)
(4,535) (5,743)
Accumulated other comprehensive loss other comprehensive loss
Accumulated (1,436) (2,312)
(1,436) (2,312)
Total shareholders’ equity Total shareholders’ equity 13,316 0.64%
13,232
13,316 13,232
Total liabilities and shareholders’liabilities and shareholders’ equity
Total equity $ 32,545 $ 34,883
$ 32,545 $ 34,883
The accompanying Notes to Consolidated Financial Statements are an integral part ofStatements are an integral part of this statement.
The accompanying Notes to Consolidated Financial this statement.
111.
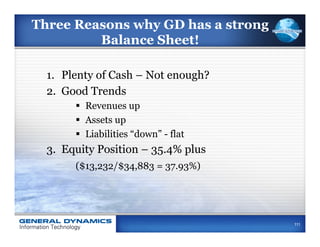
Three Reasons whyGD has a strong
Balance Sheet!
1. Plenty of Cash – Not enough?
2. Good Trends
§ Revenues up
§ Assets up
§ Liabilities “down” - flat
3. Equity Position – 35.4% plus
($13,232/$34,883 = 37.93%)
111
112.
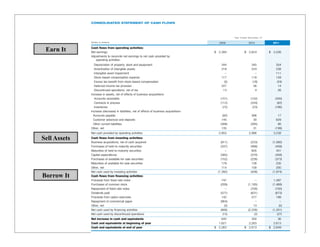
CONSOLIDATED STATEMENT OFCASH FLOWS
Year Ended December 31
(Dollars in millions) 2009 2010 2011
Earn It Cash flows from operating activities:
Net earnings $ 2,394 $ 2,624 $ 2,526
Adjustments to reconcile net earnings to net cash provided by
operating activities-
Depreciation of property, plant and equipment 344 345 354
Amortization of intangible assets 218 224 238
Intangible asset impairment – – 111
Stock-based compensation expense 117 118 128
Excess tax benefit from stock-based compensation (5) (18) (24)
Deferred income tax provision 227 56 14
Discontinued operations, net of tax 13 4 26
Increase in assets, net of effects of business acquisitions-
Accounts receivable (151) (152) (420)
Contracts in process (112) (334) (62)
Inventories (72) (23) (186)
Increase (decrease) in liabilities, net of effects of business acquisitions-
Accounts payable (92) 366 17
Customer advances and deposits 145 30 629
Other current liabilities (306) (285) 86
Other, net 135 31 (199)
Net cash provided by operating activities 2,855 2,986 3,238
Sell Assets Cash flows from investing activities:
Business acquisitions, net of cash acquired (811) (233) (1,560)
Purchases of held-to-maturity securities (337) (468) (459)
Maturities of held-to-maturity securities – 605 441
Capital expenditures (385) (370) (458)
Purchases of available-for-sale securities (152) (226) (373)
Maturities of available-for-sale securities 179 126 235
Other, net 114 158 200
Net cash used by investing activities (1,392) (408) (1,974)
Borrow It Cash flows from financing activities:
Proceeds from fixed-rate notes 747 – 1,497
Purchases of common stock (209) (1,185) (1,468)
Repayment of fixed-rate notes – (700) (750)
Dividends paid (577) (631) (673)
Proceeds from option exercises 142 277 198
Repayment of commercial paper (904) – –
Other, net (5) 13 (5)
Net cash used by financing activities (806) (2,226) (1,201)
Net cash used by discontinued operations (15) (2) (27)
Net increase in cash and equivalents 642 350 36
Cash and equivalents at beginning of year 1,621 2,263 2,613
Cash and equivalents at end of year $ 2,263 $ 2,613 $ 2,649
The accompanying Notes to Consolidated Financial Statements are an integral part of this statement.
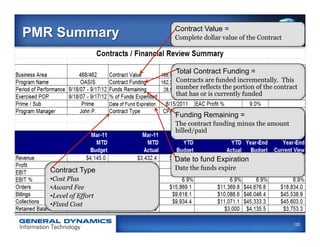
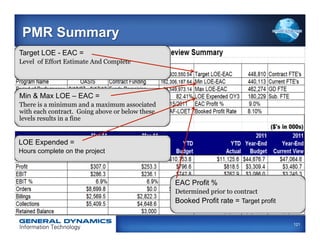
PMR Summary Contract Value =
Complete dollar value of the Contract
Total Contract Funding =
Contracts are funded incrementally. This
number reflects the portion of the contract
that has or is currently funded
Funding Remaining =
The contract funding minus the amount
billed/paid
Date to fund Expiration
Contract Type Date the funds expire
• Cost Plus
• Award Fee
• Level of Effort
• Fixed Cost
120
121.
PMR Summary
Target LOE- EAC =
Level of Effort Estimate And Complete
Min & Max LOE – EAC =
There is a minimum and a maximum associated
with each contract. Going above or below these
levels results in a fine
LOE Expended =
Hours complete on the project
EAC Profit %
Determined prior to contract
Booked Profit rate = Target profit
121
122.
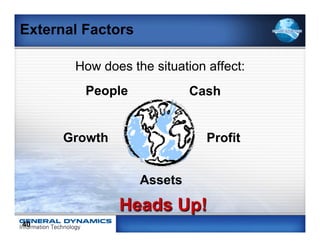
External Factors
How does the situation affect:
People Cash
Growth Profit
Assets
Heads Up!
40
123.
“The best wayto predict the future….
is to create it.”
Peter Drucker
123
124.
External Factors
The best “CEO’s” not only pay attention
to what is happening inside their
company, they also have an eye on
the external factors that could impact
their business.
40
125.
External Factors
The Role of the Stock Market
1. What role does the stock market play?
2. Who cares about a company’s stock price and why?
• Investors
• Analysis
• The CEO
• Employees
3. What are the benefits of a higher stock price?
40 40
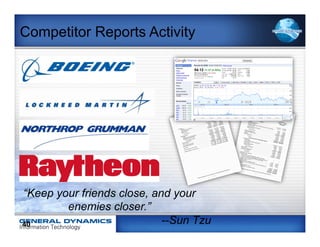
Competitor Reports Activity
Resources
1. Annual Report and/or latest executive
messaging
2. Financial Statements
3. Complete the Navigating the Financials
4. Corporate Website
5. www.google.com/finance
Reports – use outline provided
1. Answer questions on the hand-out
2. Prepare flip-chart
3. Teach the rest of the group
40
128.
Individual Action Plan
à Review: (Page 52)
What new insights did you gain,
as a result of attending?
à Action Plan: (Page 53)
List the things you can commit to do:
ü Cash: (refer to page 9)
ü Profit: (refer to page 11)
ü Assets: (refer to page 13)
ü Growth: (refer to page 15)
ü People: (refer to page 17)
52 52
129.
Acumen Accountability
Find aPartner now and:
1. Set up a specific date and time in 30 days to report
your progress on your action plan.
2. Exchange emails
3. Exchange phone numbers
4. Decide who will initiate the call
5. Determine a back-up plan
6. Transfer this information to
your device now.
53 53
130.
Insights
à Review: (Page 52)
What new insights did you gain,
as a result of attending?
52
Locating Financial Information
Web Sites:
• www.nasdaq.com
• www.reuters.com
• www.yahoo.com
• www.finance.google.com
• www.hoovers.com
• www.smartmoney.com
55 55
133.
Learning Objectives…
ü Listand describe what key measures are important
to ISD and to Tom Kirchmaier.
ü List and describe the five business drivers all successful
businesses must focus on.
ü Teach specific components of the financial statements.
ü Explain how I can have an impact on growth.
ü Create a personal action plan that can positively
impact our results.
133
134.
Post Course BusinessAcumen
1. Teach one of the principals learned in class today, to
someone on your team.
2. Discuss your action items with your manager in
the next 7 days.
3. Read the first 90 pages of: “Seeing the BIG Picture“
4. Give an account of your progress on your action
item(s).
5. Think and act like owners!
135.
One Final Thought…
“People will work
hard for a paycheck,
harder for a person, and
hardest for a reason.”