Download to read offline

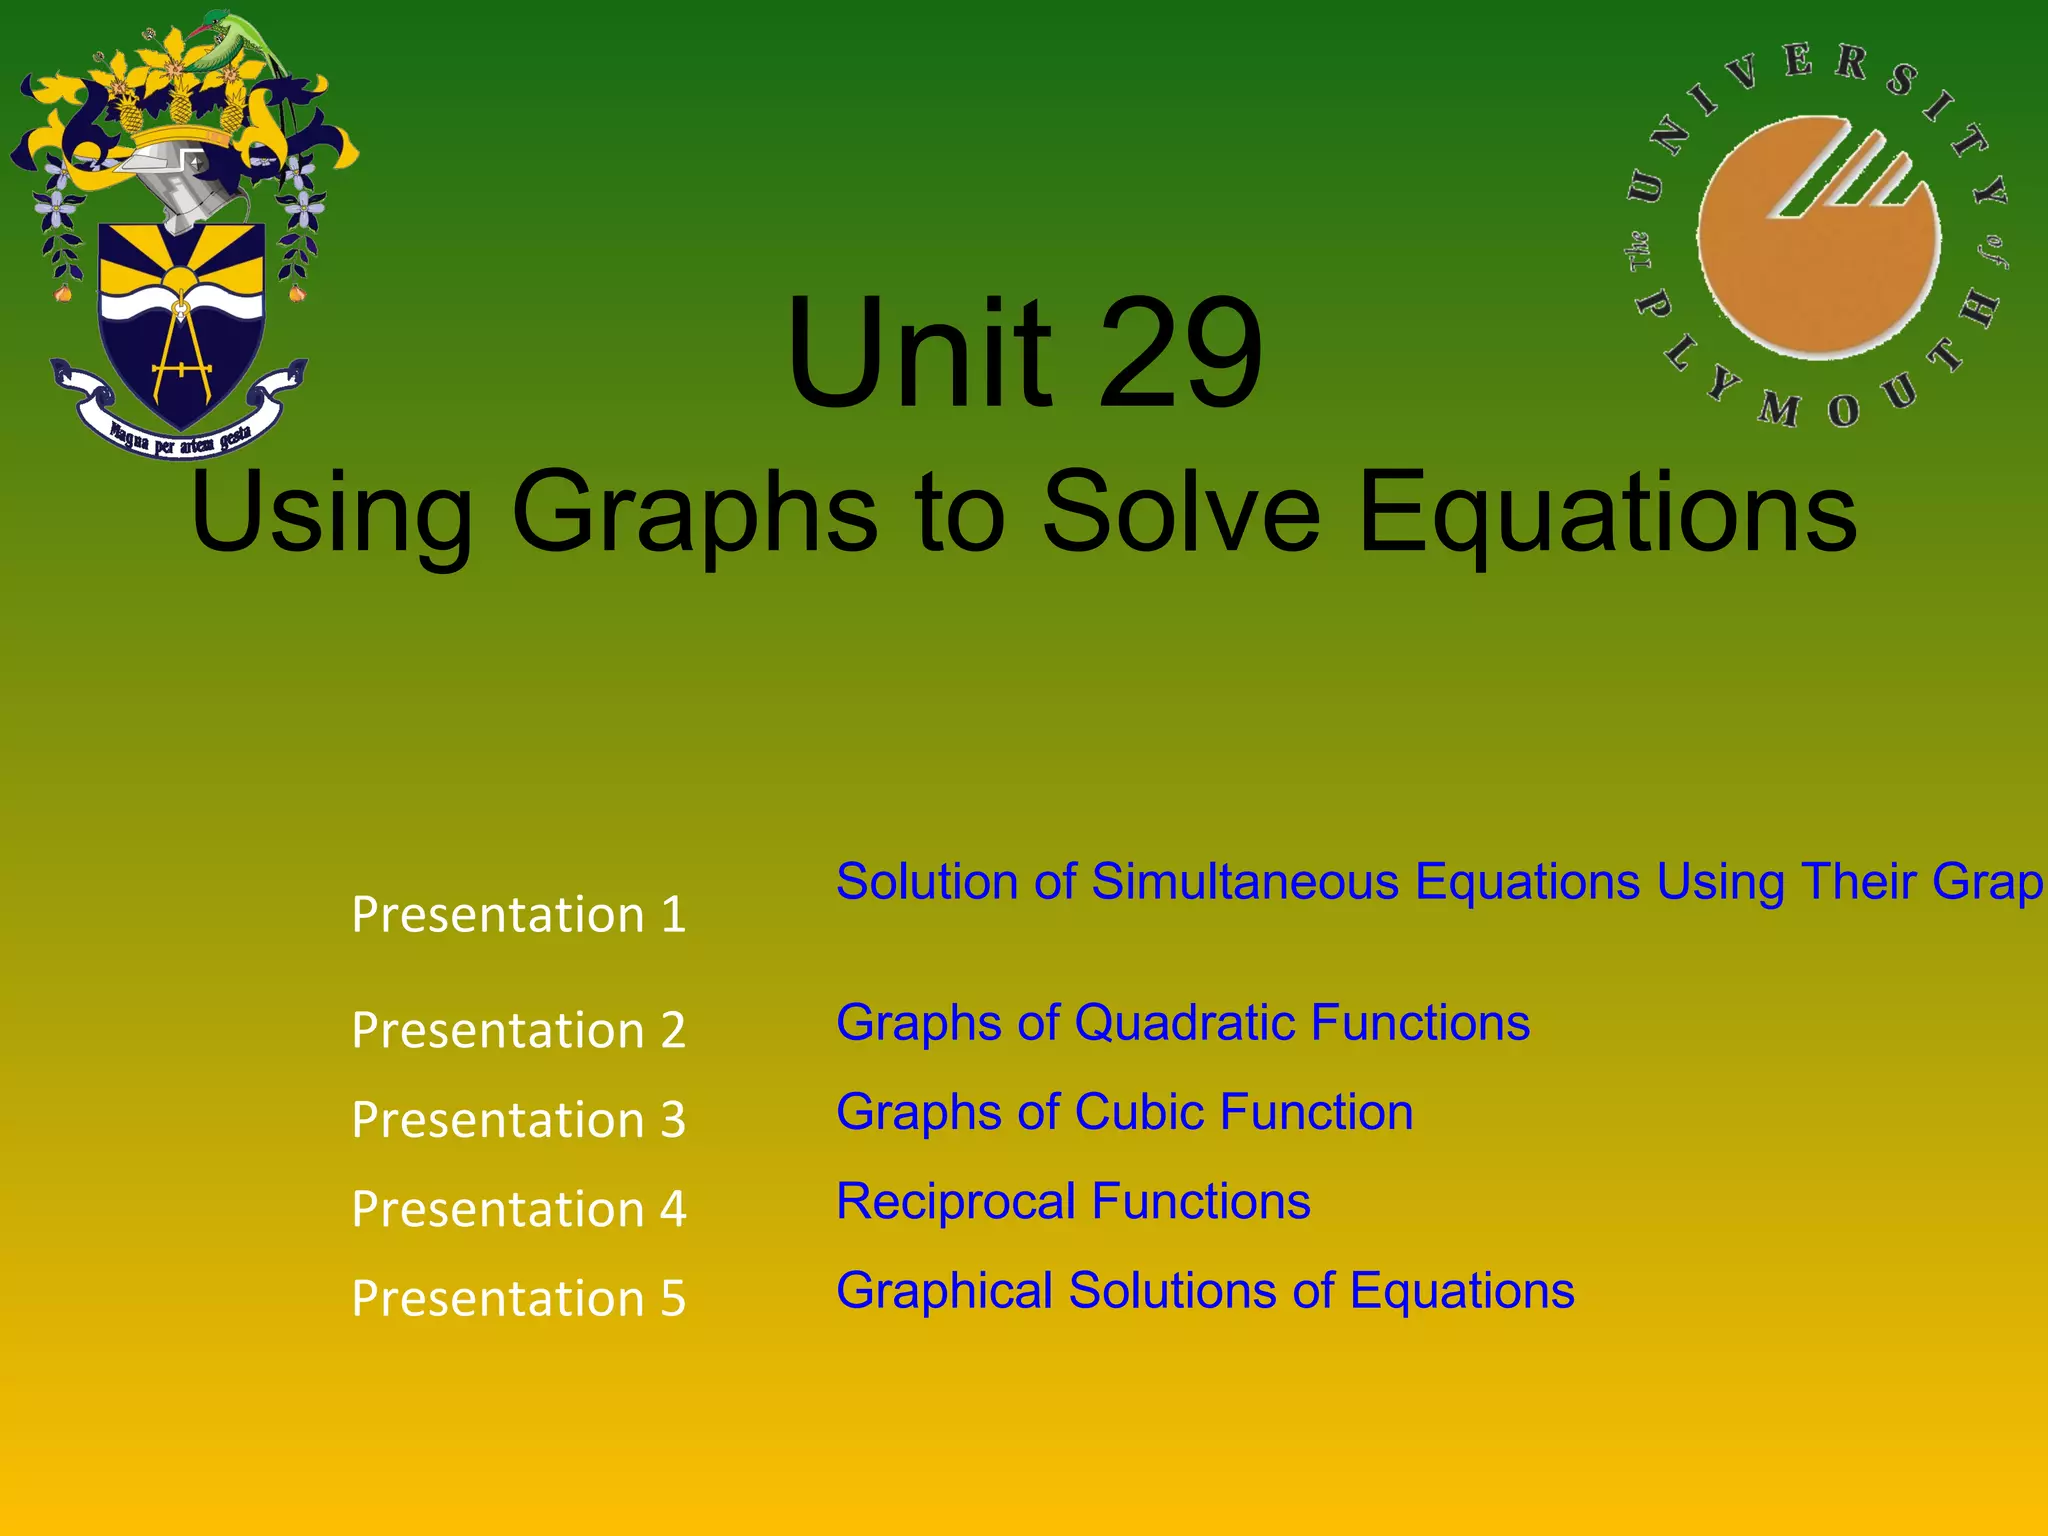
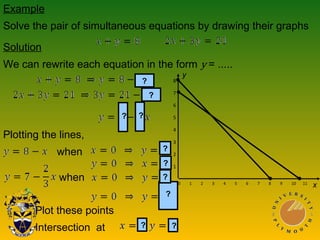
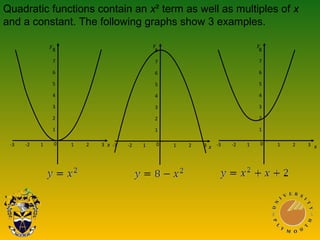
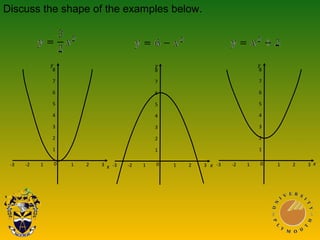
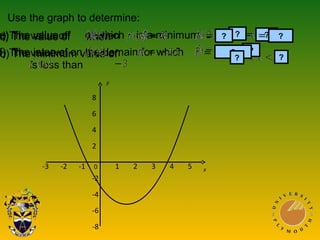


This document discusses using graphs to solve equations. It covers solving simultaneous equations by graphing the lines and finding their intersection point. It also discusses graphs of quadratic, cubic, and reciprocal functions, including their key characteristics and shapes. Examples of each type of function are shown. The document concludes by discussing using graphs to find specific values or intervals related to equations.