Downloaded 22 times
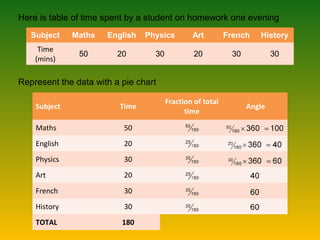
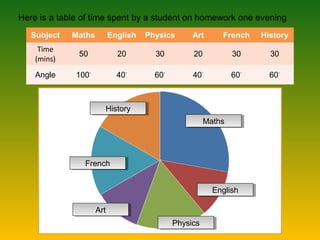

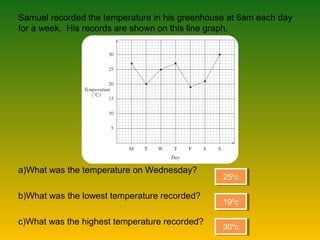
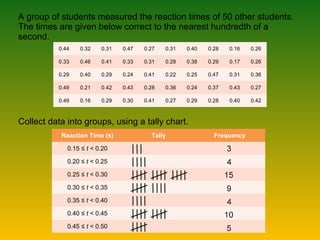
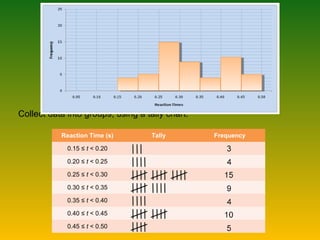

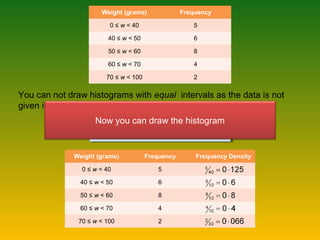
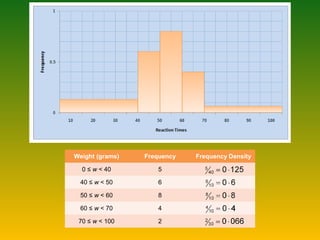

The document discusses different data presentation methods including pie charts, line graphs, histograms, and histograms with unequal class intervals. It provides examples of how to represent various data sets visually using these different graph types, including steps for constructing the graphs, calculating values, and interpreting the results.


