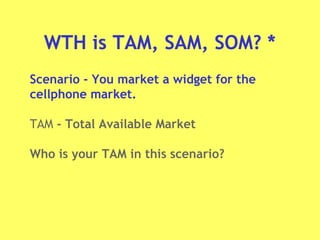
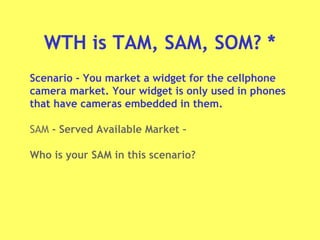
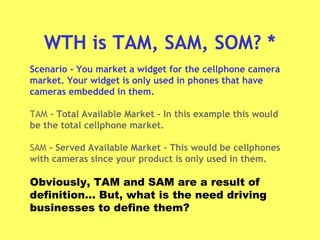
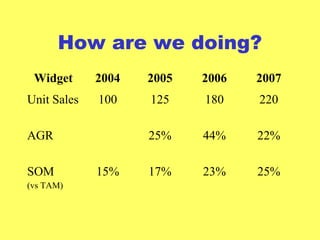
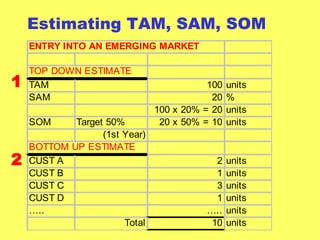
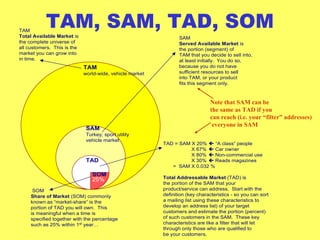
On the Macro Market View
Ziya G. Boyacigiller
This presentation was created and given by Ziya
Boyacigiller who was leading Angel Investor and a loved
mentor to many young entrepreneurs in Turkey. We have
shared it on the web for everyone’s benefit. It is free to
use but please cite Ziya Boyacigiller as the source when
you use any part of this presentation. For more about
Ziya Boyacigiller’s contributions to the start-up Ecosystem
of Turkey, please go to www.ziyaboyacigiller.com
Macro Market View
TAM - SAM – SOM - TAD
Sizing the Market Potential
Before you do a lot of work on a business
plan,
first, you should “stop and think”:
“Is it worth
it?”
Sizing the Market Potential
You need to agree that there is nothing better
you want to do with your time and money,
that the size of the opportunity fits your
expectations. (i.e. “opportunity cost”)
This leads you to estimate
the market size.
What is Your Market?
• First, define who your target customer will be.
• Write down the key characteristics that will define
your target customers. (If you do it right, you
should be able to hand this list to someone else,
and s/he should be able to find them successfully
for you.)
• Your customer is the one who will “hire” your
product/service to do a specific “job” for her/him.
What is TAM, SAM, SOM?
Scenario –
You market a widget for the cellphone
camera market. Your widget is only
used in phones that have cameras
embedded in them.
* Taken from Internet and modified...
WTH is TAM, SAM, SOM? *
Scenario - You market a widget for the
cellphone market.
TAM - Total Available Market
Who is your TAM in this scenario?
WTH is TAM, SAM, SOM? *
Scenario - You market a widget for the cellphone
camera market. Your widget is only used in phones
that have cameras embedded in them.
SAM - Served Available Market –
Who is your SAM in this scenario?
WTH is TAM, SAM, SOM? *
Scenario - You market a widget for the cellphone camera
market. Your widget is only used in phones that have
cameras embedded in them.
TAM - Total Available Market - In this example this would
be the total cellphone market.
SAM - Served Available Market - This would be cellphones
with cameras since your product is only used in them.
Obviously, TAM and SAM are a result of
definition… But, what is the need driving
businesses to define them?
How are we doing?
Widget 2004 2005 2006 2007
Unit Sales 100 125 180 220
AGR 25% 44% 22%
SOM
(vs TAM)
15% 17% 23% 25%
TAM/SAM breakdown for
cellphone cameras:
15%
7% 10%
23%
39%
50%
60%
Not good…
Widget 2004 2005 2006 2007
Unit Sales 100 125 180 220
AGR 25% 44% 22%
SOM
(vs TAM)
15% 17% 23% 25%
SOM
(vs SAM)
50% 45% 45% 44%
AGR (5%) 0% (1%)
SOM vs SAM & TAM
SOM - Share of Market - this is just the
market share you have in your SAM, or in
this case your total volume versus the total
SAM volume.
As noted above, by comparing your SOM to
both your SAM and your TAM, you can get a
feel if you are really growing market
share, or just increasing volume along with
the total market growth.
One Word of Caution…
You can gather data in multiple forms:
• Units (Adet) : 5 each, 20 units, etc.
• Currency (Para) : $5, 20TL, etc.
• ASP (Average Selling Price) : Total Revenue : 2.5 TL/unit
Total Units
You need to look at all, to make a healthy
assessment of your business trends…
ENTRY INTO AN EMERGING MARKET
TOP DOWN ESTIMATE
TAM 100 units
SAM 20 %
100 x 20% = 20 units
SOM Target 50% 20 x 50% = 10 units
(1st Year)
BOTTOM UP ESTIMATE
CUST A 2 units
CUST B 1 units
CUST C 3 units
CUST D 1 units
….. ….. units
Total 10 units
Estimating TAM, SAM, SOM
1
2
Drivers for Growth
• It is important to understand the underlying reasons for
growth (trends).
– Ex: cell phones  telecom deregulation
– Ex: Instant messaging  real time, low cost communication
• These should be taken to the limit they will reach in the future to
explain the economic tradeoffs behind the buying decision when
compared to substitute products.
– Ex: Will Internet access over satellite or cable win over time?
• Only then, can you be sure that the market will exist (not
disappear) when you are ready with your product/service.
– Ex: networking / dark fiber capacity
• You should also estimate the TAM and SAM growth rates
over time, when estimating your market size.
Total Addressable Market
Paul Wiefels – The Chasm Companion
Question:
You are starting a web based business.
Your target customers are pet owners.
In USA there is $32B a year revenue in pet
business -by 58 million Americans, 212 million
pets.
What would you forecast your 1st
and 5th
year
sales to be?
Available  Addressable
Total Available Pet Owners in USA… 100% $32.0 B/year(*)
….with PC (% of PC/population USA) X 36% 11.5
… and with home PC X 50 % 5.8
… and with Internet X 70% 4.1
… and surfing www X 10% $400 M/year
… and over 18 years of age X 60% 200
… and with broadband X 43% 100
… and will shop on www X 20%? 20
… and will shop for pet on www X 10%? 2
… and will be repeat customers X 50%? 1
… and will be site loyal X 50%? $500 K/year
… and reachable within first year X 50%? $250 K/year (+)
Total Addressable … and will try your service/products X 25%? 62
(*) Spending for 58 million Americans – 60% of households – own 212 million pets
(+) About 110 people, based on numbers shown on this slide. (?) Estimated
For Online Pet Stores,
It's Dog-Eat-Dog
Slim margins and a crowded market
point to a brutal shakeout
http://www.businessweek.com/index.html
“…But Fido should have chewed up a few of these online pet store business plans.
Because so many pet stores are rushing to the Web, the market is almost
certainly headed for a messy shakeout. Pet supplies have never been a lucrative
business. Operating margins are a razor-thin 2% at leading retailer PETsMART
and 4.5% at rival Petco. And the prospect of competitors willing to lose millions
to grab market share has investors skittish. “
Example from Turkey
Kodalfa – Green House Condition
Monitoring System
TAM, SAM, TAD, SOM
TAM
world-wide, vehicle market
SAM
Turkey, sport utility
vehicle market
TAD
25%
SOM
TAD = SAM X 20%  “A class” people
X 67%  Car owner
X 80%  Non-commercial use
X 30%  Reads magazines
= SAM X 0.032 %
Total Addressable Market (TAD) is
the portion of the SAM that your
product/service can address. Start with the
definition (key characteristics - so you can sort
a mailing list using these characteristics to
develop an address list) of your target
customers and estimate the portion (percent)
of such customers in the SAM. These key
characteristics are like a filter that will let
through only those who are qualified to
be your customers.
SOM
Share of Market (SOM) commonly
known as “market-share” is the
portion of TAD you will own. This
is meaningful when a time is
specified together with the percentage
such as 25% within 1st
year…
SAM
Served Available Market is
the portion (segment) of
TAM that you decide to sell into,
at least initially. You do so,
because you do not have
sufficient resources to sell
into TAM, or your product
fits this segment only.
TAM
Total Available Market is
the complete universe of
all customers. This is the
market you can grow into
in time.
Note that SAM can be
the same as TAD if you
can reach (i.e. your “filter” addresses)
everyone in SAM
Now You Can Ask Yourself:
Is It Worth It?

New 7 tam, sam, tad, som explained

  • 1.
    On the MacroMarket View Ziya G. Boyacigiller This presentation was created and given by Ziya Boyacigiller who was leading Angel Investor and a loved mentor to many young entrepreneurs in Turkey. We have shared it on the web for everyone’s benefit. It is free to use but please cite Ziya Boyacigiller as the source when you use any part of this presentation. For more about Ziya Boyacigiller’s contributions to the start-up Ecosystem of Turkey, please go to www.ziyaboyacigiller.com
  • 2.
    Macro Market View TAM- SAM – SOM - TAD
  • 3.
    Sizing the MarketPotential Before you do a lot of work on a business plan, first, you should “stop and think”: “Is it worth it?”
  • 4.
    Sizing the MarketPotential You need to agree that there is nothing better you want to do with your time and money, that the size of the opportunity fits your expectations. (i.e. “opportunity cost”) This leads you to estimate the market size.
  • 5.
    What is YourMarket? • First, define who your target customer will be. • Write down the key characteristics that will define your target customers. (If you do it right, you should be able to hand this list to someone else, and s/he should be able to find them successfully for you.) • Your customer is the one who will “hire” your product/service to do a specific “job” for her/him.
  • 6.
    What is TAM,SAM, SOM? Scenario – You market a widget for the cellphone camera market. Your widget is only used in phones that have cameras embedded in them. * Taken from Internet and modified...
  • 7.
    WTH is TAM,SAM, SOM? * Scenario - You market a widget for the cellphone market. TAM - Total Available Market Who is your TAM in this scenario?
  • 8.
    WTH is TAM,SAM, SOM? * Scenario - You market a widget for the cellphone camera market. Your widget is only used in phones that have cameras embedded in them. SAM - Served Available Market – Who is your SAM in this scenario?
  • 9.
    WTH is TAM,SAM, SOM? * Scenario - You market a widget for the cellphone camera market. Your widget is only used in phones that have cameras embedded in them. TAM - Total Available Market - In this example this would be the total cellphone market. SAM - Served Available Market - This would be cellphones with cameras since your product is only used in them. Obviously, TAM and SAM are a result of definition… But, what is the need driving businesses to define them?
  • 10.
    How are wedoing? Widget 2004 2005 2006 2007 Unit Sales 100 125 180 220 AGR 25% 44% 22% SOM (vs TAM) 15% 17% 23% 25%
  • 11.
    TAM/SAM breakdown for cellphonecameras: 15% 7% 10% 23% 39% 50% 60%
  • 12.
    Not good… Widget 20042005 2006 2007 Unit Sales 100 125 180 220 AGR 25% 44% 22% SOM (vs TAM) 15% 17% 23% 25% SOM (vs SAM) 50% 45% 45% 44% AGR (5%) 0% (1%)
  • 13.
    SOM vs SAM& TAM SOM - Share of Market - this is just the market share you have in your SAM, or in this case your total volume versus the total SAM volume. As noted above, by comparing your SOM to both your SAM and your TAM, you can get a feel if you are really growing market share, or just increasing volume along with the total market growth.
  • 14.
    One Word ofCaution… You can gather data in multiple forms: • Units (Adet) : 5 each, 20 units, etc. • Currency (Para) : $5, 20TL, etc. • ASP (Average Selling Price) : Total Revenue : 2.5 TL/unit Total Units You need to look at all, to make a healthy assessment of your business trends…
  • 15.
    ENTRY INTO ANEMERGING MARKET TOP DOWN ESTIMATE TAM 100 units SAM 20 % 100 x 20% = 20 units SOM Target 50% 20 x 50% = 10 units (1st Year) BOTTOM UP ESTIMATE CUST A 2 units CUST B 1 units CUST C 3 units CUST D 1 units ….. ….. units Total 10 units Estimating TAM, SAM, SOM 1 2
  • 16.
    Drivers for Growth •It is important to understand the underlying reasons for growth (trends). – Ex: cell phones  telecom deregulation – Ex: Instant messaging  real time, low cost communication • These should be taken to the limit they will reach in the future to explain the economic tradeoffs behind the buying decision when compared to substitute products. – Ex: Will Internet access over satellite or cable win over time? • Only then, can you be sure that the market will exist (not disappear) when you are ready with your product/service. – Ex: networking / dark fiber capacity • You should also estimate the TAM and SAM growth rates over time, when estimating your market size.
  • 17.
    Total Addressable Market PaulWiefels – The Chasm Companion
  • 18.
    Question: You are startinga web based business. Your target customers are pet owners. In USA there is $32B a year revenue in pet business -by 58 million Americans, 212 million pets. What would you forecast your 1st and 5th year sales to be?
  • 19.
    Available  Addressable TotalAvailable Pet Owners in USA… 100% $32.0 B/year(*) ….with PC (% of PC/population USA) X 36% 11.5 … and with home PC X 50 % 5.8 … and with Internet X 70% 4.1 … and surfing www X 10% $400 M/year … and over 18 years of age X 60% 200 … and with broadband X 43% 100 … and will shop on www X 20%? 20 … and will shop for pet on www X 10%? 2 … and will be repeat customers X 50%? 1 … and will be site loyal X 50%? $500 K/year … and reachable within first year X 50%? $250 K/year (+) Total Addressable … and will try your service/products X 25%? 62 (*) Spending for 58 million Americans – 60% of households – own 212 million pets (+) About 110 people, based on numbers shown on this slide. (?) Estimated
  • 20.
    For Online PetStores, It's Dog-Eat-Dog Slim margins and a crowded market point to a brutal shakeout http://www.businessweek.com/index.html “…But Fido should have chewed up a few of these online pet store business plans. Because so many pet stores are rushing to the Web, the market is almost certainly headed for a messy shakeout. Pet supplies have never been a lucrative business. Operating margins are a razor-thin 2% at leading retailer PETsMART and 4.5% at rival Petco. And the prospect of competitors willing to lose millions to grab market share has investors skittish. “
  • 21.
    Example from Turkey Kodalfa– Green House Condition Monitoring System
  • 22.
    TAM, SAM, TAD,SOM TAM world-wide, vehicle market SAM Turkey, sport utility vehicle market TAD 25% SOM TAD = SAM X 20%  “A class” people X 67%  Car owner X 80%  Non-commercial use X 30%  Reads magazines = SAM X 0.032 % Total Addressable Market (TAD) is the portion of the SAM that your product/service can address. Start with the definition (key characteristics - so you can sort a mailing list using these characteristics to develop an address list) of your target customers and estimate the portion (percent) of such customers in the SAM. These key characteristics are like a filter that will let through only those who are qualified to be your customers. SOM Share of Market (SOM) commonly known as “market-share” is the portion of TAD you will own. This is meaningful when a time is specified together with the percentage such as 25% within 1st year… SAM Served Available Market is the portion (segment) of TAM that you decide to sell into, at least initially. You do so, because you do not have sufficient resources to sell into TAM, or your product fits this segment only. TAM Total Available Market is the complete universe of all customers. This is the market you can grow into in time. Note that SAM can be the same as TAD if you can reach (i.e. your “filter” addresses) everyone in SAM
  • 23.
    Now You CanAsk Yourself: Is It Worth It?