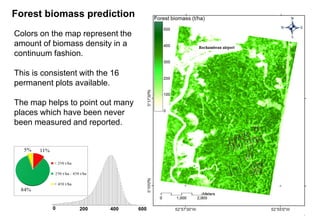
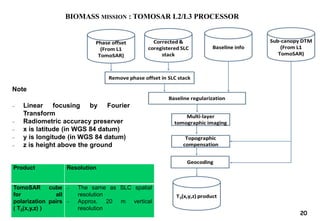
1) P-band SAR tomography can provide 3D images of tropical forests with resolution along the vertical direction, exploiting the relationship between reflectivity and multi-baseline signals.
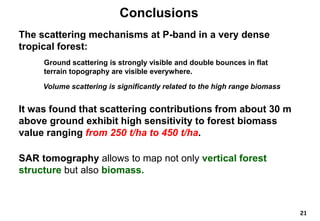
2) Analysis of SAR tomography data from French Guiana showed scattering mechanisms are linked to the ground level and canopy level, with HV polarization dominating volume scattering at the canopy.
3) Relating scattering to independently measured biomass at two sites showed significant correlation between biomass and backscattering from layers between 20-40m above the ground, indicating sensitivity to total above-ground biomass.
FR1.L09.3 - SAR TOMOGRAPHIC FOCUSING BY COMPRESSIVE SAMPLING: EXPERIMENTS ON ...grssieee
The document proposes a method called Compressive Sampling Tomography (CST) to enhance height resolution in SAR tomography using fewer acquisitions. CST exploits sparsity in the elevation dimension to reconstruct scatterers from undersampled data. Experiments on simulated and real ERS-1/2 SAR data show CST achieves better height resolution than traditional methods using fewer orbits/acquisitions. CST has potential to improve elevation focusing for high resolution SAR imagery.
The document describes a displaced ensemble variational data assimilation method to incorporate microwave imager brightness temperatures (TBs) into a cloud-resolving model. It uses an ensemble-based variational assimilation approach with a displacement error correction scheme to address errors from misplaced rainfall areas between observations and forecasts. The method is applied to assimilate TMI TBs for Typhoon CONSON on June 9, 2004, improving precipitation forecasts up to 4 hours later by reducing displacement errors and avoiding misinterpretation of TB increments.
The document discusses advances in SAR interferometry over the past 20 years for measuring millimeter-scale land motion. Key points include:
1) Revisit times have decreased from 35 days with ERS-1 to 12 days with Sentinel-1 constellations, improving ground motion recovery.
2) Persistent scatterer interferometry techniques like SqueeSAR can now measure motions to the millimeter by using all available interferograms.
3) Atmospheric phase screens still limit accuracy but can be estimated and removed using numerical weather models, GPS, and other independent datasets.
4) Future opportunities include using wide Doppler bandwidths from satellites to achieve high-resolution azimuth measurements of ground motion.
Explanation of very simple methods for atmospheric corrections and an example adapted from a paper of the Dept. of Thermodynamics, University of Valencia, Spain.
The document describes different methodologies used by various teams to measure the spectral reflectance of the Tuz Gölü site in Turkey for satellite calibration validation purposes. It discusses the principles of field reflectance measurement, instrumentation used including spectroradiometers and reference panels, and different spatial sampling strategies employed, such as spaced point sampling averaging multiple measurements, sampling with local variability assessment, and in-motion continuous sampling. Preliminary results showed good agreement between teams for a smaller area but less consistency for a larger area likely due to differences in spatial and temporal sampling.
This document discusses several approaches for atmospheric correction of remote sensing imagery:
1) Image-based methods like the dark pixel method and regression method estimate and remove atmospheric path radiance.
2) The empirical line method uses ground targets of known reflectance to model atmospheric effects.
3) Radiative transfer models precisely account for atmospheric conditions using numerical models like MODTRAN or 6S to convert pixel values to surface reflectance.
4) Relative correction methods normalize images without absolute calibration to surface reflectance. Atmospheric correction is needed to accurately analyze surface properties from remote sensing data and compare images acquired at different times or wavelengths.
This document describes three atmospheric correction algorithms for the Geostationary Ocean Color Imager (GOCI): the Standard NASA algorithm, the Spectral Shape Matching Method (SSMM), and the Sun-Glint Correction Algorithm (SGCA). It outlines the processing steps for each algorithm, including radiometric calibration, removal of Rayleigh and aerosol scattering, and derivation of remote sensing reflectance. Validation results show SSMM and SGCA provide reasonable matches to NASA standard processing of MODIS data, though all three GOCI algorithms could be improved by updating aerosol and ocean models. The document concludes the algorithms capture the essential ocean color measurement but would benefit from further refinement.
This document proposes using GNSS-R measurements to retrieve the scattering coefficient distribution over the ocean surface for oil slick detection. It presents a method to deconvolve the measured delay-Doppler map to remove the effects of the antenna pattern and retrieve the scattering coefficient values. A simulation applies the method to detect an oil slick in a retrieved scattering coefficient image, demonstrating the potential of this GNSS-R approach for ocean remote sensing applications like oil spill monitoring.
1) The Canadian Hydrogen Intensity Mapping Experiment (CHIME) telescope will observe the 400-800 MHz band and have a uniform north-south field of view, allowing it to observe every NANOGrav pulsar once per day.
2) Models show that CHIME should be able to make satisfactory daily observations for most NANOGrav pulsars, with a detection threshold flux shown in Figure 2.
3) Calculations based on pulse profiles and timing uncertainties indicate CHIME could measure pulsar dispersion measures (DMs) daily with uncertainties better than 10-3 pc cm-3 for many NANOGrav pulsars, comparable to current uncertainties, as shown in Figure 5.
Atmospheric Correction of Remotely Sensed Images in Spatial and Transform DomainCSCJournals
Remotely sensed data is an effective source of information for monitoring changes in land use and land cover. However remotely sensed images are often degraded due to atmospheric effects or physical limitations. Atmospheric correction minimizes or removes the atmospheric influences that are added to the pure signal of target and to extract more accurate information. The atmospheric correction is often considered critical pre-processing step to achieve full spectral information from every pixel especially with hyperspectral and multispectral data. In this paper, multispectral atmospheric correction approaches that require no ancillary data are presented in spatial domain and transform domain. We propose atmospheric correction using linear regression model based on the wavelet transform and Fourier transform. They are tested on Landsat image consisting of 7 multispectral bands and their performance is evaluated using visual and statistical measures. The application of the atmospheric correction methods for vegetation analyses using Normalized Difference Vegetation Index is also presented in this paper.
Correction of ionospheric distortions in low frequency interferometric SAR da...grssieee
This document discusses methods for correcting distortions caused by the ionosphere in low frequency synthetic aperture radar (SAR) interferometric data. The ionosphere can cause displacement and defocusing in SAR images. The authors propose estimating the total electron content (TEC) and its spatial variation to model ionospheric distortions. They develop approaches using full-band and sub-band interferograms to estimate azimuth shifts and correct for ionospheric phase screens. Simulation results demonstrate the effectiveness of their correction methods, especially when using multiple sub-bands and increasing the number of looks, though this reduces spatial resolution. The authors conclude sub-band methods provide finer structure of the ionosphere compared to full-band approaches.
Conferencia impartida por Sebastián Sánchez en los Viernes Científicos organizada por la Facultad de Ciencias Experimentales de la Universidad de Almería el 14 de enero de 2011.
Towards the identification of the primary particle nature by the radiodetecti...Ahmed Ammar Rebai PhD
This document summarizes a study using the CODALEMA experiment to analyze radio signals from air showers and identify properties of primary cosmic ray particles. It describes:
1) Analyzing time delays of radio signals compared to a plane wavefront hypothesis and finding systematic deviations, indicating the wavefront is curved.
2) Developing a model to reconstruct the emission center position based on fitting time delays to a parabolic function dependent on curvature radius and antenna distances.
3) Applying the model to 450 selected CODALEMA events and comparing reconstructed shower core positions to results from other models, finding consistency.
This last part of a course about SAR iamges concerns urban areas.
Recent development about urban are presented. They include advanced modes such as polarimetry, interferometry, DinSAR and POLINSAR.
1) Techniques are presented for accurately geolocating radar data from the TerraSAR-X and TanDEM-X satellites. Effects from the ionosphere, water vapor, tides, and continental drift must be accounted for.
2) Measurements of corner reflectors were used to evaluate absolute and relative localization accuracy. Accounting for all effects improved absolute accuracy to just a few centimeters for TerraSAR-X.
3) The relative accuracy between TanDEM-X images was sub-centimeter in range, demonstrating the capability for highly precise digital elevation models.
This study investigates the scale effect of the relationship between the normalized difference vegetation index (NDVI) and land surface temperature (T) and improves a thermal sharpening method called TsHARP. The study finds that the slope of the NDVI-T relationship increases more significantly with spatial extent than with spatial resolution alone. An improved TsHARP method is developed that establishes the NDVI-T regression relationship based on the spatial extent of individual thermal pixels, rather than the entire image extent. Testing shows the improved method produces a sharper and more accurate thermal sharpening result compared to the original TsHARP method.
TH1.L09 - INVESTIGATIONS ON TOPS INTERFEROMETRY WITH TERRASAR-Xgrssieee
The document discusses techniques for interferometry using TerraSAR-X data acquired in TOPS mode. Two approaches are suggested to estimate constant azimuth offsets between bursts using spectral diversity: 1) Using spectral bands within bursts. 2) Using the overlapping area between bursts. Experimental results with TerraSAR-X data validate these approaches and compare TOPS to ScanSAR and stripmap modes. TOPS-stripmap interferograms seem feasible under a persistent scatterer approach with additional processing needed if there is an azimuth displacement.
This document proposes a new polarimetric calibration method for SAR using forest and surface scattering targets. It models forest backscatter as consisting of volume, double bounce, and surface scattering. Two steps are used to determine channel imbalances and forest parameters: first using forest and a corner reflector, then estimating cross-talks. The method was evaluated using 26 Amazon datasets and showed stable parameters and good polarimetric signatures after calibration. Reflection symmetry was confirmed for forests.
Towards the identification of the primary particle nature by the radiodetecti...Ahmed Ammar Rebai PhD
To contact the author use ahmed.rebai2@gmail.com
Radio signal from extensive air showers EAS studied by the CODALEMA experiment have been detected by means of the classic short fat antennas array working in a slave trigger mode by a particle scintillator array. It is shown that the radio shower wavefront is curved with respect to the plane wavefront hypothesis. Then a new fitting model (parabolic model) is proposed to fit the radio signal time delay distributions in an event-by-event basis. This model take into account this wavefront property and several shower geometry parameters such as: the existence of an apparent localised radio-emission source located at a distance Rc from the antenna array of and the
radio shower core on the ground. Comparison of the outputs from this model and other reconstruction models used in the same experiment show: 1)- That the radio shower core is shifted from the particle shower core in a statistic analysis approach. 2)- The capability of the radiodetection method to reconstruct the curvature radius
with a statistical error less than 50 g.cm−2 . Finally a preliminary study of the primary particle nature has been performed based on a comparison between data and Xmax distribution from Aires Monte-Carlo simulations for the same set of events.
1) Conventional semblance analysis assumes no amplitude variation with offset (AVO), which can cause issues for events with strong AVO or polarity reversals. 2) The document proposes generalized semblance methods that incorporate AVO by modeling events with both hyperbolic moveout and amplitude variation. 3) It compares traditional, AB, and AK semblance on synthetic data, finding AK semblance maintains good velocity resolution while handling AVO better than traditional semblance.
Modeling Beam forming in Circular Antenna Array with Directional EmittersIJRESJOURNAL
ABSTRACT: The article discusses the functioning of the radio direction-finding and beamforming methods in the system of circular antenna arrays formed from the designed radiators, directional factor which is not equal to 1. Evaluation of forming of spatial pattern of cylindrical antenna array using phased method is fulfilled. DolphChebyshev window is used to reduce the side lobe level.
This document summarizes an approach for classifying seafloor textures in high resolution sonar images using multiscale discriminant analysis. The approach extracts statistical parameters from wavelet decompositions of the sonar images at multiple scales. A discriminant analysis is then used to reduce the feature space and generate an optimal subspace for classification. The method was tested on real sonar images containing speckle noise and showed improved classification of seabed textures like pebbles, dunes, ridges and sand.
Wide aperture reflection refraction profiling uses wide-angle reflected and diving wave energy to develop velocity models of seismic sections. It exploits long offset data to observe diving waves and wide-angle reflections that penetrate deeper than conventional methods. The technique involves first break tomography to obtain an initial velocity model, which is then refined through iterative forward modeling and matching of observed and calculated arrival times and amplitudes.
Speckle is the major multiplicative noise in the SAR(Radar) images, Improvement is done by using stochastic distance methods by assuming data as gamma distribution which enhances the images by 78% overall....
The document discusses a method called time-warp for estimating nonlinear multi-component motion in differential SAR tomography (D-TomoSAR). It presents the D-TomoSAR system model which accounts for general nonlinear and multi-component displacement. The time-warp method warps the temporal axis to accommodate linear and seasonal motion parameters. It is shown to work on both single and double scatterers for a test site in Las Vegas exhibiting linear and seasonal deformation patterns.
The document describes the ARTEMISS algorithm for retrieving surface temperature and emissivity from hyperspectral thermal infrared data. It discusses using in-scene atmospheric compensation to estimate transmission and path radiance from the data. It then uses these estimates along with lookup tables and spectral smoothness constraints to retrieve temperature and emissivity. Sensitivity studies show the algorithm works well except when there are issues like spectral miscalibration. A spectral smile and shift retrieval technique is also presented to characterize sensor calibration issues.
1) Pol-InSAR techniques have been demonstrated to accurately estimate forest height at P-band wavelengths over different forest types and terrains using airborne data. Forest height was retrieved to within 1.9-6m (10-30% error) compared to lidar measurements.
2) Transitioning the techniques for use on a spaceborne mission like BIOMASS presents challenges related to decreased spatial resolution, limited baseline configurations, and increased temporal decorrelation.
3) Modeling suggests the spaceborne system could achieve 20-40% accuracy in forest height estimation over heights ranging from 10-60m, but performance may decrease over sloped terrain or heterogeneous forests.
Temporal decorrelation analysis at P-band over tropical forest.pptgrssieee
1) The document discusses a temporal decorrelation analysis using airborne P-band SAR data acquired over tropical forests in Paracou, French Guiana over multiple dates with temporal baselines ranging from 2 to 22 days.
2) A methodology is presented to analyze temporal coherence and explore temporal decorrelation trends while accounting for noise and scattering effects.
3) The results found no clear decreasing trend in temporal coherence over the study area and dates, with coherence remaining high even for the longest temporal baselines tested.
This document summarizes key concepts in radar imaging and measurement using radar. It discusses real-aperture ground imaging radar and how resolution varies with distance. It also covers radar altimetry and how altitude is measured. Finally, it describes techniques for signal integration like coherent integration, which improves signal-to-noise ratio by combining signals while maintaining their phase information.
This document summarizes a study that used wide-swath interferometric synthetic aperture radar (InSAR) time series to map large-scale ground deformation over the Danakil depression in the Afar region of Ethiopia between 2006 and 2009. The time series analysis revealed deformation signals consistent with magmatic intrusions and inflation/deflation of volcanic centers. Modeling of the deformation supported deep magma intrusion beneath the central segment and lateral magma propagation and chamber inflation beneath Dabbahu volcano in the northern segment. The study demonstrated the potential of wide-swath InSAR time series for mapping long-wavelength ground deformation over large areas.
FR4.L09 - KARIN – THE KA-BAND RADAR INTERFEROMETER ON SWOT: MEASUREMENT PRINC...grssieee
1. KaRIn is a Ka-band radar interferometer on the upcoming SWOT satellite mission that will measure water surface heights globally with unprecedented resolution and accuracy for both oceanography and hydrology applications.
2. KaRIn uses interferometry between a master and slave antenna to measure absolute surface heights, but requires auxiliary data and phase unwrapping to resolve the height ambiguity.
3. Processing of KaRIn data involves SAR processing, interferometry, geolocation, and extraction of water heights and slopes from the phase, with challenges including speckle noise and strong layover effects from the near-nadir viewing geometry.
The document discusses an airborne DInSAR study conducted over São Sebastião, Brazil to monitor terrain movements that could impact oil and gas pipelines. P-band and X-band data were acquired in 2009 and 2010 and processed to generate deformation maps. P-band results had sub-centimeter accuracy and detected movements in forested areas, while X-band detected millimeter movements in urban areas. Comparisons to in-situ sensors showed correlations. The study demonstrated airborne DInSAR is well-suited for monitoring complex terrain and vegetation areas for natural and potentially hazardous movements.
MONITORING FOREST MANAGEMENT ACTIVTIES USING AIRBORNE LIDAR AND ALOS PALSAR.pptxgrssieee
This document summarizes a study that used airborne LiDAR and ALOS PALSAR satellite data to monitor forest management activities. The study used LiDAR to identify individual tree locations and heights before and after thinning. Stem volume changes were then estimated and related to changes in PALSAR backscattering coefficients. The results showed that HV polarization was more sensitive than HH to biomass changes from thinning, and the HV/HH axis rotated towards increasing HV values after thinning. Future work could utilize full polarization data and interferometry to better monitor biomass changes over larger areas.
TH4.L10.2: SMAPEX: SOIL MOISTURE ACTIVE PASSIVE REMOTE SENSING EXPERIMENT FOR...grssieee
The SMAPex experiment aims to:
1) Verify algorithms for retrieving soil moisture from SMAP radar and radiometer data individually.
2) Use SMAP radar data to aid soil moisture retrieval from the lower resolution radiometer and produce an active-passive soil moisture product.
3) Simulate SMAP observations with airborne radar and radiometer instruments during field campaigns and collect ground observations of soil moisture and vegetation to validate retrieval algorithms.
This document proposes a new radiometric concept called a cross-beam interferometer to retrieve 3D profiles of atmospheric temperature and water vapor density. It would use two antennas separated by a distance to measure brightness temperatures from different atmospheric volumes independently, without being subject to the cumulative effects of the radiative transfer equation. Theoretical development and initial simulation results exploring the technique's spatial resolution and sensitivity to antenna spacing are presented. Open issues that require further study include calibration methods, estimating radiometric resolution for water vapor content retrieval accuracy, and performing onion peeling retrievals from simulated atmospheres.
This document proposes a new radiometric concept called a cross-beam interferometer to retrieve 3D profiles of atmospheric temperature and water vapor density. It would use two antennas separated by a distance to measure brightness temperatures from different atmospheric volumes independently, without being subject to the cumulative effects of the radiative transfer equation. Theoretical development and initial simulation results exploring the technique's spatial resolution and sensitivity to antenna spacing are presented. Open issues that require further study include calibration methods, estimating radiometric resolution for water vapor content retrieval accuracy, and applying retrieval techniques like "onion peeling" to simulated atmospheres.
The document discusses experiments performed using TerraSAR-X (TSX) and TanDEM-X (TDX) satellites to demonstrate capabilities of distributed imaging with bi-static SAR systems. Three key experiments are described:
1) Super resolution in range was achieved through step-frequency acquisitions from both satellites, combining the signals coherently to increase range resolution beyond the individual satellite limitations.
2) Super resolution in azimuth used the satellites' Doppler offsets to synthesize a signal with twice the azimuth resolution of either satellite alone.
3) Quad-polarized images were synthesized from dual-polarized acquisitions from each satellite, using one polarization for imaging and the other for calibration.
Application of Seismic Reflection Surveys to Detect Massive Sulphide Deposits...iosrjce
Seismic reflection techniques, the most widely used geophysical method for hydrocarbon exploration
has the capability to delineate and provide better images of regional structure for exploration of mineral
deposits in any geological settings. Previous tests on detection and imaging of massive sulphide ores using
seismic reflection techniques have been done mostly in crystalline environments. Application of seismic
reflection techniques for imaging sedimentary hosted massive sulphide is relatively new and the few experiments
carried out are at local scale (<500m). In this study, we analyze the feasibility of such regional exploration by
modelling three massive sulphide ore and norite lenses scenario using 2D seismic survey with relatively sparse
source-receiver geometry to image these deposits within 1.5km depth range. Results from the modelling
experiment demonstrate that 2-Dimensional seismic reflections survey can be used to detect massive sulphides
at any scale. The test further indicates that geologic setting and acquisition parameters are very important for
the detection of these ore bodies. Overall, the outcomes of the results support our started objective which is to
demonstrate that seismic reflection surveys can be used to detect the presence of sediment hosted massive
sulphides at regional scale
1) A land cover map of Africa was created at 100m resolution using dual-polarization ALOS PALSAR data from 2007.
2) A preliminary approach used HV backscatter thresholds but a refined analysis considered topography, water detection, and ancillary data.
3) The map was validated against other datasets with an accuracy of 72.4% for land cover classes and 88.3% for forest/non-forest.
The document analyzes different geodata resolutions (1m, 5m, 10m) for coverage prediction accuracy in urban, suburban, and rural morphologies. For urban and suburban areas, 5m resolution is recommended as the delta between 1m and 5m predictions is marginal. For rural areas, 10m resolution can be considered as the deltas between 1m and 10m are smaller than in urban/suburban areas. The key factors analyzed are coverage prediction, histograms, statistics, and percentage deltas between resolutions.
WaReS is a code developed by Marine Analytica to calculate loads and responses of floating structures. This memo presents an extract of the verification report.
TH1.L09 - ACCURATE FOCUSING OF SINGLE-PASS AIRBORNE INSAR DATA AT L-BANDgrssieee
The document evaluates different focusing and motion compensation techniques for processing single-pass airborne polarimetric interferometric synthetic aperture radar (PolInSAR) data at L-band. It finds that omega-k focusing with dual-line motion compensation is sufficient for moderate resolutions but that time domain backprojection with terrain-based motion compensation improves performance for high-resolution and high-squint applications. Future work includes system re-calibration, further PolInSAR performance evaluation, and speeding up the time domain implementation.
A network of scientists is cooperating within the COST Action "Harmonious" to promote UAS monitoring strategies and establish harmonized practices. The action has 36 partner countries and aims to transfer advances in UAS methods through a global network. It has five working groups focused on data processing, vegetation monitoring, soil moisture, streamflow monitoring, and harmonization. The overall goal is to increase the capacity to describe water resources and assist management through consistent UAS monitoring of key variables.
1. Relating Tropical Forest Biomass to
P-Band SAR Tomography
D. Ho Tong Minh - IRSTEA, UMR TETIS
With
T. Le Toan1 , F. Rocca2, S. Tebaldini2
(1) Centre d'Ėtudes Spatiales de la Biosphère (CESBIO),
Toulouse, France
(2)Dipartimento di Elettronica e Informazione
Politecnico di Milano, Italy
2. 2
P-band SAR BIOMASS mission
What can tomography bring to BIOMASS ?
Operation concept Baseline Option
Tomographic phase
Nominal phase
Coverage
3 months 1 year
4.7 years 4 years
Optional concepts are ~90 kg heavier than the baseline.
“ESAC commends the innovation embodied in the tomographic aspect of the mission,
and considers this capability a highly desirable feature. ESAC therefore recommends
that the optional tomographic mode be operated for as long as is allowed by the need
to keep some contingencies in the design and operation of the satellite.”
Comments of ESAC on 22nd April 2013:
Selected as 7th Earth Explorer Core Mission of ESA on 7 May 2013
Selected transects Global
3. 3
Introduction
• Even at P-Band, Radar intensity tends to saturate for very high biomass density (
> 300 t/ha) Information about forest structure becomes crucial
=> 3D P-band SAR Tomography for forests
4. 4
P-band SAR tomography
key tool to SEE through the forest
good resolution along the three spatial dimensions
suitable long wavelength to penetrate the dense forest layer
Model independent polarimetric SAR Tomography
not relying on any particular assumption about the observed scene
providing resolution along the vertical direction
exploiting the relationship (a Fourier transform) linking reflectivity and multi-baseline signal
Introduction
5. 5
Preliminary issues
✕
PSF
elevation
ground range
✕
PSF
ground range
elevation
elevation
ground range
reference
height
height
above a
fixed
reference
Airborne SAR surveys are often
characterized by deviations of the
platform from the nominal trajectory.
A non regular sampling of the total
baseline aperture follows.
As a consequence, the Point Spread
Function (PSF) along the cross-range
direction exhibits undesired side-lobes.
Standard interferometric processing
removes the phases associated with a
constant elevation along the images.
The local topography is not taken into
account so that height measurements are
not referred to the ground level.
Being the goal the exploration of the
forest layer, the topographic contribution
shall be removed.
✕
✕
✕
✕
✕
✕
✕
✕
✕
✕
✕✕
✕
✕
1.Terrain topography
2. Baseline sampled irregularly
6. 6
Terrain flattening
Volume Contributions tomography
Ground Contributions tomography
200 600 1000 1400 1800 2200
-10
0
10
20
30
40
50
60
200 600 1000 1400 1800 2200
-10
0
10
20
30
40
50
60
SAR
data
Decomposition
In Sum of
Kronecker
Products
Volume only
covariance
matrix
Rvolume
Ground only
covariance
matrix
Rground
Estimations of the
interferometric
phases associated
with the ground
Phase calibrated
The removal of the interferometric phases
associated with the ground level makes the local
elevation of the terrain the reference height.
Hereinafter, 0m always refers to the ground level
regardless of the actual topography.
The phases are determined by the optical
wavepath so that the effects due to
uncompensated platform motion are removed too.
elevation
ground range
space-varying
reference height
height
above
the
ground
✕
7. 7
Baseline interpolation
Performing linear interpolation:
The distortion is minimized if, before
the interpolation, the reflectivity profile
is shifted around 0 m.
reflectivity
profile
(original
signal)
elevation [m]
0
40
Fourier
domain
(original
domain)
→
→
0
40
profile
shift
(signal
demodulation)
0
40
✕
spectra
multiplication
(interpolation)
0
40
profile shifted
back
(interpolated
signal)
0
40
(interpolated
baseband signal)
resulting
profile
elevation [m]
8. 8
From multi-baseline to multi-layer
q
elevation
0
1
2
n b1
b2
db
r
jxrPxry nn
4
exp,,,
q
sin
2 maxb
r
z
Complex reflectivity along cross-range () direction and signal along
image index are related by a Fourier Transform.
The baseline distribution determines the vertical resolution
z
The Guyaflux tower (camera )
Spatial frequencies along the
baseline axis correspond to
above ground elevations.
SAR Tomography
9. 9
Investigated site
Paracou
Nourgues
French Guiana
Data from TropiSAR 2009 – ESA
System Sethi - ONERA
Scene Tropical forests
forest height ≈ 30 m
Biomass : 200-600 t/ha
Carrier frequency P-Band with 125 MHz bandwidth
Data 5/6 tracks Full-Pol
11. 11
0 20 40 60
LiDAR top height
HH spectrum
Height[m]
Azimuth [m]
1000 1500 2000 2500 3000 3500 4000 4500 5000
-20
0
20
40
60
HV spectrum
Height[m]
Azimuth [m]
1000 1500 2000 2500 3000 3500 4000 4500 5000
-20
0
20
40
60
0 0.5 1
TomoSAR to understand Scattering Mechanisms
Contributions from the ground
level beneath the forest are
observed.
However, significant scattering
contributions are observed at
the canopy level in HH
polarization, whereas this
volume scattering contribution is
dominating in HV polarization.
ESA BIOSAR 2008 campaign (DLR)
Boreal forest : Krycklan, Northern Sweden
forestheight51≈m
The scattering mechanisms are
dominately linked to the ground level.
Algorithm: Capon
HV spectrum
Height[m]
Slant range [m]
4500 5000 5500 6000 6500
0
20
40
60
12. 12
Multi-layer
Note:
Height is always measured with respect to terrain elevation
a
0m
10m
20m
40m
30m
SAR Tomography resolution cell
a
0m
10m
20m
40m
30m
SAR resolution cell
13. 13
Terrain topography [m]
-10
0
10
20
30
12
3
4
5
6
78
9
10
11
12
13
14
15
16
15 m layer
45 m layer
Azimuth [m]
500 1000 1500 2000 2500 3000 3500
30 m layer
Azimuth [m]
Groundrange[m]
500 1000 1500 2000 2500 3000 3500
2000
4500
Ground layer
Groundrange[m]
2000
4500
-20
-15
-10
-5
0
5
-20
-15
-10
-5
0
5
-20
-15
-10
-5
0
5
-20
-15
-10
-5
0
5
-20
-15
-10
-5
0
5
Original image
Groundrange[m]
2000
4500
A
A’
Backscattered power HV
Multi-layer
The ground and the top
(45 m) layers show strong
topographic effects.
The middle layer images
appear much less affected
by topography.
Cells inside the canopy are
always filled up by trunk and
woody branches
irrespective of the ground
slope, resulting in the
topographic slope to have a
minor effect on signal
power.
14. 14
TomoSAR to understand how to retrieve biomass
Original image
Groundrange[m]
2000
4500
12
3
4
5
6
78
9
10
11
12
13
14
15
16
a
0m
SAR resolution cell Intensity (dB) Intensity - biomass
Paracou
15m
30m Original image, rP = 0.37, Slope = 0.51
1 2 3 4 5 6
-20
-15
-10
-5
0
gHV
[dB]
100 t/ha
-20 -15 -10 -5 0 5 200 t/ha - 600 t/haBest fit line
in-situ Paracou
in-situ Nouragues
15. 15
a
0m
30m
TomoSAR resolution cell
30 m layer
Azimuth [m]
Groundrange[m]
500 3500
2000
4500
Ground layer (0 m)
Groundrange[m]
2000
4500
-20 -15 -10 -5 0 5
Original image
Groundrange[m]
2000
4500
12
3
4
5
6
78
9
10
11
12
13
14
15
16
200 t/ha - 600 t/ha
a
0m
15m
30m
SAR resolution cell
Height is always measured with respect
to terrain elevation.
Intensity (dB) Intensity - biomass
TomoSAR to understand how to retrieve biomass
Layer 0m, rP = -0.2, Slope = -0.29
1 2 3 4 5 6
-20
-15
-10
-5
0
gHV
[dB]
Layer 30m, rP = 0.75, Slope = 1.84
1 2 3 4 5 6
-20
-15
-10
-5
0
gHV
[dB]
Original image, rP = 0.37, Slope = 0.51
1 2 3 4 5 6
-20
-15
-10
-5
0
gHV
[dB]
Paracou
Best fit line
in-situ Paracou
in-situ Nouragues
100 t/ha
15m
16. 16
Discussion
For the layers below 15 m, the correlation is very
weak (and negative). This can be explained by: i)
extinction; and ii) double bounces that dominate
whenever the topography is flat (about 10° lobe
width)
The 15 m layer shows almost no correlation (and no sensitivity) (<0.15). One
hypothesis is that this layer is constituted by trunks, and presents the same
characteristics among the 85 forest plots under study.
For layers between 20 m and 40 m, the correlation
becomes highly significant, implying that: i) the
perturbing effect of the ground contribution is
minimized; and ii) there is a strong correlation
between the biomass contained in this layer and the
total above ground biomass (0.92 by TROLL).
-10 -5 0 5 10
-100
-50
0
Ground slope [degree]
[degreee]
Co-polar phase SHH
SVV
layer ground
layer 15 m
The correlation between the backscattered power and biomass
J. Chave, “Study of structural, successional and spatial patterns in tropical rain forests
using TROLL, a spatially explicit forest model,” Ecological Modelling, pp. 233–254, 1999
200 300 400 500 600 700 800
0
50
100
150
200
250
300
350
400
Above-ground biomass (t.ha-1
)
Biomassofthe20-40mlayer(t.ha-1)
rP
= 0.92
17. 17
Training on stratified subset of
Nouragues data. Performance
assessed on data from Paracou.
Plot size 100 m x 100 m
Transferability : Cross-validation site
Training on stratified subset of
Paracou data. Performance
assessed on data from
Nouragues.
Plot size 100 m x 100 m
Training: Nouragues
Validation: Paracou
Training: Paracou
Validation: Nouragues
(a) (b)
0 100 200 300 400 500 600
0
100
200
300
400
500
600
Reference biomass (t/ha)
Retrievedbiomass(t/ha)
RMSE = 64.83 (t/ha)
= 18.35 (%)
rP
= 0.8
0 100 200 300 400 500 600
0
100
200
300
400
500
600
Reference biomass (t/ha)
Retrievedbiomass(t/ha)
RMSE = 58.66 (t/ha)
= 16.6 (%)
rP
= 0.72
D. Ho Tong Minh, T. Le Toan, F. Rocca, S. Tebaldini, L. Villard, M. Rejou-Mechain, J. Chave, K. Scipal. "SAR tomography for the
retrieval of forest biomass and height : cross-validation at two tropical forest sites in French Guiana". Remote Sensing of
Environment. under revision.
D. Ho Tong Minh, T. Le Toan, F. Rocca, S. Tebaldini, M. Mariotti d’Alessandro, and L. Villard, “Relating P-band SAR tomography to
tropical forest biomass”, IEEE Transactions on Geoscience and Remote Sensing, Vol. 52, No. 2, pp. 967-979, Feb. 2014.
18. 18
D. Ho Tong Minh, S. Tebaldini, F. Rocca, T. Le Toan, L. Villard, and P. Dubois-Fernandez, "Capabilities of BIOMASS Tomography
for Investigating Tropical Forests," Geoscience and Remote Sensing, IEEE Transactions on , vol.PP, no.99, pp.1-11,
doi: 10.1109/TGRS.2014.2331142.
Implications : BIOMASS @ 6 MHz
6 MHz spaceborne geometry
0 100 200 300 400 500 600
0
100
200
300
400
500
600
In situ above-ground biomass (t/ha)
Retrievedbiomass(t/ha)
RMSE = 35.02 (t/ha)
= 9.86 (%)
6 MHz airborne geometry
0 100 200 300 400 500 600
0
100
200
300
400
500
600
In situ above-ground biomass (t/ha)
Retrievedbiomass(t/ha) RMSE = 35.39 (t/ha)
= 9.97 (%)
0 100 200 300 400 500 600
0
100
200
300
400
500
600
RMSE = 18.74 (t/ha)
= 5.28 (%)
In situ above-ground biomass (t/ha)
Retrievedbiomass(t/ha)
125 MHz
rP = 0.94
R2 = 0.89
p << 0.00001
rP = 0.83
R2 = 0.69
p = 0.00008
rP = 0.84
R2 = 0.70
p = 0.00005
Results at 6 MHz in both the spaceborne geometry and the airborne geometry appear
to be well consistent with those observed in the 125-MHz case, indicating that the 30-
m layer appears to be the most informative about the AGB.
Paracou forest: Plot size 250 m x 250 m
Observation Observation Simulation
19. 19
Forest biomass prediction
Colors on the map represent the
amount of biomass density in a
continuum fashion.
This is consistent with the 16
permanent plots available.
The map helps to point out many
places which have been never
been measured and reported.
0 200 400 600
20. 20
BIOMASS MISSION : TOMOSAR L2/L3 PROCESSOR
Product Resolution
TomoSAR cube
for all
polarization pairs
( T3(x,y,z) )
The same as SLC spatial
resolution
Approx. 20 m vertical
resolution
Note
Linear focusing by Fourier
Transform
Radiometric accuracy preserver
x is latitude (in WGS 84 datum)
y is longitude (in WGS 84 datum)
z is height above the ground
21. 21
Conclusions
SAR tomography allows to map not only vertical forest
structure but also biomass.
The scattering mechanisms at P-band in a very dense
tropical forest:
It was found that scattering contributions from about 30 m
above ground exhibit high sensitivity to forest biomass
value ranging from 250 t/ha to 450 t/ha.
Ground scattering is strongly visible and double bounces in flat
terrain topography are visible everywhere.
Volume scattering is significantly related to the high range biomass