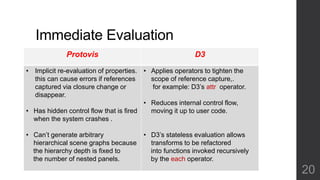
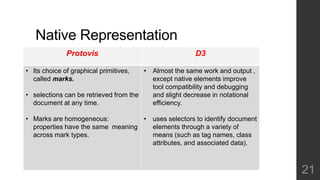
D3: Data-Driven Documents 
Michael Bostock, Vadim Ogievetsky and Jeffrey Heer 
Prepared by : Mohamed Sweelam 
1
2
Data Visualization 
• What is data visualization ? 
• Why is data visualization important? 
• What is the power of using data visualization ? 
3
Abstract 
• Data-Driven Documents is a novel representation-transparent 
approach to visualization for the web. 
• D3 enables direct inspection and manipulation of a native 
representation: the standard document object model (DOM). 
• With D3, designers selectively bind input data to arbitrary document 
elements. 
• applying dynamic transforms to both generate and modify 
content using DOM. 
4
Good Graphic 
• Presentation ( What to Whom, How and Why ). 
• Graphical Display Options: 
$ Sorting and Ordering. 
$ Adding Model or Statistical Information. 
$ Captions, Legends and Annotations. 
$ Positioning in Text. 
$ Colors. 
$ Scales (Using data standardization). 
5
Good Graphic 
6
Introduction 
• Building visualizations requirements. 
• Visualization toolkits problem due to encapsulation 
of the DOM with more specialized forms. 
• The need of balancing expressiveness, efficiency and 
accessibility with taking in account three objectives : 
$ Compatibility. 
$ Debugging. 
$ Performance. 
7
Document Transformers 
• Browsers Built-In APIs for manipulating the DOM 
these interfaces are verbose and cumbersome. 
• Enhancing these techniques using smart libraries as 
JQuery, JS and CSS. 
Tree Map 8
Graphics Libraries 
• Low level graphics are tedious for complex visualization 
tasks as they lack convenient abstractions. 
• The lack of supporting debugging is also a problem. 
• Toolkit specific scene graph abstractions diminish 
compatibility and expressiveness. 
9
Design 
• D3 atomic operand is Selection: a filtered set of elements 
queried from the current document . 
• Operators act on selections, modifying content. 
• Data joins bind input data to elements, and producing enter 
and exit sub-selections for the creation. 
• Animated transitions are applied by default. 
• Numerous helper Modules such layouts and scales simplify 
common visualization tasks. 
10
Visualization Problem 
11 
• The basic problem in visualization still is the physical limitation of 
computer screens. 
• Some solutions are invented to overcoming the restrictions of two-dimensionality: 
I. Using virtual reality environment with rotation principle. 
II. Project high-dimensional data onto 2-D coordinate system using data-reduction 
method such as principal component analysis (PCA). 
III. Using parallel coordinates system. 
IV. Link view displays.
12 
A smart technique to interact with micro and macro features simultaneously. 
(Focus + Context)
Selections 
• Selections are a core concept in D3. 
• Based on CSS selectors. Selection in d3 is a filter that 
manage every element inside the data, It is also serving as 
namespace. 
13
Data 
• The data operator binds input data to selected nodes. 
• Once data is bound to elements, it is passed to functional 
operators as the first argument (by convention, d), along 
with the numeric index (i). 
14
Interaction and Animation 
• The DOM supports event listeners. 
• D3’s focus on transformations simplifies the specification of 
scene changes in response to user events; 
• The major point is events always involves with 
transformation “Animated transitions” . 
15
Animation 
16
Modules 
• D3’s kernel achieves flexibility through representational 
transparency; this also minimizes the library’s conceptual 
surface area by presenting less to learn. 
• “ Don’t get it original , Get it right “ . 
• D3’s optional modules encapsulate reusable solutions to 
common problems like “SVG” module. 
17
Design Rotation 
• Unlike Protovis excels at concise specifications of static 
scenes and it is a declarative language for visualization 
design with browsers . 
• D3’s transformations make dynamic visualizations easier to 
implement. By adopting immediate evaluation of operators 
and the browser’s native representation. 
18
Transformation 
Protovis: D3 
• Implicitly. 
• Changing data and prosperities 
are slow. 
• Re-evaluate all properties, even 
those whose definitions or input 
data have not changed. 
• Propagate the changes to the 
intermediate scene graph out to the 
native SVG. 
• Explicitly. 
• Specifications are data-driven. 
• Transformations better enable 
dynamic visualizations. 
• Eliminate redundant computation 
touching only the elements and 
attributes that 
need updating. 
19
Immediate Evaluation 
Protovis D3 
• Implicit re-evaluation of properties. 
this can cause errors if references 
captured via closure change or 
disappear. 
• Has hidden control flow that is fired 
when the system crashes . 
• Can’t generate arbitrary 
hierarchical scene graphs because 
the hierarchy depth is fixed to 
the number of nested panels. 
• Applies operators to tighten the 
scope of reference capture,. 
for example: D3’s attr operator. 
• Reduces internal control flow, 
moving it up to user code. 
• D3’s stateless evaluation allows 
transforms to be refactored 
into functions invoked recursively 
by the each operator. 
20
Native Representation 
Protovis D3 
• Its choice of graphical primitives, 
called marks. 
• selections can be retrieved from the 
document at any time. 
• Marks are homogeneous: 
properties have the same meaning 
across mark types. 
• Almost the same work and output , 
except native elements improve 
tool compatibility and debugging 
and slight decrease in notational 
efficiency. 
• uses selectors to identify document 
elements through a variety of 
means (such as tag names, class 
attributes, and associated data). 
21
22

D3 : Data driven documents with Data visualization principles .

  • 1.
    D3: Data-Driven Documents Michael Bostock, Vadim Ogievetsky and Jeffrey Heer Prepared by : Mohamed Sweelam 1
  • 2.
  • 3.
    Data Visualization •What is data visualization ? • Why is data visualization important? • What is the power of using data visualization ? 3
  • 4.
    Abstract • Data-DrivenDocuments is a novel representation-transparent approach to visualization for the web. • D3 enables direct inspection and manipulation of a native representation: the standard document object model (DOM). • With D3, designers selectively bind input data to arbitrary document elements. • applying dynamic transforms to both generate and modify content using DOM. 4
  • 5.
    Good Graphic •Presentation ( What to Whom, How and Why ). • Graphical Display Options: $ Sorting and Ordering. $ Adding Model or Statistical Information. $ Captions, Legends and Annotations. $ Positioning in Text. $ Colors. $ Scales (Using data standardization). 5
  • 6.
  • 7.
    Introduction • Buildingvisualizations requirements. • Visualization toolkits problem due to encapsulation of the DOM with more specialized forms. • The need of balancing expressiveness, efficiency and accessibility with taking in account three objectives : $ Compatibility. $ Debugging. $ Performance. 7
  • 8.
    Document Transformers •Browsers Built-In APIs for manipulating the DOM these interfaces are verbose and cumbersome. • Enhancing these techniques using smart libraries as JQuery, JS and CSS. Tree Map 8
  • 9.
    Graphics Libraries •Low level graphics are tedious for complex visualization tasks as they lack convenient abstractions. • The lack of supporting debugging is also a problem. • Toolkit specific scene graph abstractions diminish compatibility and expressiveness. 9
  • 10.
    Design • D3atomic operand is Selection: a filtered set of elements queried from the current document . • Operators act on selections, modifying content. • Data joins bind input data to elements, and producing enter and exit sub-selections for the creation. • Animated transitions are applied by default. • Numerous helper Modules such layouts and scales simplify common visualization tasks. 10
  • 11.
    Visualization Problem 11 • The basic problem in visualization still is the physical limitation of computer screens. • Some solutions are invented to overcoming the restrictions of two-dimensionality: I. Using virtual reality environment with rotation principle. II. Project high-dimensional data onto 2-D coordinate system using data-reduction method such as principal component analysis (PCA). III. Using parallel coordinates system. IV. Link view displays.
  • 12.
    12 A smarttechnique to interact with micro and macro features simultaneously. (Focus + Context)
  • 13.
    Selections • Selectionsare a core concept in D3. • Based on CSS selectors. Selection in d3 is a filter that manage every element inside the data, It is also serving as namespace. 13
  • 14.
    Data • Thedata operator binds input data to selected nodes. • Once data is bound to elements, it is passed to functional operators as the first argument (by convention, d), along with the numeric index (i). 14
  • 15.
    Interaction and Animation • The DOM supports event listeners. • D3’s focus on transformations simplifies the specification of scene changes in response to user events; • The major point is events always involves with transformation “Animated transitions” . 15
  • 16.
  • 17.
    Modules • D3’skernel achieves flexibility through representational transparency; this also minimizes the library’s conceptual surface area by presenting less to learn. • “ Don’t get it original , Get it right “ . • D3’s optional modules encapsulate reusable solutions to common problems like “SVG” module. 17
  • 18.
    Design Rotation •Unlike Protovis excels at concise specifications of static scenes and it is a declarative language for visualization design with browsers . • D3’s transformations make dynamic visualizations easier to implement. By adopting immediate evaluation of operators and the browser’s native representation. 18
  • 19.
    Transformation Protovis: D3 • Implicitly. • Changing data and prosperities are slow. • Re-evaluate all properties, even those whose definitions or input data have not changed. • Propagate the changes to the intermediate scene graph out to the native SVG. • Explicitly. • Specifications are data-driven. • Transformations better enable dynamic visualizations. • Eliminate redundant computation touching only the elements and attributes that need updating. 19
  • 20.
    Immediate Evaluation ProtovisD3 • Implicit re-evaluation of properties. this can cause errors if references captured via closure change or disappear. • Has hidden control flow that is fired when the system crashes . • Can’t generate arbitrary hierarchical scene graphs because the hierarchy depth is fixed to the number of nested panels. • Applies operators to tighten the scope of reference capture,. for example: D3’s attr operator. • Reduces internal control flow, moving it up to user code. • D3’s stateless evaluation allows transforms to be refactored into functions invoked recursively by the each operator. 20
  • 21.
    Native Representation ProtovisD3 • Its choice of graphical primitives, called marks. • selections can be retrieved from the document at any time. • Marks are homogeneous: properties have the same meaning across mark types. • Almost the same work and output , except native elements improve tool compatibility and debugging and slight decrease in notational efficiency. • uses selectors to identify document elements through a variety of means (such as tag names, class attributes, and associated data). 21
  • 22.