Download to read offline


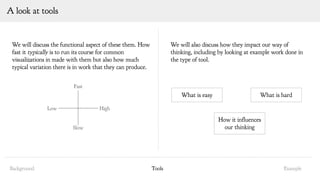
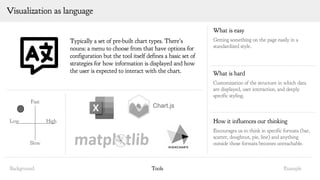

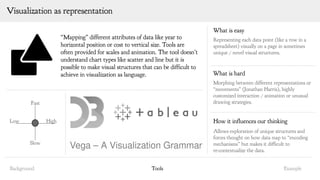


The document discusses various tools for building data visualizations and their functional and philosophical implications. It contrasts different visualization approaches such as language, representation, and drawing, highlighting the ease and challenges associated with each. Additionally, it presents examples and provides perspectives on how the choice of tools can influence both the creation and understanding of visual data.